Category: Indentation | Hardness and Elastic

Dynamic Mechanical Analysis of Cork Using Nanoindentation

Mechanical Properties of Hydrogel

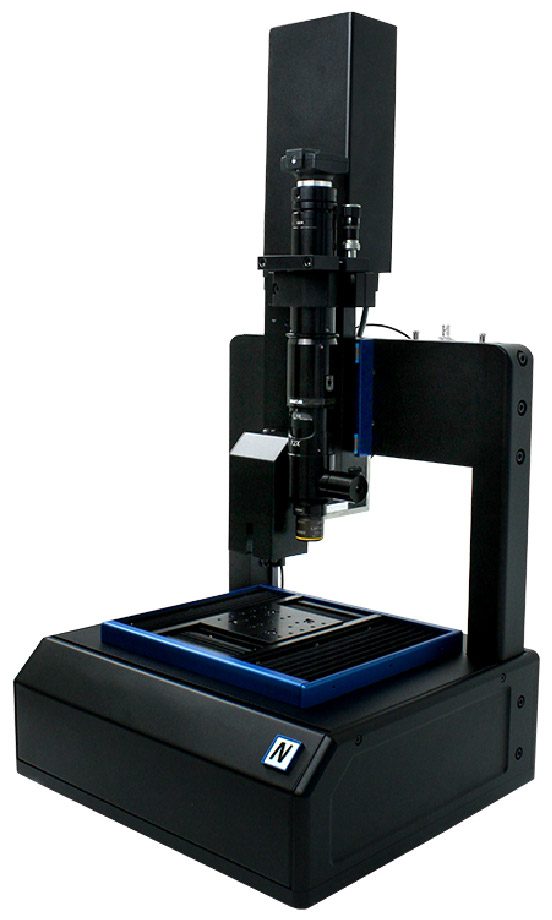
The World’s Leading Micro Mechanical Tester

Multiphase Metal Nanoindentation

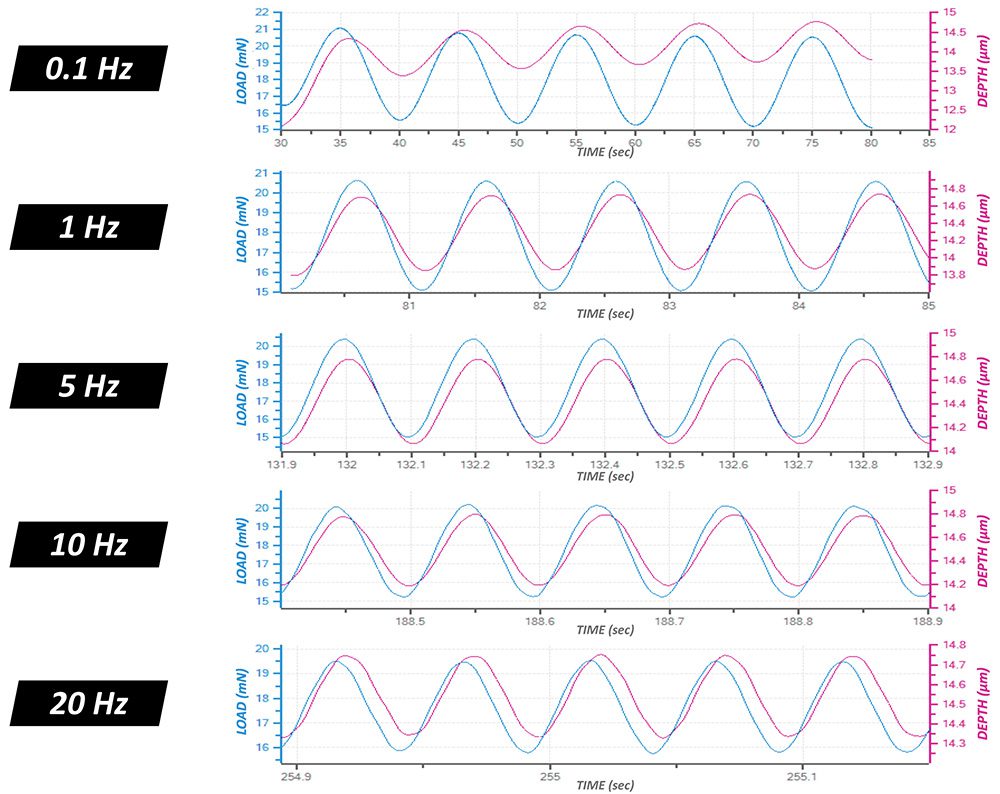
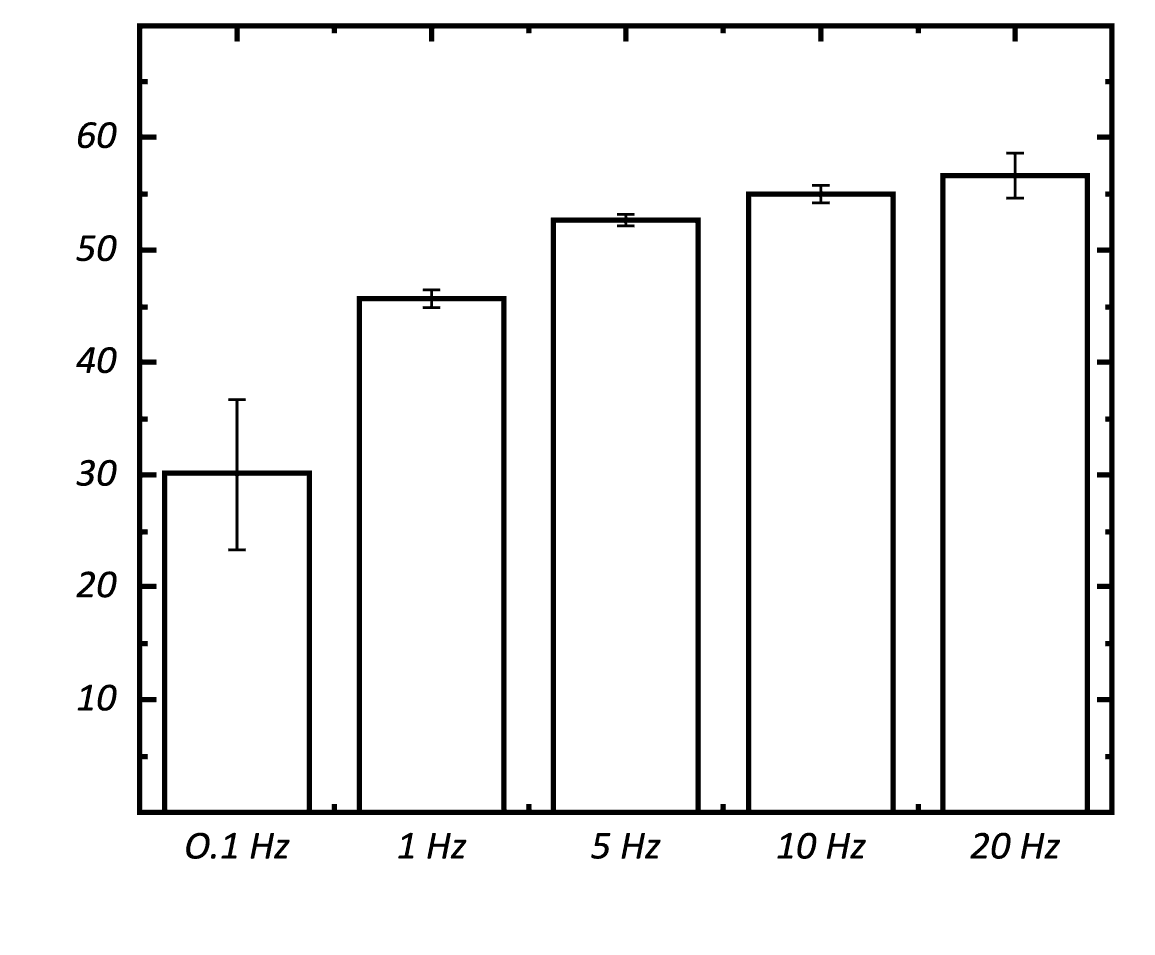
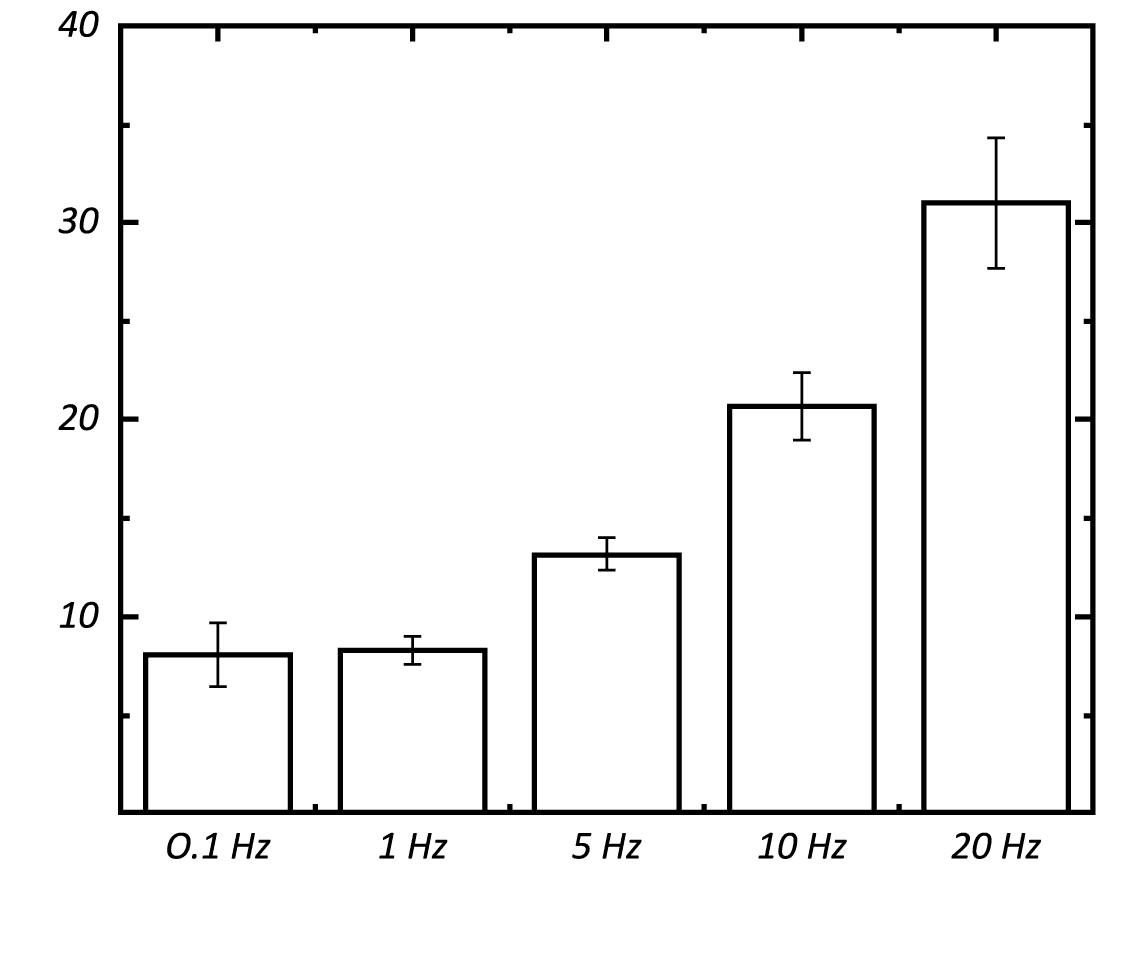
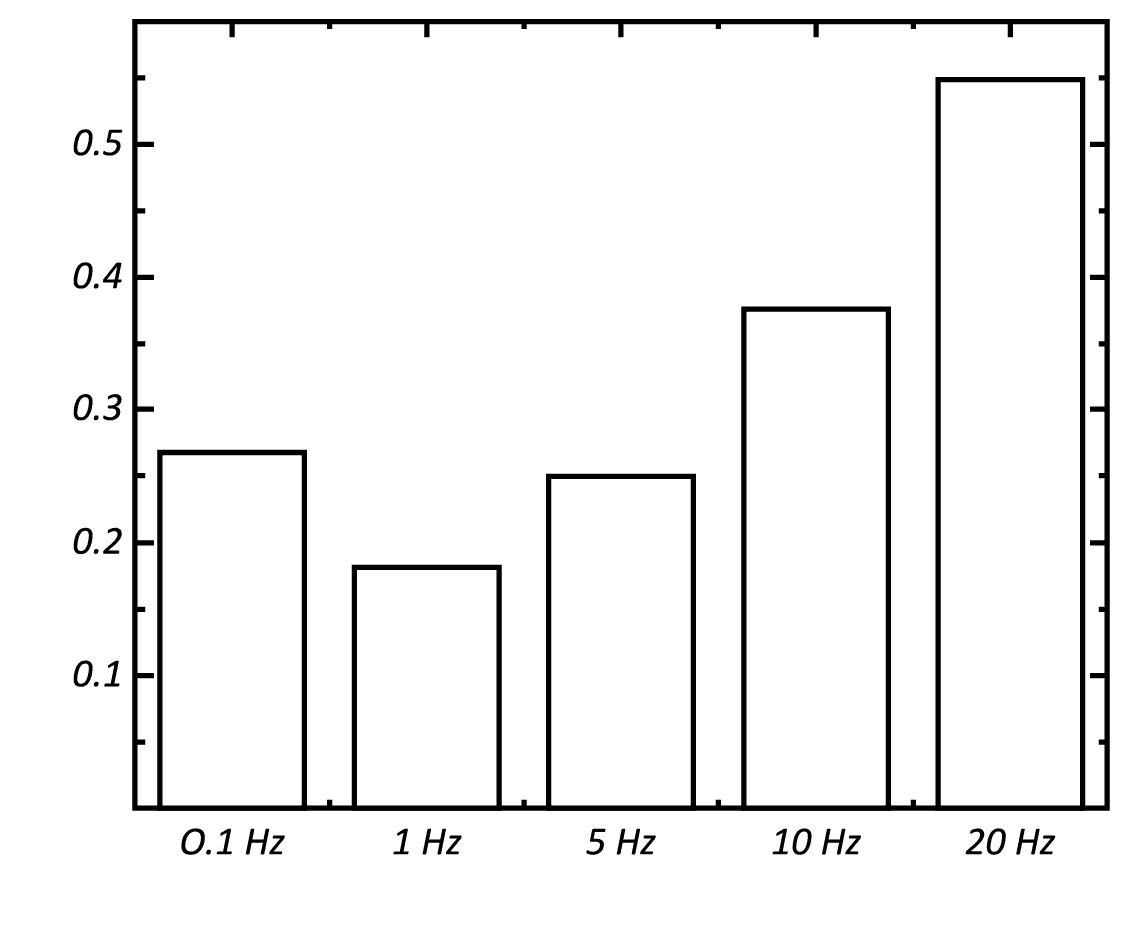
Dynamic Mechanical Analysis (DMA) Frequency Sweep on Polymer

Microparticles: Compression Strength and Micro Indentation

Ceramics: Nanoindentation Fast Mapping for Grain Detection
INTRODUCTION
Nanoindentation has become a widely applied technique for measuring mechanical behaviors of materials at small scalesi ii. The high-resolution load-displacement curves from a nanoindentation measurement can provide a variety of physicomechanical properties, including hardness, Young’s modulus, creeping, fracture toughness and many others.
Importance of Fast Mapping Indentation
One significant bottleneck for further popularization of the nanoindentation technique is time consumption. A mechanical property mapping by conventional nanoindentation procedure can easily take hours which hinders the application of the technique in mass production industries, such as semiconductor, aerospace, MEMS, consumer products such as ceramic tiles and many others.
Fast mapping can prove to be essential in the ceramic tile manufacturing industry, Hardness and Young’s modulus mappings across a single ceramic tile can present a distribution of data that indicates how homogeneous the surface is. Softer regions on a tile can be outlined in this mapping and show locations more prone to failure from physical impacts that happen on a day to day basis in someone’s residence. Mappings can be made on different types of tiles for comparative studies and on a batch of similar tiles to measure tile consistency in a quality control processes. The combination of measurements setups can be extensive as well as accurate and efficient with the fast mapping method.
MEASUREMENT OBJECTIVE
In this study, the Nanovea Mechanical Tester, in FastMap mode is used to map the mechanical property of a floor tile at high speeds. We showcase the capacity of the Nanovea Mechanical Tester in performing two fast nanoindentation mappings with high precision and reproducibility.
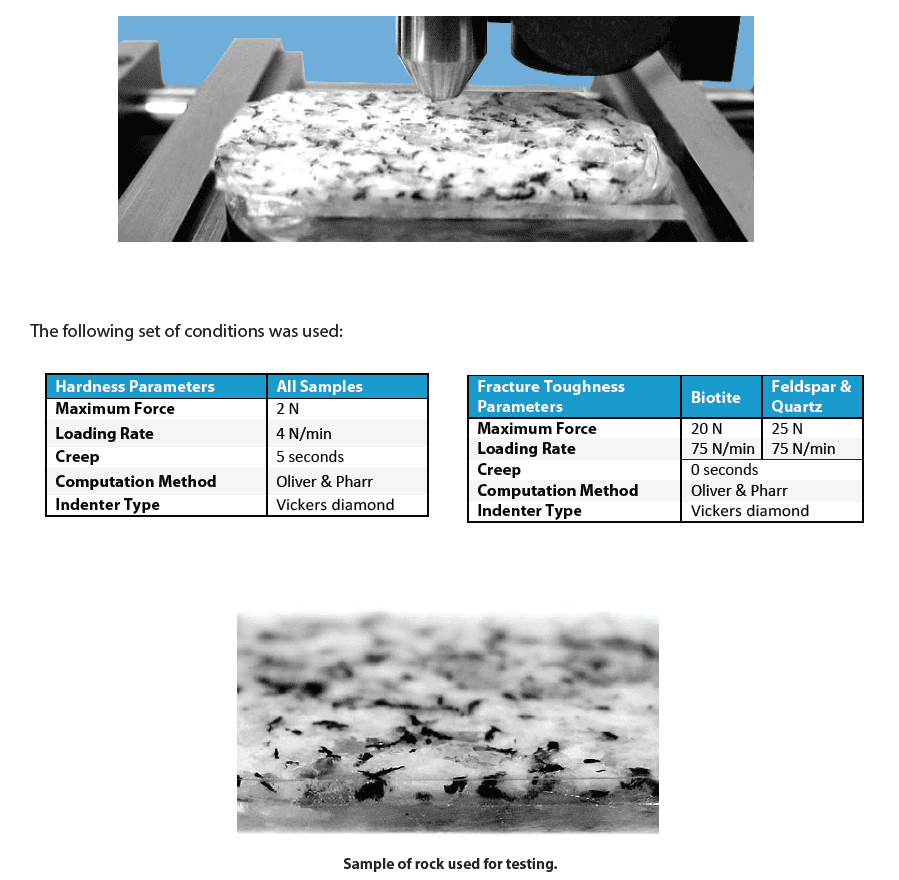
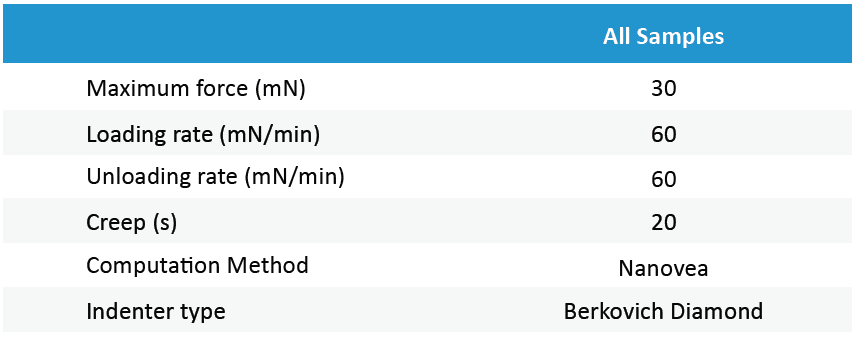
Test Conditions
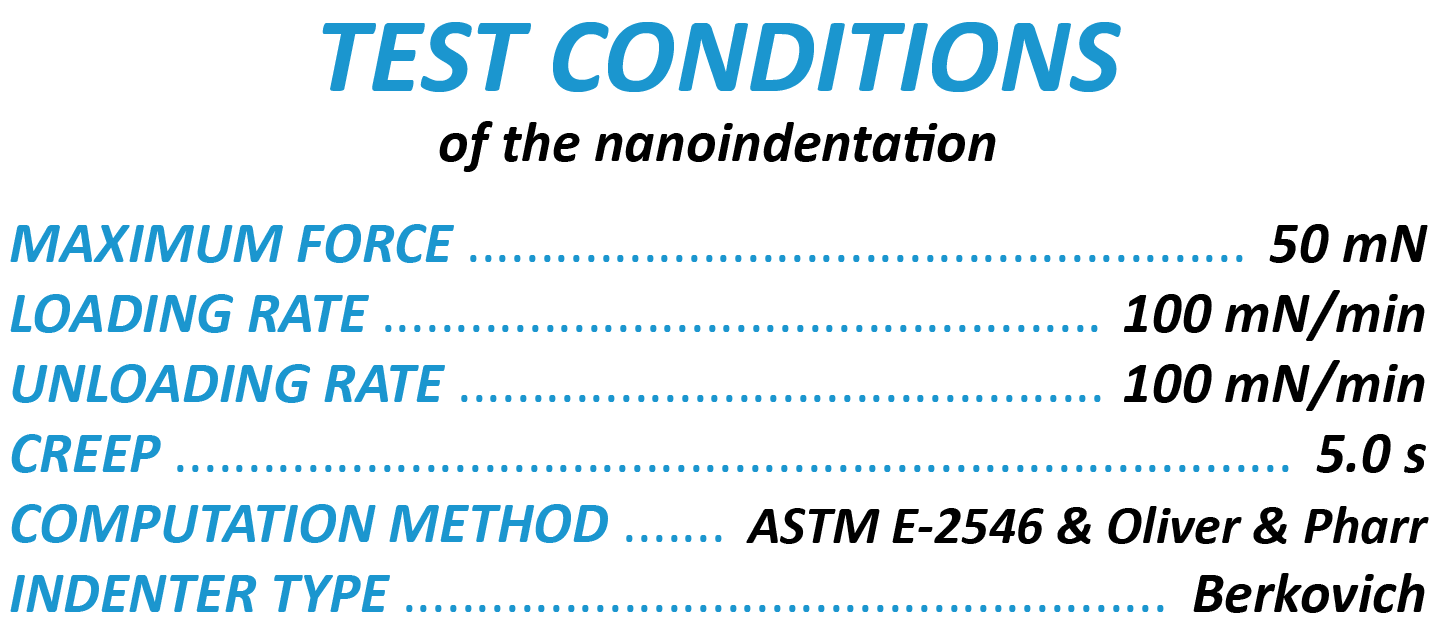
The Nanovea Mechanical Tester was used to perform a series of nanoindentations with the FastMap Mode on a floor tile using a Berkovich indenter. The test parameters are summarized below for the two indent matrices created.
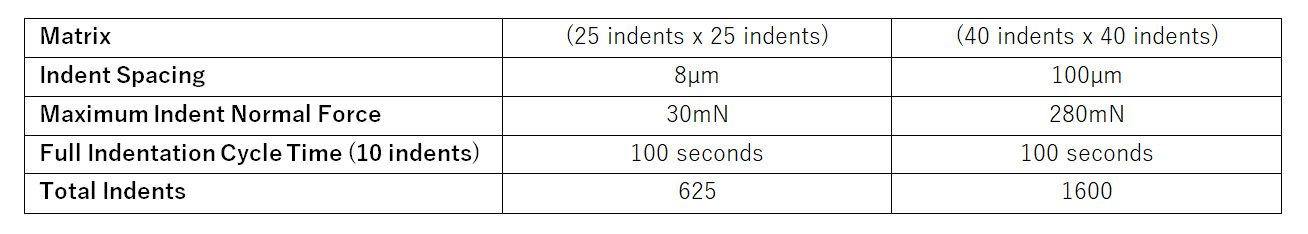
Table 1: Test parameter summary.
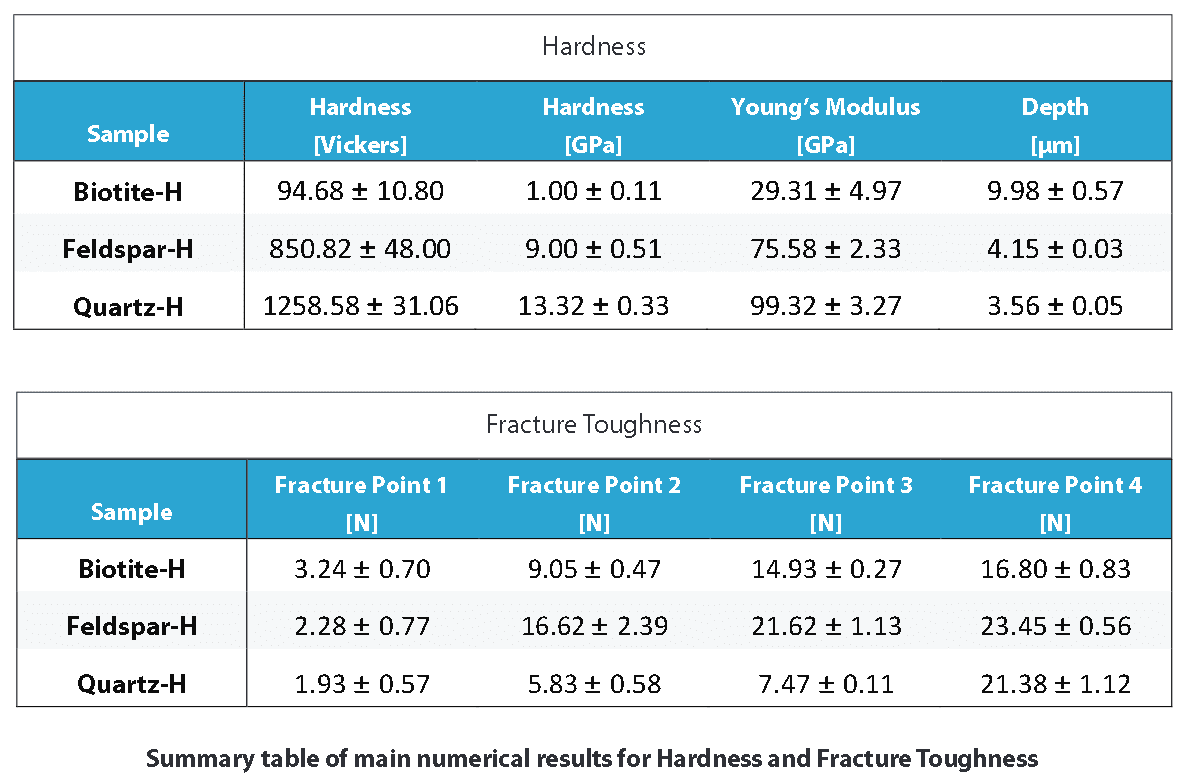
RESULTS & DISCUSSION
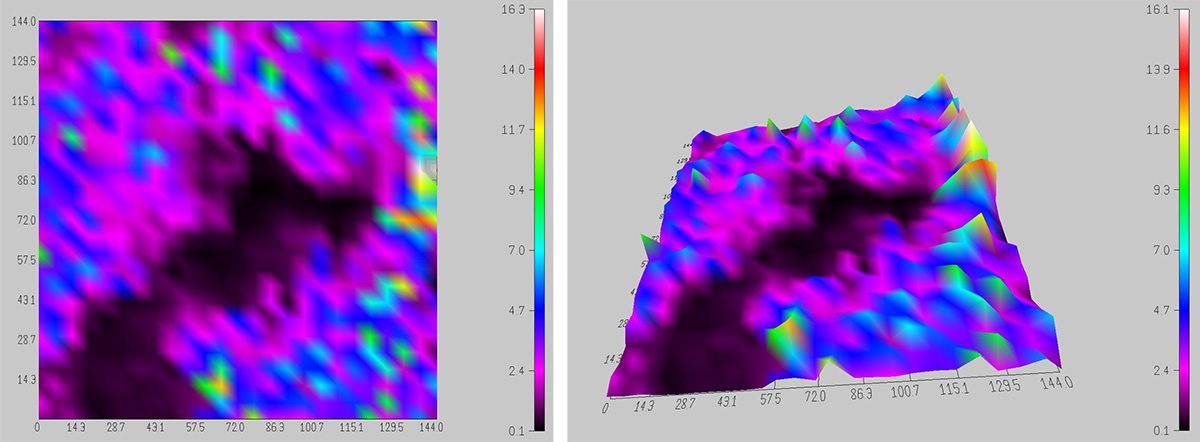
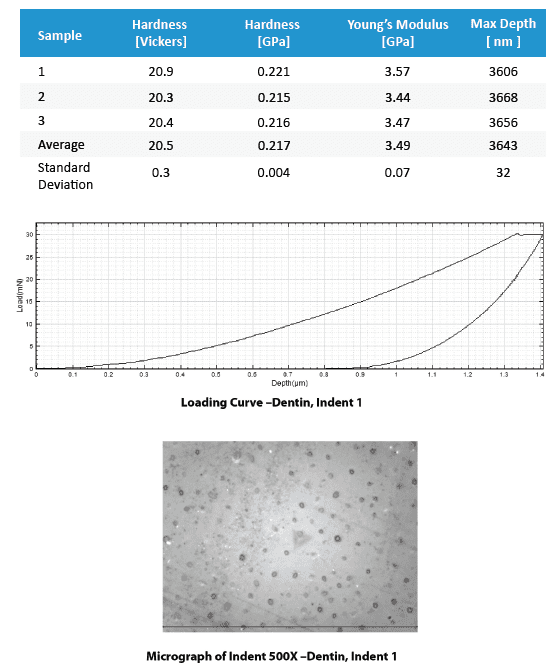
Figure 1: 2D and 3D view of 625-indent hardness mapping.
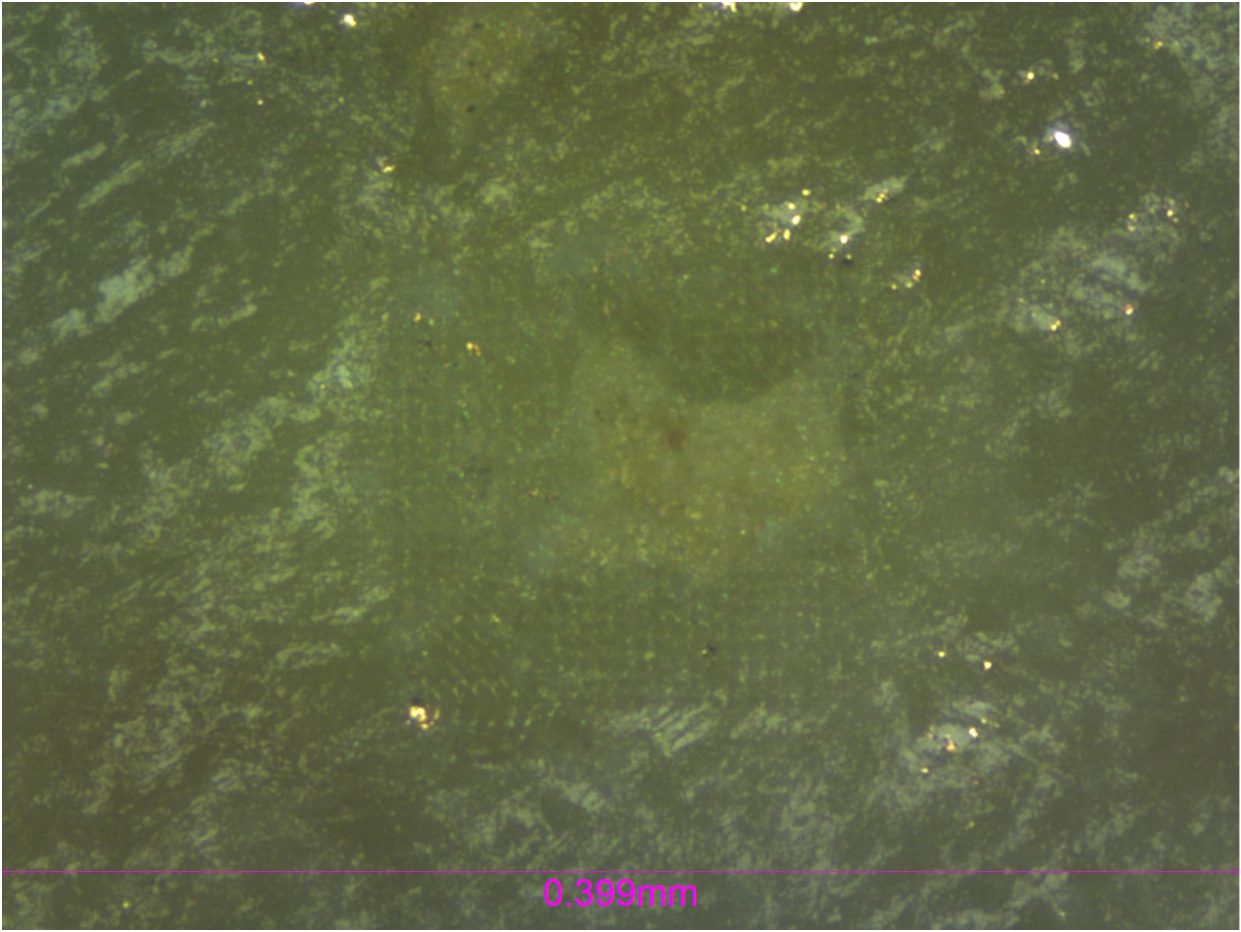
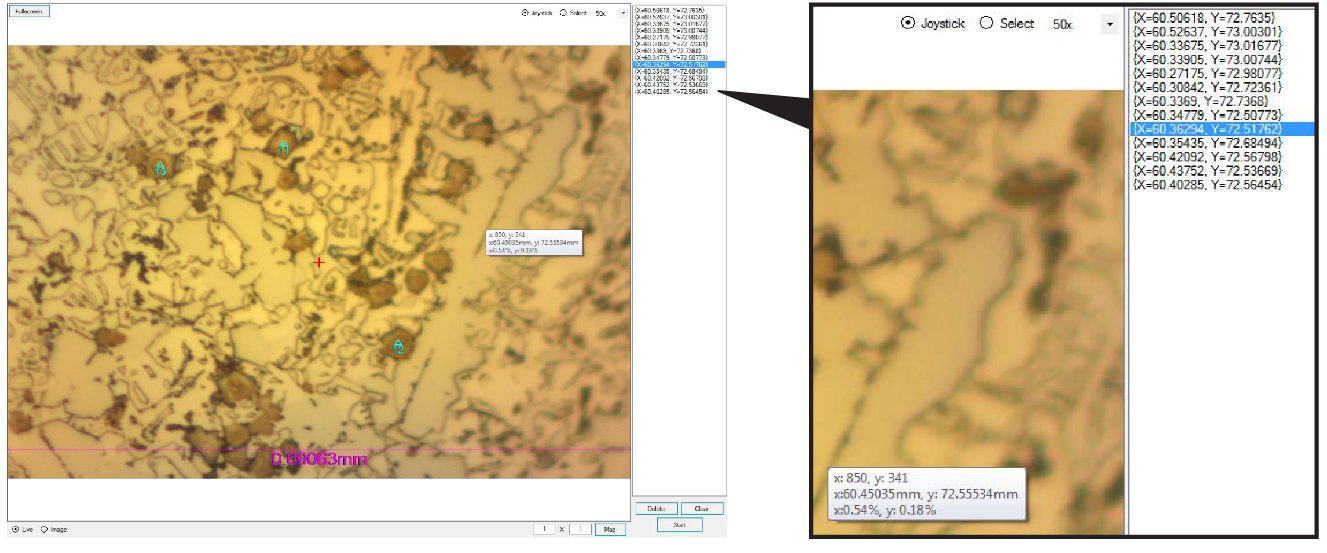
Figure 2: Micrograph of 625-indent matrix showcasing grain.
A 625-indent matrix was conducted on a 0.20mm2 area with a large visible grain present. This grain (Figure 2) had an average hardness lower than the overall surface of the tile. The Nanovea Mechanical Software allows the user to see the hardness distribution map in 2D and 3D mode which are depicted in Figure 1. Using the high-precision position control of the sample stage, the software allows users to target areas such as these for in depth mechanical properties mapping.
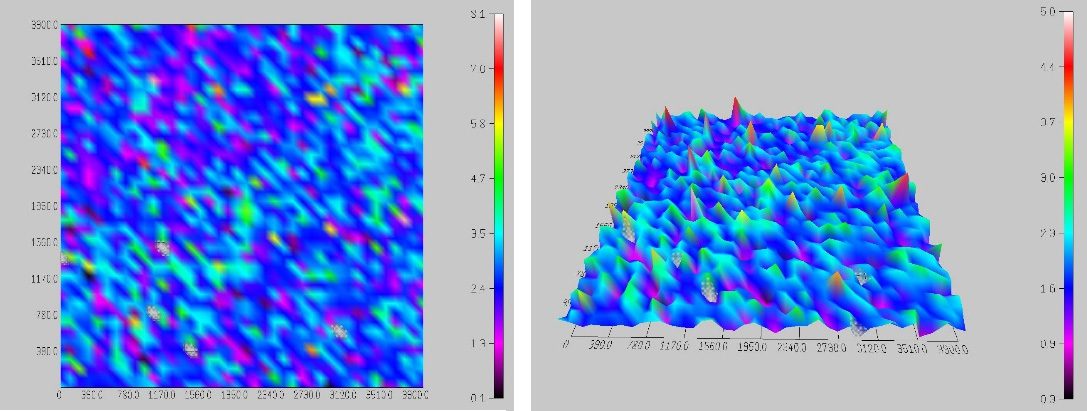
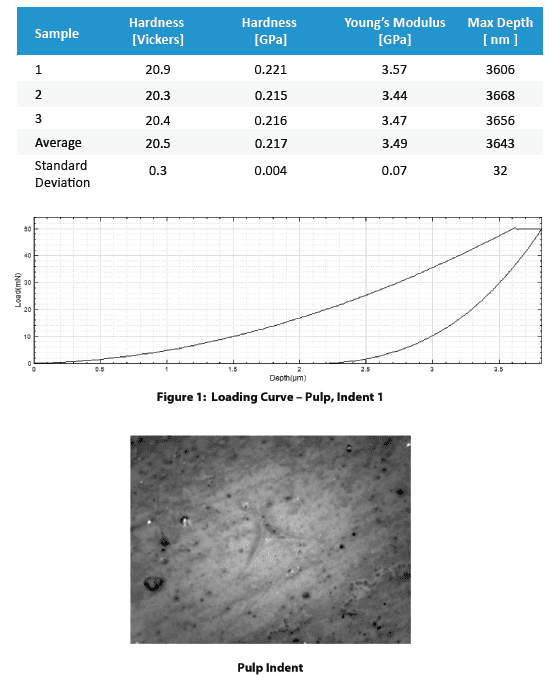
Figure 3: 2D and 3D view of 1600-indent hardness mapping.
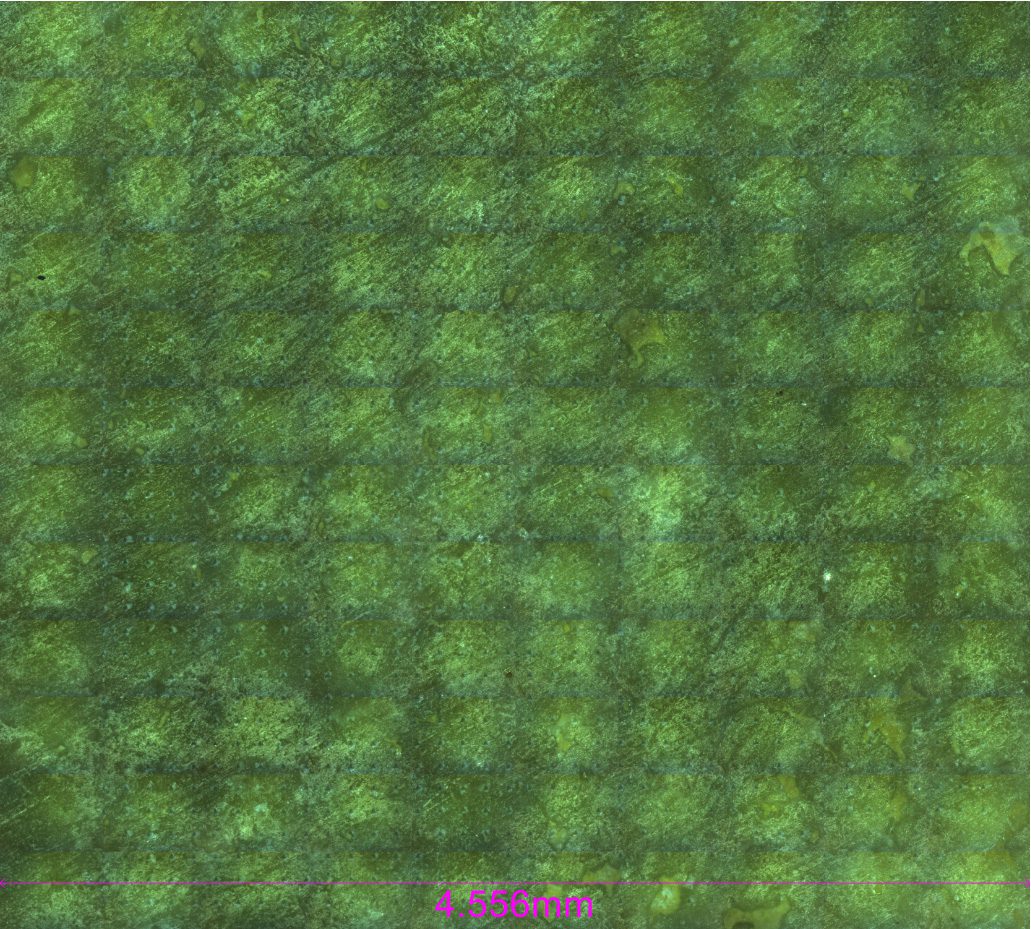
Figure 4: Micrograph of 1600-indent matrix.
A 1600-indent matrix was also created on the same tile to measure the homogeneity of the surface. Here again the user has the ability to see the hardness distribution in 3D or 2D mode (Figure 3) as well as the microscope image of the indented surface. Based on the hardness distribution presented, it can be concluded that the material is porous due to the even scattering of high and low hardness data points.
Compared to conventional nanoindentation procedures, FastMap mode in this study is substantially less time-consuming and more cost-effective. It enables speedy quantitative mapping of mechanical properties including Hardness and Young’s Modulus and provides a solution for grain detection and material consistency which is critical for quality control of a variety of materials in mass production.

CONCLUSION
In this study, we showcased the capacity of the Nanovea Mechanical Tester in performing speedy and precise nanoindentation mapping using FastMap mode. The mechanical property maps on the ceramic tile utilize the position control (with 0.2µm accuracy) of the stages and force module sensitivity to detect surface grains and measure homogeneity of a surface at high speed.
The test parameters used in this study were determined based on the size of the matrix and sample material. A variety of test parameters can be chosen to optimize the total indentation cycle time to 3 seconds per indent (or 30 seconds for every 10 indentations).
The Nano and Micro modules of the Nanovea Mechanical Tester all include ISO and ASTM compliant indentation, scratch and wear tester modes, providing the widest and most user-friendly range of testing available in a single system. Nanovea’s unmatched range is an ideal solution for determining the full range of mechanical properties of thin or thick, soft or hard coatings, films and substrates, including hardness, Young’s Modulus, fracture toughness, adhesion, wear resistance and many others.
In addition, optional 3D non-contact profiler and AFM Module are available for high resolution 3D imaging of indentation, scratch and wear track in addition to other surface measurements such as roughness.
Author: Duanjie Li, PhD Revised by Pierre Leroux & Jocelyn Esparza

Improve Mining Procedures With Microindendation

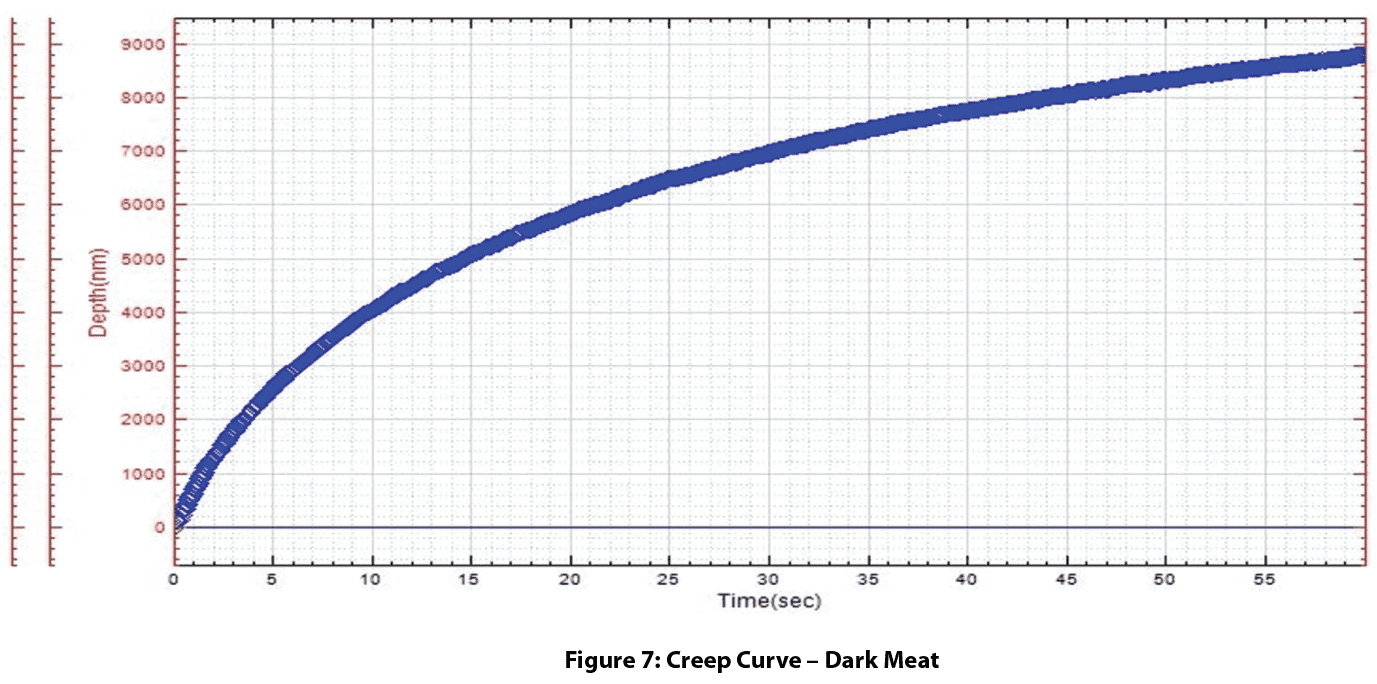
Biological Tissue Hardness Evaluation using Nanoindentation

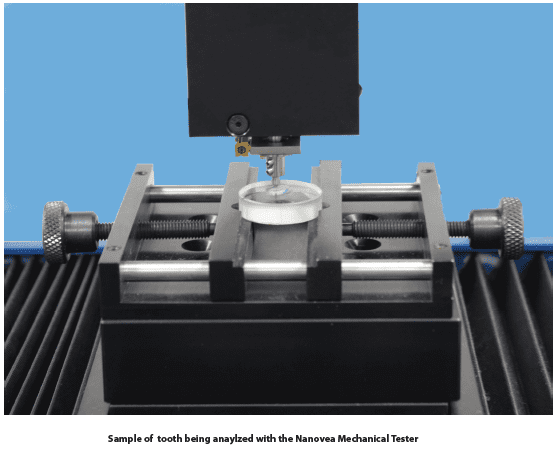
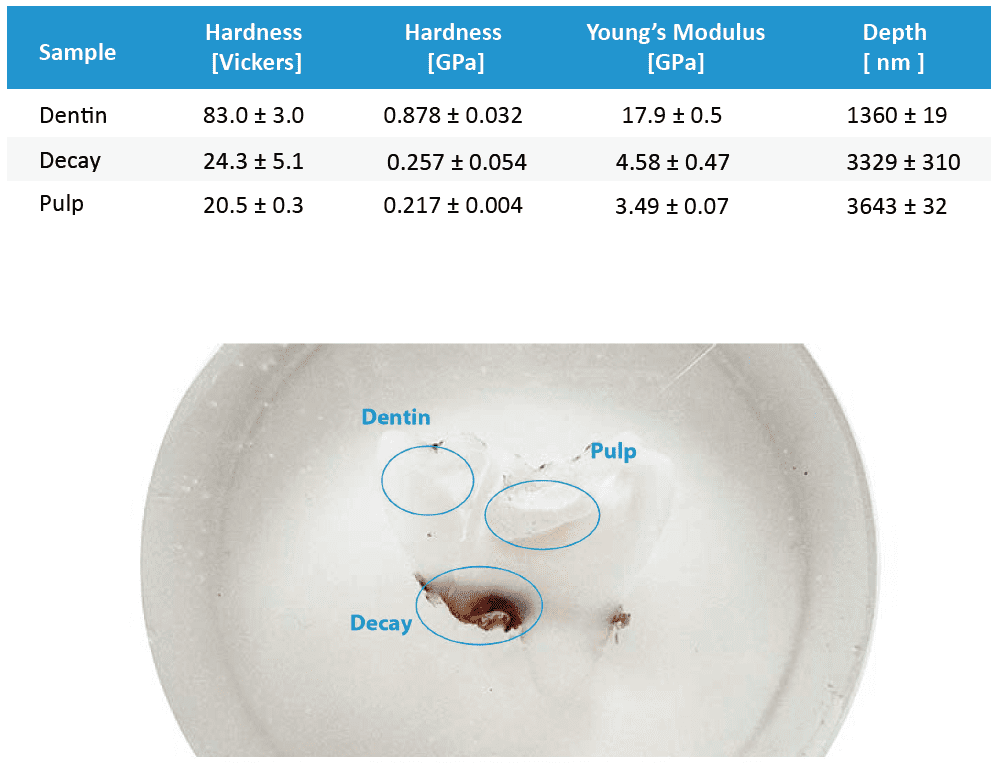
Tooth Hardness Evaluation using Nanoindentation