USA/GLOBAL: +1-949-461-9292
EUROPE: +39-011-3052-794
CONTACT US

Dynamic Mechanical Analysis of Cork Using Nanoindentation

DYNAMIC MECHANICAL ANALYSIS

OF CORK USING NANOINDENTATION

Prepared by

FRANK LIU

INTRODUCTION

Dynamic Mechanical Analysis (DMA) is a powerful technique used to investigate the mechanical properties of materials. In this application, we focus on the analysis of cork, a widely used material in wine sealing and aging processes. Cork, obtained from the bark of the Quercus suber oak tree, exhibits distinct cellular structures that provide mechanical properties resembling synthetic polymers. In one axis, the cork has honeycomb structure. The two other axes are structured in multiple rectangular-like prisms. This gives cork different mechanical properties depending on the orientation being tested.

IMPORTANCE OF DYNAMIC MECHANICAL ANALYSIS (DMA) TESTING IN ASSESSING CORK MECHANICAL PROPERTIES

The quality of corks greatly relies on their mechanical and physical properties, which are crucial for their effectiveness in wine sealing. Key factors determining cork quality include flexibility, insulation, resilience, and impermeability to gas and liquids. By utilizing dynamic mechanical analysis (DMA) testing, we can quantitatively assess the flexibility and resilience properties of corks, providing a reliable method for evaluation.

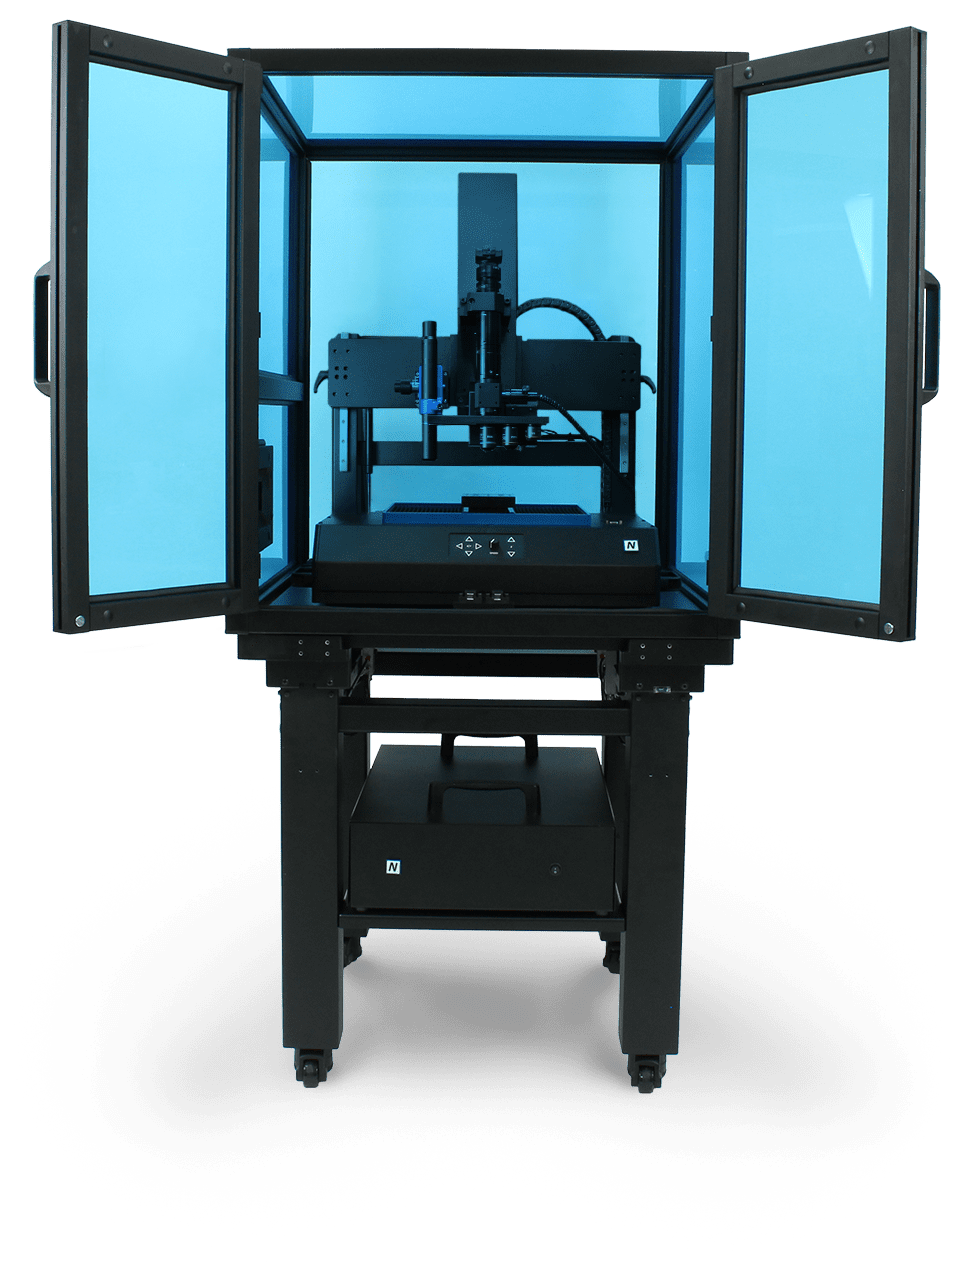
The NANOVEA PB1000 Mechanical Tester in the Nanoindentation mode enables the characterization of these properties, specifically Young’s modulus, storage modulus, loss modulus, and tan delta (tan (δ)). DMA testing also allows for the collection of valuable data on phase shift, hardness, stress, and strain of the cork material. Through these comprehensive analyses, we gain deeper insights into the mechanical behavior of corks and their suitability for wine sealing applications.

MEASUREMENT OBJECTIVE

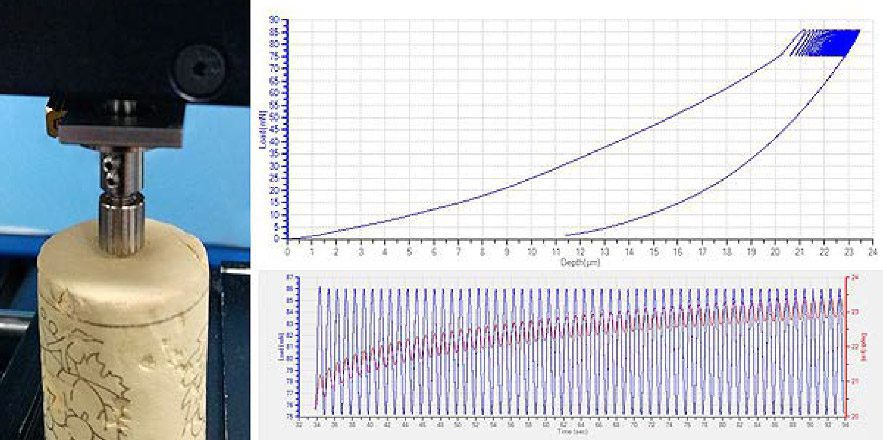
In this study, perform dynamic mechanical analysis (DMA) on four cork stoppers using the NANOVEA PB1000 Mechanical Tester in the Nanoindentation mode. The quality of the cork stoppers is labeled as: 1 – Flor, 2 – First, 3 – Colmated, 4 – Synthetic rubber. DMA indentation tests were conducted in both the axial and radial directions for each cork stopper. By analyzing the mechanical response of the cork stoppers, we aimed to gain insights into their dynamic behavior and evaluate their performance under different orientations.

NANOVEA

PB1000

TEST PARAMETERS

MAX FORCE75 mN
LOADING RATE150 mN/min
UNLOADING RATE150 mN/min
AMPLITUDE5 mN
FREQUENCY1 Hz
CREEP60 s

indenter type

Ball

51200 Steel

3 mm Diameter

RESULTS

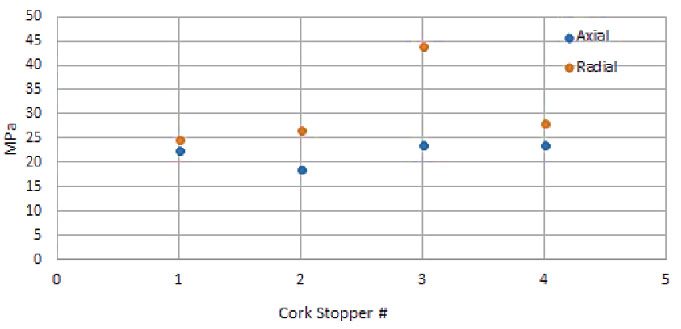
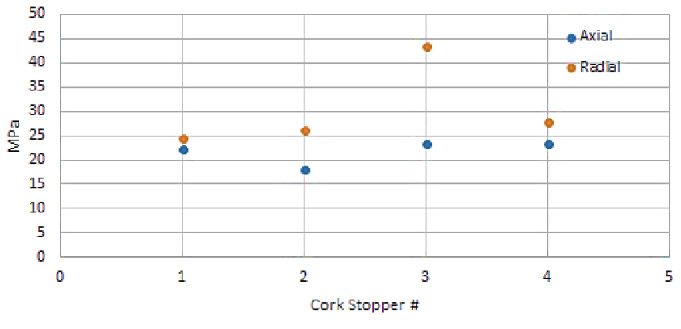
In the tables and graphs below, the Young’s modulus, storage modulus, loss modulus, and tan delta are compared between each sample and orientation.

Young’s modulus: Stiffness; high values indicate stiff, low values indicate flexible.

Storage modulus: Elastic response; energy stored in the material.

Loss modulus: Viscous response; energy lost due to heat.

Tan (δ): Dampening; high values indicate more dampening.

AXIAL ORIENTATION

StopperYOUNG’S MODULUSSTORAGE MODULUSLOSS MODULUSTAN
#(MPa)(MPa)(MPa)(δ)
122.567522.272093.6249470.162964
218.5466418.271533.1623490.17409
323.7538123.472673.6178190.154592
423.697223.580642.3470080.099539


RADIAL ORIENTATION

StopperYOUNG’S MODULUSSTORAGE MODULUSLOSS MODULUSTAN
#(MPa)(MPa)(MPa)(δ)
124.7886324.565423.3082240.134865
226.6661426.317394.2862160.163006
344.0786743.614266.3659790.146033
428.0475127.941482.4359780.087173

YOUNG’S MODULUS

STORAGE MODULUS

LOSS MODULUS

TAN DELTA

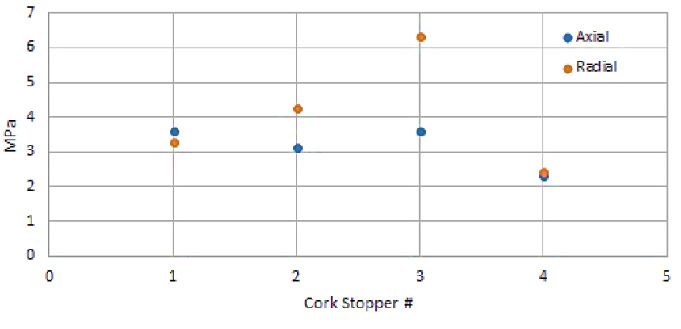
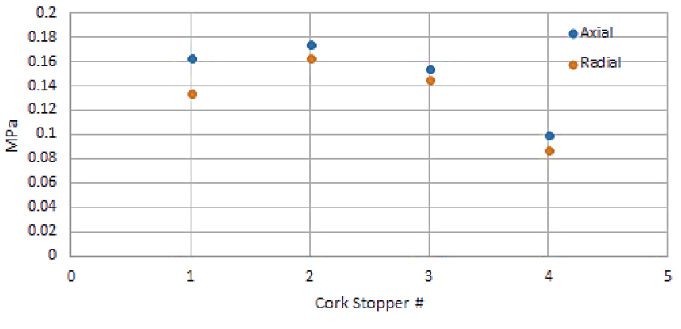
Between cork stoppers, the Young’s modulus is not very different when tested in the axial orientation. Only Stopper #2 and #3 showed an apparent difference in the Young’s modulus between the radial and axial direction. As a result, the storage modulus and loss modulus will also be higher in the radial direction than in the axial direction. Stopper #4 shows similar characteristics with the natural cork stoppers, except in the loss modulus. This is quite interesting since it means the natural corks has a more viscous property than the synthetic rubber material.

CONCLUSION

The NANOVEA Mechanical Tester in the Nano Scratch Tester mode allows simulation of many real-life failures of paint coatings and hard coats. By applying increasing loads in a controlled and closely monitored manner, the instrument allows to identify at what load failures occur. This can then be used as a way to determine quantitative values for scratch resistance. The coating tested, with no weathering, is known to have a first crack at about 22 mN. With values closer to 5 mN, it is clear that the 7 year lap has degraded the paint.

Compensating for the original profile allows to obtain corrected depth during the scratch and also to measure the residual depth after the scratch. This gives extra information on the plastic versus elastic behavior of the coating under increasing load. Both cracking and the information on deformation can be of great use for improving the hard coat. The very small standard deviations also show the reproducibility of the technique of the instrument which can help manufacturers improved the quality of their hard coat/paint and study weathering effects.

NOW, LET'S TALK ABOUT YOUR APPLICATION

Comment