USA/GLOBAL: +1-949-461-9292
EUROPE: +39-011-3052-794
CONTACT US

Category: Liquid Tribology


Sandpaper Abrasion Performance Using a Tribometer

SANDPAPER ABRASION PERFORMANCE

USING A TRIBOMETER

Prepared by

DUANJIE LI, PhD

INTRODUCTION

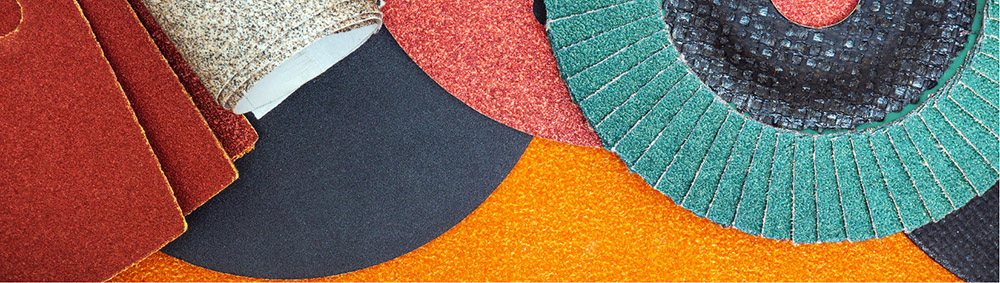
Sandpaper consists of abrasive particles glued to one face of a paper or cloth. Various abrasive materials can be used for the particles, such as garnet, silicon carbide, aluminum oxide and diamond. Sandpaper is widely applied in a variety of industrial sectors to create specific surface finishes on wood, metal and drywall. They often work under high pressure contact applied by hand or power tools.

IMPORTANCE OF EVALUATING SANDPAPER ABRASION PERFORMANCE

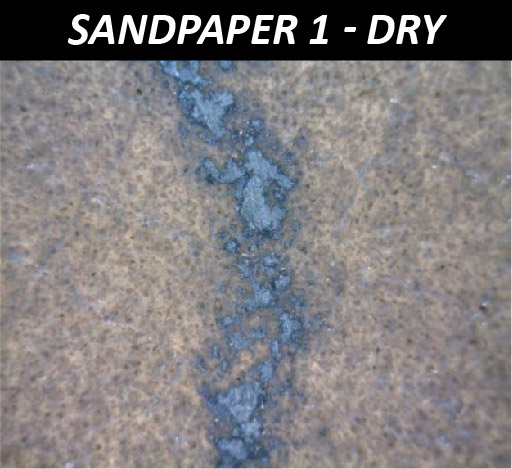
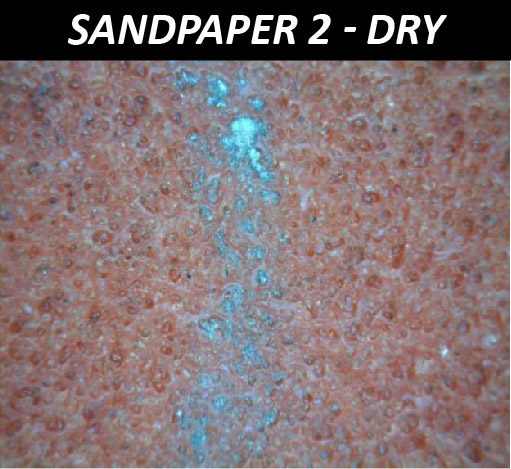
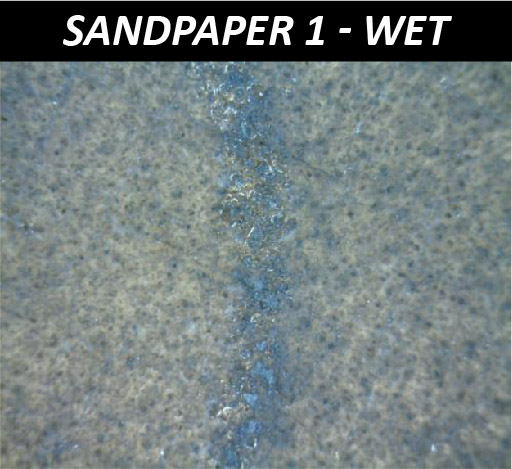
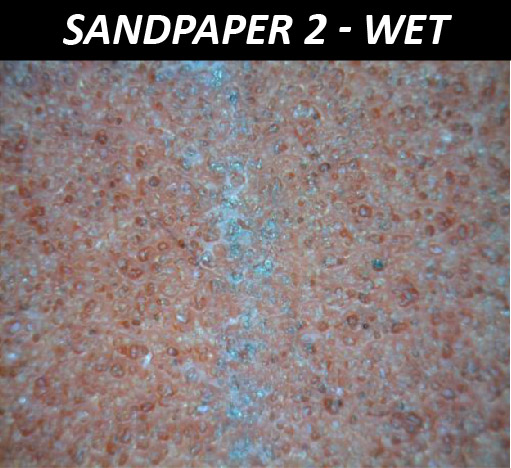
The effectiveness of sandpaper is often determined by its abrasion performance under different conditions. The grit size, i.e. the size of the abrasive particles embedded in the sandpaper, determines the wear rate and the scratch size of the material being sanded. Sandpapers of higher grit numbers have smaller particles, resulting in lower sanding speeds and finer surface finishes. Sandpapers with the same grit number but made of different materials can have unalike behaviors under dry or wet conditions. Reliable tribological evaluations are needed to ensure that manufactured sandpaper possesses the desired abrasive behavior intended. These evaluations allow users to quantitatively compare the wear behaviors of different types of sandpapers in a controlled and monitored manner in order to select the best candidate for the target application.

MEASUREMENT OBJECTIVE

In this study, we showcase the NANOVEA Tribometer’s ability to quantitatively evaluate the abrasion performance of various sandpaper samples under dry and wet conditions.

NANOVEA

T2000

TEST PROCEDURES

The coefficient of friction (COF) and the abrasion performance of two types of sandpapers were evaluated by the NANOVEA T100 Tribometer. A 440 stainless steel ball was used as the counter material. The ball wear scars were examined after each wear test using the NANOVEA 3D Non-Contact Optical Profiler to ensure precise volume loss measurements.

Please note that a 440 stainless steel ball was chosen as the counter material to create a comparative study but any solid material could be substituted to simulate a different application condition.

TEST RESULTS & DISCUSSION

FIGURE 1 shows a COF comparison of Sandpaper 1 and 2 under dry and wet environmental conditions. Sandpaper 1, under dry conditions, shows a COF of 0.4 at the beginning of the test which progressively decreases and stabilizes to 0.3. Under wet conditions, this sample exhibits a lower average COF of 0.27. In contrast, Sample 2’s COF results show a dry COF of 0.27 and wet COF of ~ 0.37. 

Please note the oscillation in the data for all COF plots was caused by the vibrations generated by the sliding movement of the ball against the rough sandpaper surfaces.

FIGURE 1: Evolution of COF during the wear tests.

FIGURE 2 summarizes the results of the wear scar analysis. The wear scars were measured using an optical microscope and a NANOVEA 3D Non-Contact Optical Profiler. FIGURE 3 and FIGURE 4 compare the wear scars of the worn SS440 balls post wear tests on Sandpaper 1 and 2 (wet and dry conditions). As shown in FIGURE 4 the NANOVEA Optical Profiler precisely captures the surface topography of the four balls and their respective wear tracks which were then processed with the NANOVEA Mountains Advanced Analysis software to calculate volume loss and wear rate. On the microscope and profile image of the ball it can be observed that the ball used for Sandpaper 1 (dry) testing exhibited a larger flattened wear scar compared to the others with a volume loss of 0.313 mm3. In contrast, the volume loss for Sandpaper 1 (wet) was 0.131 mm3. For Sandpaper 2 (dry) the volume loss was 0.163 mm3 and for Sandpaper 2 (wet) the volume loss increased to 0.237 mm3.

Moreover, it is interesting to observe that the COF played an important role in the abrasion performance of the sandpapers. Sandpaper 1 exhibited higher COF in the dry condition, leading to a higher abrasion rate for the SS440 ball used in the test. In comparison, the higher COF of Sandpaper 2 in the wet condition resulted in a higher abrasion rate. The wear tracks of the sandpapers after the measurements are displayed in FIGURE 5.

Both Sandpapers 1 and 2 claim to work in either dry and wet environments. However, they exhibited significantly different abrasion performance in the dry and wet conditions. NANOVEA tribometers provide well-controlled quantifiable and reliable wear assessment capabilities that ensure reproducible wear evaluations. Moreover, the capacity of in situ COF measurement allows users to correlate different stages of a wear process with the evolution of COF, which is critical in improving fundamental understanding of the wear mechanism and tribological characteristics of sandpaper

FIGURE 2: Wear scar volume of the balls and average COF under different conditions.

FIGURE 3: Wear scars of the balls after the tests.

FIGURE 4: 3D morphology of the wear scars on the balls.

FIGURE 5: Wear tracks on the sandpapers under different conditions.

CONCLUSION

The abrasion performance of two types of sandpapers of the same grit number were evaluated under dry and wet conditions in this study. The service conditions of the sandpaper play a critical role in the effectiveness of the work performance. Sandpaper 1 possessed significantly better abrasion behavior under dry conditions, while Sandpaper 2 performed better under wet conditions. The friction during the sanding process is an important factor to consider when evaluating abrasion performance. The NANOVEA Optical Profiler precisely measures the 3D morphology of any surface, such as wear scars on a ball, ensuring reliable evaluation on the abrasion performance of the sandpaper in this study. The NANOVEA Tribometer measures the coefficient of friction in situ during a wear test, providing an insight on the different stages of a wear process. It also offers repeatable wear and friction testing using ISO and ASTM compliant rotative and linear modes, with optional high temperature wear and lubrication modules available in one pre-integrated system. This unmatched range allows users to simulate different severe work environment of the ball bearings including high stress, wear and high temperature, etc. It also provides an ideal tool to quantitatively assess the tribological behaviors of superior wear resistant materials under high loads.

NOW, LET'S TALK ABOUT YOUR APPLICATION

Piston Wear Testing

Piston Wear Testing

Using a Tribometer

Prepared by

FRANK LIU

INTRODUCTION

Friction loss accounts for approximately 10% of total energy in fuel for a diesel engine[1]. 40-55% of the friction loss comes from the power cylinder system. The loss of energy from friction can be diminished with better understanding of the tribological interactions occurring in the power cylinder system.

A significant portion of the friction loss in the power cylinder system stems from the contact between the piston skirt and the cylinder liner. The interaction between the piston skirt, lubricant, and cylinder interfaces is quite complex due to the constant changes in force, temperature, and speed in a real life engine. Optimizing each factor is key to obtaining optimal engine performance. This study will focus on replicating the mechanisms causing friction forces and wear at the piston skirt-lubricant-cylinder liner (P-L-C) interfaces.

 Schematic of power cylinders system and piston skirt-lubricant-cylinder liner interfaces.

[1] Bai, Dongfang. Modeling piston skirt lubrication in internal combustion engines. Diss. MIT, 2012

IMPORTANCE OF TESTING PISTONS WITH TRIBOMETERS

Motor oil is a lubricant that is well-designed for its application. In addition to the base oil, additives such as detergents, dispersants, viscosity improver (VI), anti-wear/anti-friction agents, and corrosion inhibitors are added to improve its performance. These additives affect how the oil behaves under different operating conditions. The behavior of oil affects the P-L-C interfaces and determines if significant wear from metal-metal contact or if hydrodynamic lubrication (very little wear) is occurring.

It is difficult to understand the P-L-C interfaces without isolating the area from external variables. It is more practical to simulate the event with conditions that are representative of its real-life application. The NANOVEA Tribometer is ideal for this. Equipped with multiple force sensors, depth sensor, a drop-by-drop lubricant module, and linear reciprocating stage, the NANOVEA T2000 is able to closely mimic events occurring within an engine block and obtain valuable data to better understand the P-L-C interfaces.

Liquid Module on the NANOVEA T2000 Tribometer

The drop-by-drop module is crucial for this study. Since pistons can move at a very fast rate (above 3000 rpm), it is difficult to create a thin film of lubricant by submerging the sample. To remedy this issue, the drop-by-drop module is able to consistently apply a constant amount of lubricant onto the piston skirt surface.

Application of fresh lubricant also removes concern of dislodged wear contaminants influencing the lubricant’s properties.

NANOVEA T2000

High Load Tribometer

MEASUREMENT OBJECTIVE

The piston skirt-lubricant-cylinder liner interfaces will be studied in this report. The interfaces will be replicated by conducting a linear reciprocating wear test with drop-by-drop lubricant module.

The lubricant will be applied at room temperature and heated conditions to compare cold start and optimal operation conditions. The COF and wear rate will be observed to better understand how the interfaces behaves in real-life applications.

TEST PARAMETERS

for tribology testing on pistons

LOAD ………………………. 100 N

TEST DURATION ………………………. 30 min

SPEED ………………………. 2000 rpm

AMPLITUDE ………………………. 10 mm

TOTAL DISTANCE ………………………. 1200 m

SKIRT COATING ………………………. Moly-graphite

PIN MATERIAL ………………………. Aluminum Alloy 5052

PIN DIAMETER ………………………. 10 mm

LUBRICANT ………………………. Motor Oil (10W-30)

APPROX. FLOW RATE ………………………. 60 mL/min

TEMPERATURE ………………………. Room temp & 90°C

LINEAR RECIPROCATING TEST RESULTS

In this experiment, A5052 was used as the counter material. While engine blocks are usually made of cast aluminum such as A356, A5052 have mechanical properties similar to A356 for this simulative testing [2].

Under the testing conditions, significant wear was
observed on the piston skirt at room temperature
compared to at 90°C. The deep scratches seen on the samples suggest that contact between the static material and the piston skirt occurs frequently throughout the test. The high viscosity at room temperature may be restricting the oil from completely filling gaps at the interfaces and creating metal-metal contact. At higher temperature, the oil thins and is able to flow between the pin and the piston. As a result, significantly less wear is observed at higher temperature. FIGURE 5 shows one side of the wear scar wore significantly less than the other side. This is most likely due to the location of the oil output. The lubricant film thickness was thicker on one side than the other, causing uneven wearing.


[2] “5052 Aluminum vs 356.0 Aluminum.” MakeItFrom.com, makeitfrom.com/compare/5052-O-Aluminum/A356.0-SG70B-A13560-Cast-Aluminum

The COF of linear reciprocating tribology tests can be split into a high and low pass. High pass refers to the sample moving in the forward, or positive, direction and low pass refers to the sample moving in the reverse, or negative, direction. The average COF for the RT oil was observed to be under 0.1 for both directions. The average COF between passes were 0.072 and 0.080. The average COF of the 90°C oil was found to be different between passes. Average COF values of 0.167 and 0.09 were observed. The difference in COF gives additional proof that the oil was only able to properly wet one side of the pin. High COF was obtained when a thick film was formed between the pin and the piston skirt due to hydrodynamic lubrication occurring. Lower COF is observed in the other direction when mixed lubrication is occurring. For more information on hydrodynamic lubrication and mixed lubrication, please visit our application note on Stribeck Curves.

Table 1: Results from lubricated wear test on pistons.

FIGURE 1: COF graphs for room temperature oil wear test A raw profile B high pass C low pass.

FIGURE 2: COF graphs for 90°C wear oil test A raw profile B high pass C low pass.

FIGURE 3: Optical image of wear scar from RT motor oil wear test.

FIGURE 4: Volume of a hole analysis of wear scar from RT motor oil wear test.

FIGURE 5: Profilometry scan of wear scar from RT motor oil wear test.

FIGURE 6: Optical image of wear scar from 90°C motor oil wear test

FIGURE 7: Volume of a hole analysis of wear scar from 90°C motor oil wear test.

FIGURE 8: Profilometry scan of wear scar from 90°C motor oil wear test.

CONCLUSION

Lubricated linear reciprocating wear testing was conducted on a piston to simulate events occurring in a
real-life operational engine. The piston skirt-lubricant-cylinder liner interfaces is crucial to the operations of an engine. The lubricant thickness at the interface is responsible for energy loss due to friction or wear between the piston skirt and cylinder liner. To optimize the engine, the film thickness must be as thin as possible without allowing the piston skirt and cylinder liner to touch. The challenge, however, is how changes in temperature, speed, and force will affect the P-L-C interfaces.

With its wide range of loading (up to 2000 N) and speed (up to 15000 rpm), the NANOVEA T2000 tribometer is able to simulate different conditions possible in an engine. Possible future studies on this topic include how the P-L-C interfaces will behave under different constant load, oscillated load, lubricant temperature, speed, and lubricant application method. These parameters can be easily adjusted with the NANOVEA T2000 tribometer to give a complete understanding on the mechanisms of the piston skirt-lubricant-cylinder liner interfaces.

NOW, LET'S TALK ABOUT YOUR APPLICATION

Continuous Stribeck Curve Measurement using Pin-on-Disk Tribometer

Introduction:

When lubrication is applied to reduce the wear/friction of moving surfaces, the lubrication contact at the interface can shift from several regimes such as Boundary, Mixed and Hydrodynamic Lubrication. The thickness of the fluid film plays a major role in this process, mainly determined by the fluid viscosity, the load applied at the interface and the relative speed between the two surfaces. How the lubrication regimes react to friction is shown in what is called a Stribeck [1-4] curve.

In this study we demonstrate for the first time the ability to measure a continuous Stribeck Curve. Using the Nanovea Tribometer advanced step-less speed control, from 15000 to 0.01 rpm, within 10 minutes the software directly provides a complete Stribeck Curve. The simple initial setup only requires users to select the Exponential Ramp Mode and enter initial and final speeds, rather than having to perform multiple tests or program a stepwise procedure at different speeds requiring data stitching for the conventional Stribeck curve measurements. This advancement provides precise data throughout lubricant regime evaluation and substantially reduces time and cost. The test shows a great potential to be used in different industrial engineering applications.


Click to read more!

Lubricating Eye Drop Comparison using the Nanovea T50 Tribometer

Importance of Testing Eye Drop Solutions

Eye drop solutions are used to alleviate symptoms caused by a range of eye problems. For example, they can be used to treat minor eye irritation (e.g. dryness and redness), delay the onset of glaucoma or treat infections. Eye drop solutions sold over-the-counter are mainly used to treat dryness. Their effectiveness in lubricating the eye can be compared and measured with a coefficient of friction test.
 
Dry eyes can be caused by a wide range of factors, for example, computer eye strain or being outdoors in extreme weather conditions. Good lubricating eye drops help maintain and supplement the moisture on the outer surface of the eyes. This works to alleviate the discomfort, burning or irritation and redness associated with dry eyes. By measuring the coefficient of friction (COF) of an eye drop solution, its lubricating efficiency and how it compares to other solutions can be determined.

Measurement Objective

In this study, the coefficient of friction (COF) of three different lubricating eye drop solutions was measured using the pin-on-disk setup on the Nanovea T50 Tribometer.

Test Procedure and Procedures

A 6mm diameter spherical pin made of alumina was applied to a glass slide with each eye drop solution acting as the lubricant between the two surfaces. The test parameters used for all experiments are summarized in Table 1 below.

Results and Discussion

The maximum, minimum, and average coefficient of friction values for the three different eye drop solutions tested are tabulated in Table 2 below. The COF v. Revolutions graphs for each eye drop solution are depicted in Figures 2-4. The COF during each test remained relatively constant for most of the total test duration. Sample A had the lowest average COF indicating it had the best lubrication properties.


Conclusion

In this study we showcase the capability of the Nanovea T50 Tribometer in measuring the coefficient of friction of three eye drop solutions. Based on these values, we show that Sample A had a lower coefficient of friction and therefore exhibits better lubrication in comparison to the other two samples.

Nanovea Tribometers offers precise and repeatable wear and friction testing using ISO and ASTM compliant rotative and linear modules. It also provides optional high temperature wear, lubrication, and tribo-corrosion modules available in one pre-integrated system. Such versatility allows users to better simulate the real application environment and improve fundamental understanding of the wear mechanism and tribological characteristics of various materials.

NOW, LET'S TALK ABOUT YOUR APPLICATION

Brush Bristle Stiffness Performance Using Tribometer

Brushes are among the most basic and widely used tools in the world. They can be used to remove material (toothbrush, archaeological brush, bench grinder brush), apply material (paintbrush, makeup brush, gilding brush), comb filaments, or add a pattern. As a result of the mechanical and abrasive forces on them, brushes constantly have to be replaced after moderate use. For example toothbrush heads should be replaced every three to four months because of fraying as a result of repeated usage. Making the toothbrush fiber filaments too stiff risks wearing away the actual tooth instead of soft plaque. Making the toothbrush fibers too soft makes the brush lose its form faster. Understanding the changing bend of the brush, as well as the wear and overall change in shape in the filaments under different loading conditions is necessary to design brushes that better fulfill their application.

Brush Bristle Stiffness Performance Using Tribometer