

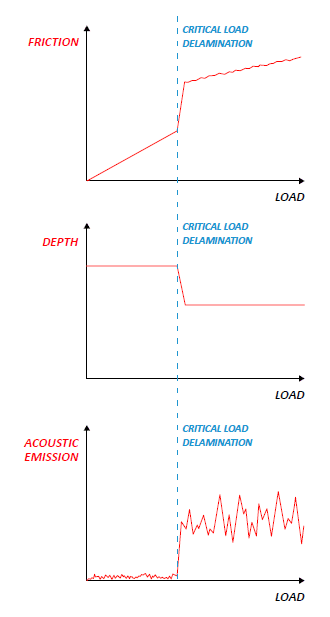
What scratch adhesion testing tells you
A coating is only as good as its bond to the substrate. Hard coatings on tools, paints on metal, electrode films, medical device coatings and optical layers all fail if they delaminate. Scratch adhesion testing provokes failure in a controlled way and records the load at which it happens. It is one of the most widely used methods for comparing coatings and checking deposition quality.
How the test works
- The sample is positioned under the stylus using the integrated microscope; positioning reaches 0.25 µm for small features.
- The stylus contacts the surface and moves along a set length while the normal load increases linearly from a start load to an end load.
- Penetration depth, friction and acoustic emission are recorded continuously. A pre-scan and post-scan at very low load can give the true and residual scratch depth.
- The whole scratch is imaged and each failure is located and converted to a critical load.
Repeat scratches under identical conditions confirm reproducibility. On the PB1000, multi-scratch automation runs the same test across many similar samples.
Reading the failure sequence
A progressive scratch typically shows a sequence of failures, each with its critical load:
- Lc1: first cohesive damage, such as cracks or slight chipping;
- Lc2: onset of adhesive failure, with the coating starting to detach;
- Lc3: full delamination, where the substrate is exposed along the track.
NANOVEA’s gold-on-quartz study shows the classic sequence: chipping at 11.15 N, repetitive adhesive failure after 16.29 N, and complete delamination at 19.09 N.
Nano to micro
Coating thickness and strength decide the load range. Polymer coatings on stent struts about 100 µm wide need nano scratch with mN loads and fine tips. NANOVEA measured first damage at about 14.5 mN and full delamination at about 78.1 mN. Nitride coatings, paints on metal and wire treatments need micro scratch at N loads. Both modules mount on the same instrument.
Why the signals matter
Optical inspection remains the reference for identifying failure, but the recorded signals make the interpretation defensible. Friction often changes as the stylus breaks through to the substrate, depth shows sudden steps at chipping, and acoustic emission picks up cracking events. In NANOVEA’s TiN study, the weaker coating’s lower critical loads were visible in all three signals as well as in the images.


