Monthly Archives: November 2019
Tribology of Polymers
Introduction
Polymers have been used extensively in a wide variety of applications and have become an indispensable part of everyday life. Natural polymers such as amber, silk, and natural rubber have played an essential role in human history. The fabrication process of synthetic polymers can be optimized to achieve unique physical properties such as toughness, viscoelasticity, self-lubrication, and many others.
Importance of Wear and Friction of Polymers
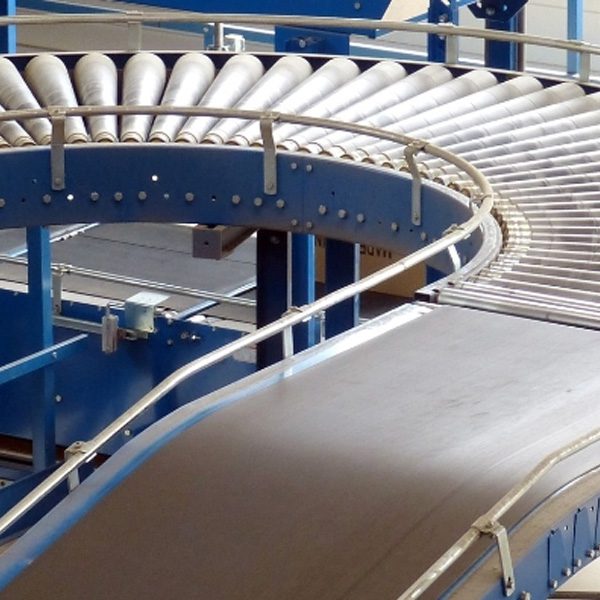
Polymers are commonly used for tribological applications, such as tires, bearings, and conveyor belts.
Different wear mechanisms occur depending on the mechanical properties of the polymer, the contact conditions, and the properties of the debris or transfer film formed during the wear process. To ensure that the polymers possess sufficient wear resistance under the service conditions, reliable and quantifiable tribological evaluation is necessary. Tribological evaluation allows us to quantitatively compare the wear behaviors of different polymers in a controlled and monitored manner to select the material candidate for the target application.
The Nanovea Tribometer offers repeatable wear and friction testing using ISO and ASTM compliant rotative and linear modes, with optional high-temperature wear and lubrication modules available in one pre-integrated system. This unmatched range allows users to simulate the different work environments of the polymers including concentrated stress, wear, and high temperature, etc.
MEASUREMENT OBJECTIVE
In this study, we showcased that the Nanovea Tribometer is an ideal tool for comparing the friction and wear resistance of different polymers in a well-controlled and quantitative manner.
TEST PROCEDURE
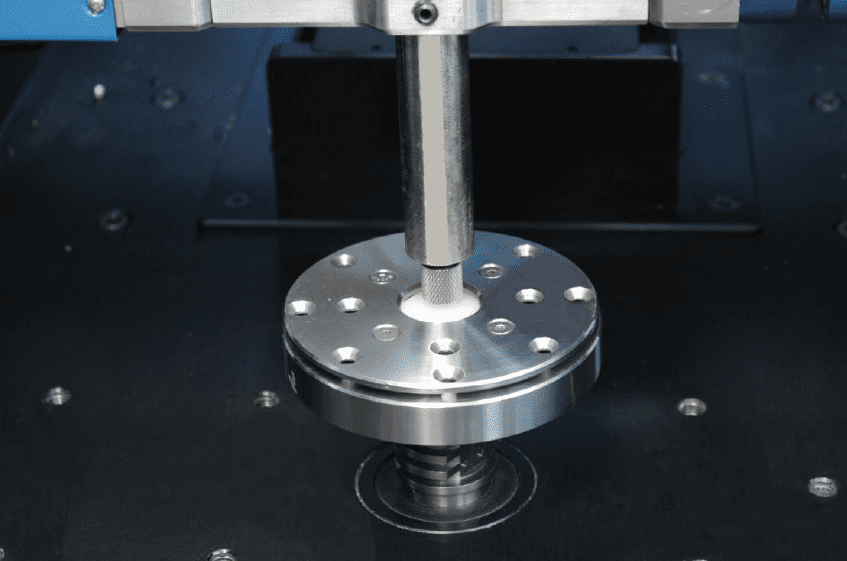
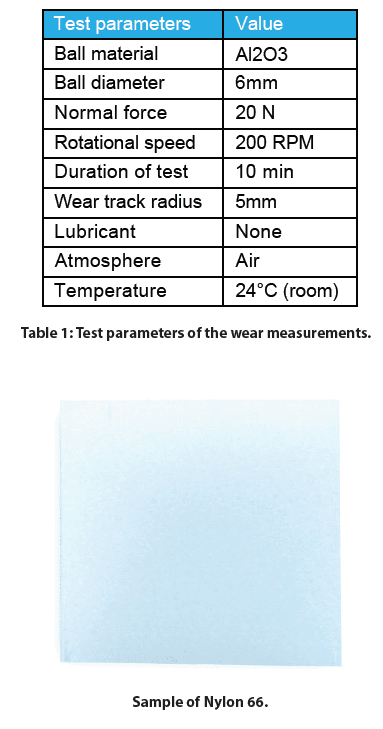
The coefficient of friction (COF) and the wear resistance of different common polymers were evaluated by the Nanovea Tribometer. An Al2O3 ball was used as the counter material (pin, static sample). The wear tracks on the polymers (dynamic rotating samples) were measured using a non-contact 3D profilometer and optical microscope after the tests concluded. It should be noted that a non-contact endoscopic sensor can be used to measure the depth the pin penetrates the dynamic sample during a wear test as an option. The test parameters are summarized in Table 1. The wear rate, K, was evaluated using the formula K=Vl(Fxs), where V is the worn volume, F is the normal load, and s is the sliding distance.
Please note that Al2O3 balls were used as the counter material in this study. Any solid material can be substituted to more closely simulate the performance of two specimens under actual application conditions.
RESULTS AND DISCUSSION
Wear rate is a vital factor for determining the service lifetime of the materials, while the friction plays a critical role during the tribological applications. Figure 2 compares the evolution of the COF for different polymers against the Al2O3 ball during the wear tests. COF works as an indicator of when failures occur and the wear process enters a new stage. Among the tested polymers, HDPE maintains the lowest constant COF of ~0.15 throughout the wear test. The smooth COF implies that a stable tribo-contact is formed.
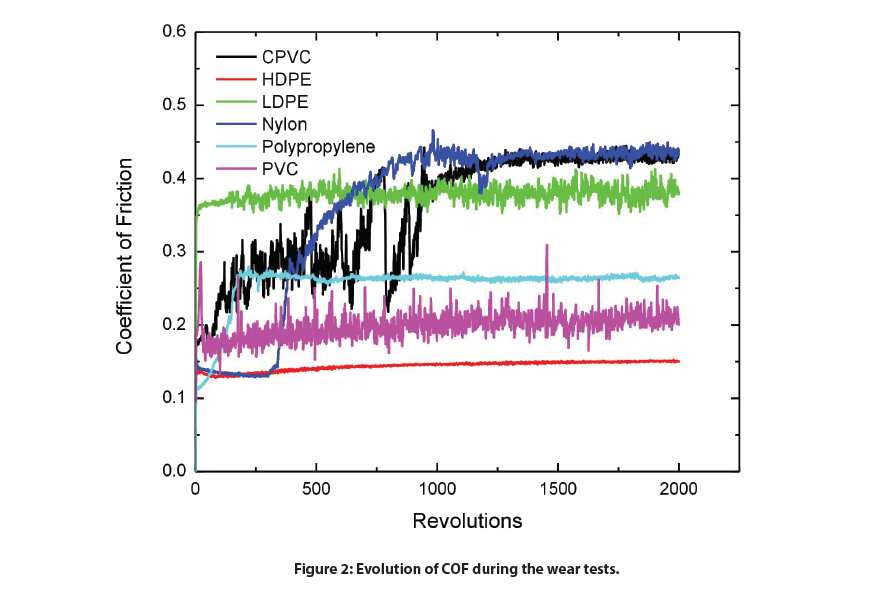
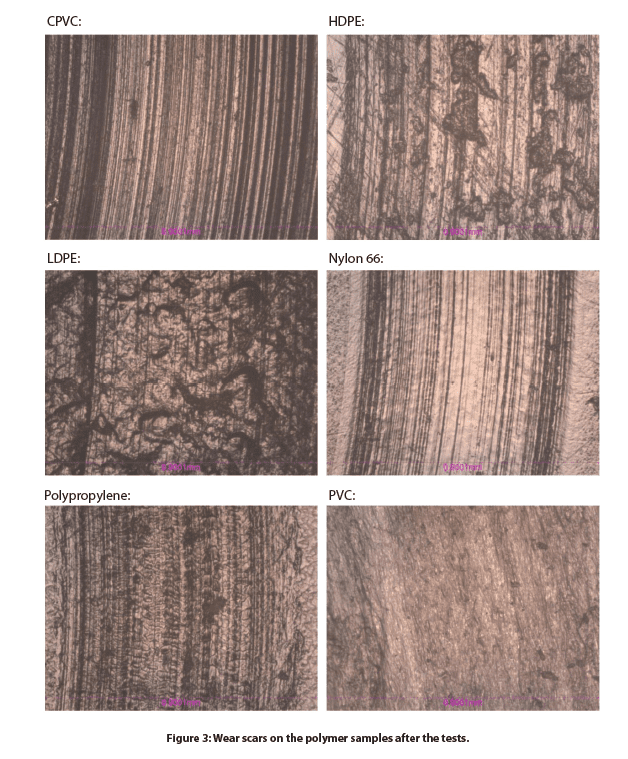
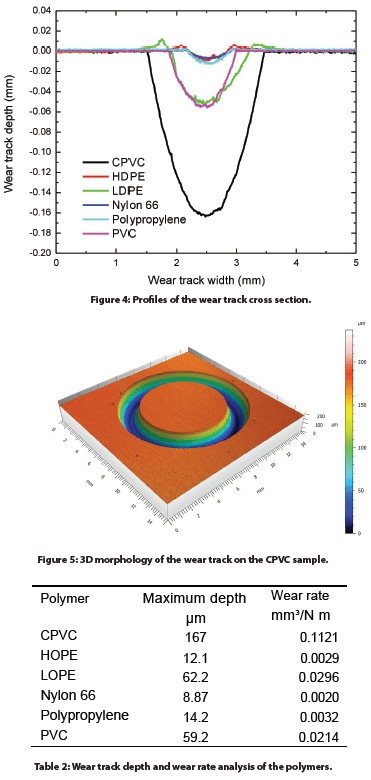
Figure 3 and Figure 4 compare the wear tracks of the polymer samples after the test is measured by the optical microscope. The In-situ non-contact 3D profilometer precisely determines the wear volume of the polymer samples, making it possible to accurately calculate wear rates of 0.0029, 0.0020, and 0.0032m3/N m, respectively. In comparison, the CPVC sample shows the highest wear rate of 0.1121m3/N m. Deep parallel wear scars are present in the wear track of CPVC.
CONCLUSION

The wear resistance of the polymers plays a vital role in their service performance. In this study, we showcased that the Nanovea Tribometer evaluates the coefficient of friction and wear rate of different polymers in a
well-controlled and quantitative manner. HDPE shows the lowest COF of ~0.15 among the tested polymers. HDPE, Nylon 66, and Polypropylene samples possess low wear rates of 0.0029, 0.0020 and 0.0032 m3/N m, respectively. The combination of low friction and great wear resistance makes HDPE a good candidate for polymer tribological applications.
The In-situ non-contact 3D profilometer enables precise wear volume measurement and offers a tool to analyze the detailed morphology of the wear tracks, providing more insight into the fundamental understanding of wear mechanisms

Honeycomb Panel Surface Finish with 3D Profilometry
INTRODUCTION
Roughness, porosity, and texture of the honeycomb panel surface are critical to quantify for the final panel design. These surface qualities can directly correlate to the aesthetics and functional characteristics of the panel surface. A better understanding of the surface texture and porosity can help optimize the panel surface processing and manufacturability. A quantitative, precise, and reliable surface measurement of the honeycomb panel is needed to control surface parameters for application and painting requirements. The Nanovea 3D Non-Contact sensors utilize unique chromatic confocal technology capable of precisely measuring these panel surfaces.
MEASUREMENT OBJECTIVE
In this study, the Nanovea HS2000 platform equipped with a high-speed Line Sensor was used to measure and compare two honeycomb panels with different surface finishes. We showcase the Nanovea non-contact profilometer’s ability to provide fast and precise 3D profiling measurements and comprehensive in-depth analysis of the surface finish.
RESULTS AND DISCUSSION
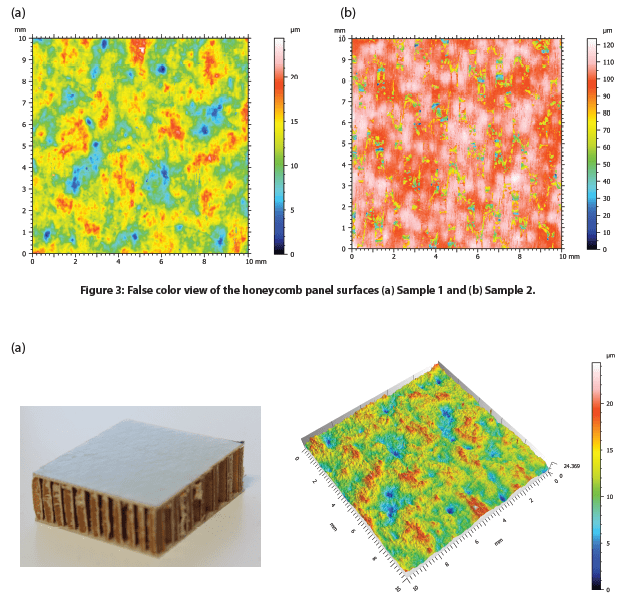
The surface of two honeycomb panel samples with varied surface finishes, namely Sample 1 and Sample 2, were measured. The false color and 3D view of the Samples 1 and 2 surfaces are shown in Figure 3 and Figure 4, respectively. The roughness and flatness values were calculated by advanced analysis software and are compared in Table 1. Sample 2 exhibits a more porous surface compared to Sample 1. As a result, Sample 2 possesses a higher roughness Sa of 14.7 µm, compared to an Sa value of 4.27 µm for Sample 1.
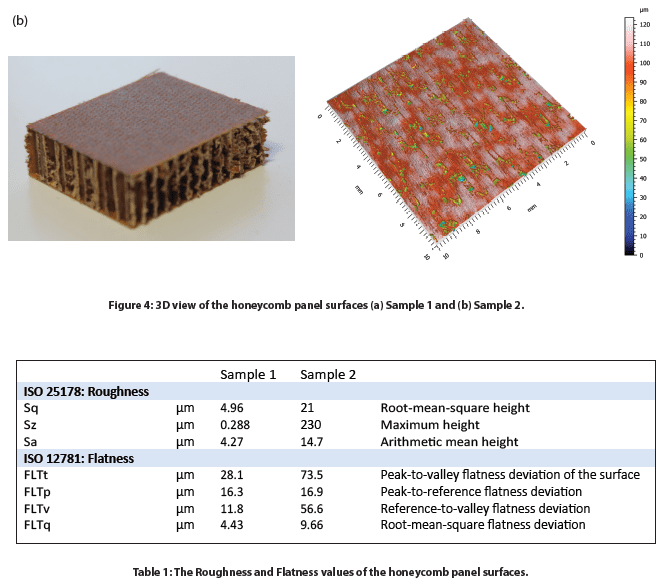
The 2D profiles of the honeycomb panel surfaces were compared in Figure 5, allowing users to have a visual comparison of the height change at different locations of the sample surface. We can observe that Sample 1 has a height variation of ~25 µm between the highest peak and lowest valley location. On the other hand, Sample 2 shows several deep pores across the 2D profile. The advanced analysis software has the ability to automatically locate and measure the depth of six relatively deep pores as shown in the table of Figure 4.b Sample 2. The deepest pore amongst the six possesses a maximum depth of nearly 90 µm (Step 4).
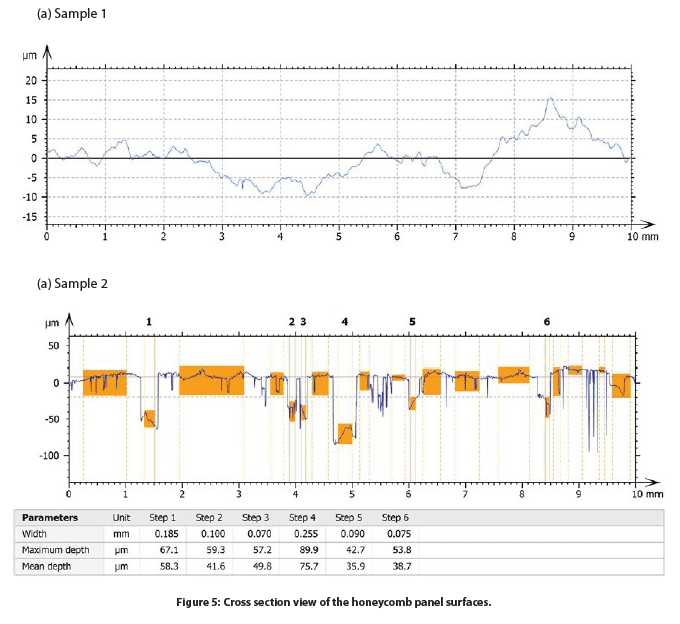
To further investigate the pore size and distribution of Sample 2, porosity evaluation was performed and discussed in the following section. The sliced view is displayed in Figure 5 and the results are summarized in Table 2. We can observe that the pores, marked in blue color in Figure 5, have a relatively homogeneous distribution on the sample surface. The projected area of the pores constitutes 18.9% of the whole sample surface. The volume per mm² of the total pores is ~0.06 mm³. The pores have an average depth of 42.2 µm, and the maximum depth is 108.1 µm.

CONCLUSION

In this application, we have showcased that the Nanovea HS2000 platform equipped with a high-speed Line Sensor is an ideal tool for analyzing and comparing the surface finish of honeycomb panel samples in a fast and accurate manner. The high-resolution profilometry scans paired with an advanced analysis software allow for a comprehensive and quantitative evaluation of the surface finish of honeycomb panel samples.
The data shown here represents only a small portion of the calculations available in the analysis software. Nanovea Profilometers measure virtually any surface for a wide range of applications in the Semiconductor, Microelectronic, Solar, Fiber Optics, Automotive, Aerospace, Metallurgy, Machining, Coatings, Pharmaceutical, Biomedical, Environmental and many other industries.
Stress Relaxation Measurement using Nanoindentation


INTRODUCTION
Viscoelastic materials are characterized as having both viscous and elastic material properties. These materials are subject to time-dependent stress decrease (stress ‘relaxation’) under constant strain, leading to a significant loss of initial contact force. Stress relaxation is dependent on the type of material, texture, temperature, initial stress, and time. Understanding stress relaxation is critical in selecting optimal materials that have the strength and flexibility (relaxation) required for specific applications.
Importance of Stress Relaxation Measurement

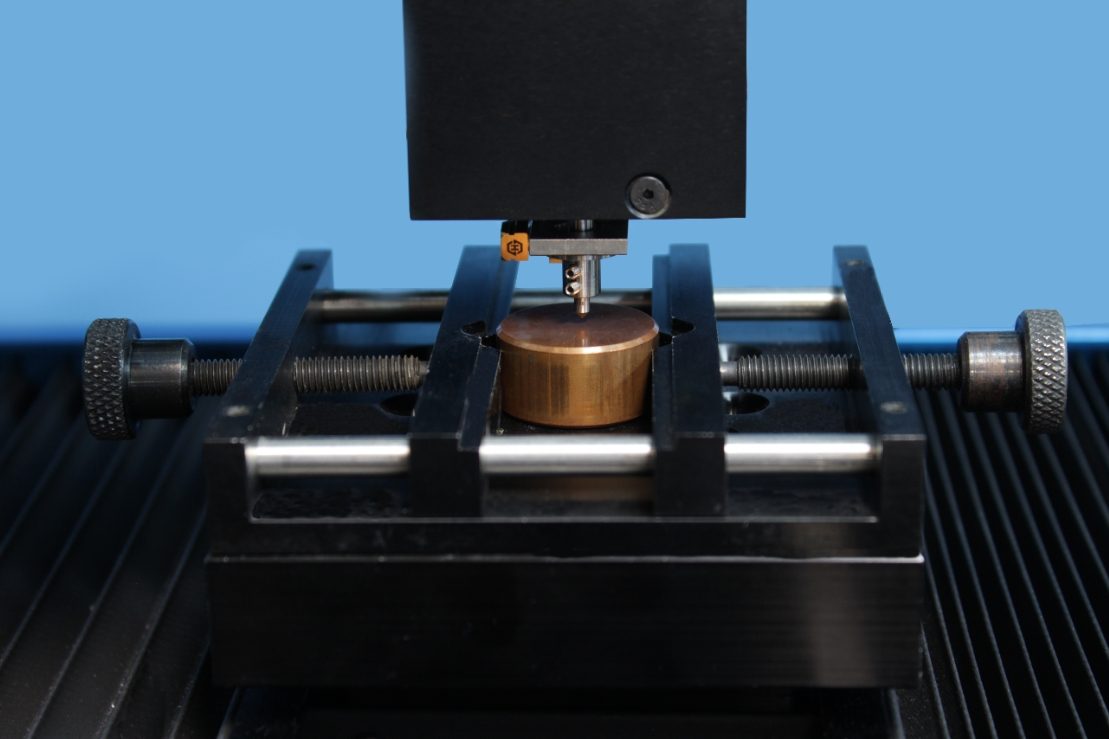
As per ASTM E328i, “Standard Test Methods for Stress Relaxation for Materials and Structures”, an external force is initially applied on a material or structure with an indenter until it reaches a predetermined maximum force. Once the maximum force is reached, the position of the indenter is held constant at this depth. Then the change in external force necessary to maintain the indenter’s position is measured as a function of time. The difficulty in stress relaxation testing is maintaining the depth constant. The Nanovea Mechanical Tester’s nanoindentation module accurately measures the stress relaxation by applying a closed (feedback) loop control of the depth with a piezo-electric actuator. The actuator reacts in real-time to keep the depth constant, while the change in load is measured and recorded by a highly sensitive load sensor. This test can be performed on virtually all types of materials without the need for stringent sample dimension requirements. Additionally, multiple tests can be performed on a single flat sample to ensure test repeatability
MEASUREMENT OBJECTIVE
In this application, the Nanovea Mechanical Tester’s nanoindentation module measures the stress relaxation behavior of an acrylic and copper sample. We showcase that the Nanovea Mechanical Tester is an ideal tool for evaluating the time-dependent viscoelastic behavior of polymer and metal materials.
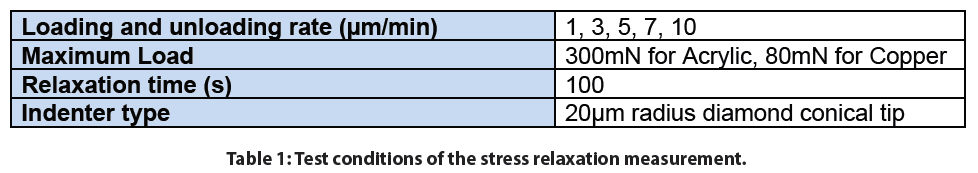
TEST CONDITIONS
The stress relaxation of an acrylic and a copper sample was measured by the Nanovea Mechanical Tester’s nanoindentation module. Different indentation loading rates were applied ranging from 1 to 10 µm/min. The relaxation was measured at a fixed depth once the target maximum load was reached. A 100 second holding period was implemented at a fixed depth and the change in load was recorded as the holding time elapsed. All of the tests were conducted at ambient conditions (room temperature of 23 °C) and the indentation test parameters are summarized in Table 1.
RESULTS AND DISCUSSION
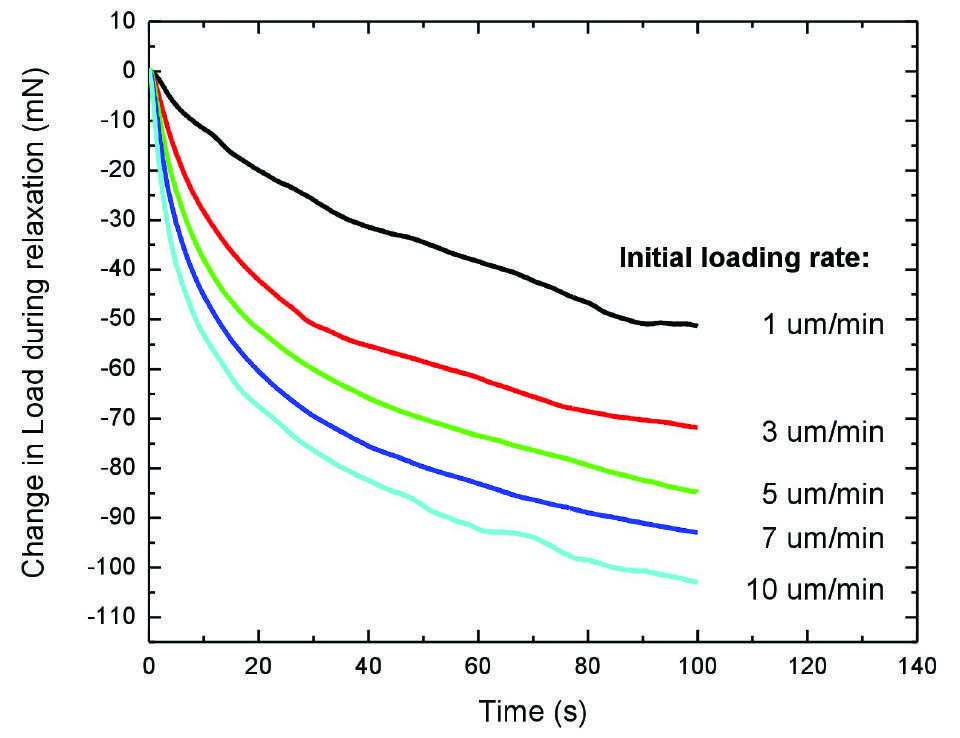
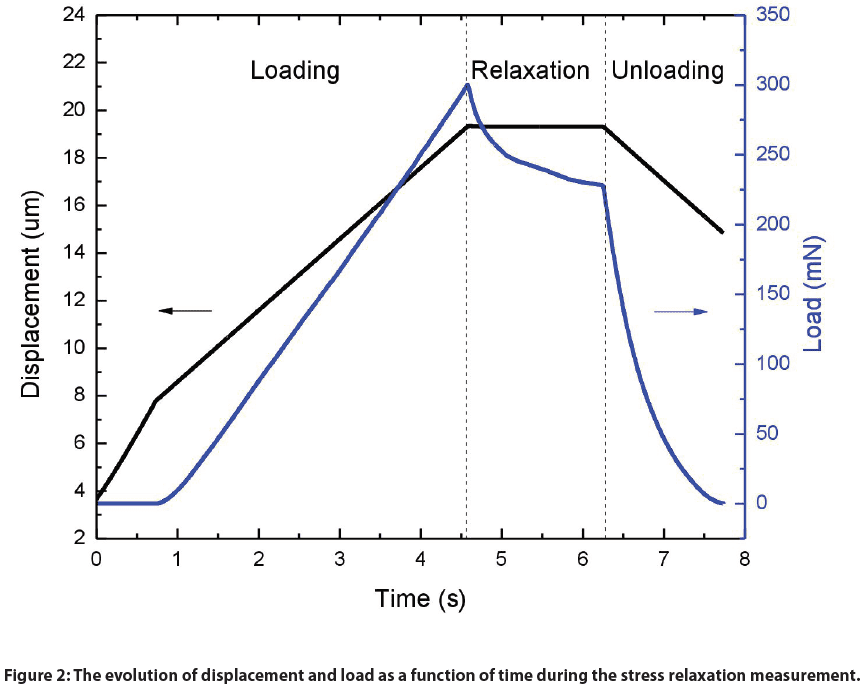
Figure 2 shows the evolution of displacement and load as a function of time during the stress relaxation measurement of an acrylic sample and an indentation loading rate of 3 µm/min as an example. The entirety of this test can be broken down into three stages: Loading, Relaxation and Unloading. During the Loading stage, the depth linearly increased as the load progressively increased. The Relaxation stage was initiated once the maximum load was reached. During this stage a constant depth was maintained for 100 seconds by using the closed feedback loop depth control feature of the instrument and it was observed that the load decreased over time. The entire test concluded with an unloading stage in order to remove the indenter from the acrylic sample.
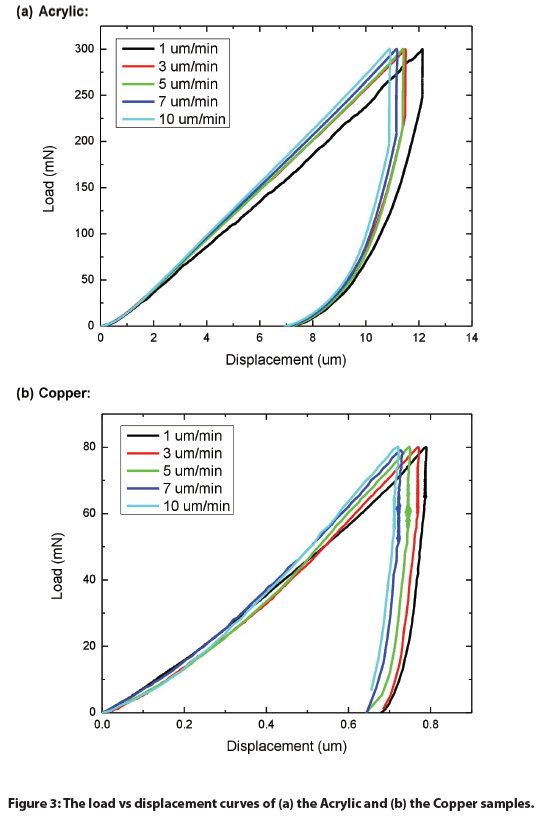
Additional indentation tests were conducted using the same indenter loading rates but excluding a relaxation (creep) period. Load vs. displacement plots were acquired from these tests and were combined in the graphs in Figure 3 for the acrylic and copper samples. As the indenter loading rate decreased from 10 to 1 µm/min, the load-displacement curve shifted progressively towards higher penetration depths for both Acrylic and Copper. Such a time-dependent increase in strain results from the viscoelastic creep effect of the materials. A lower loading rate allows a viscoelastic material to have more time to react to the external stress it experiences and to deform accordingly..
The evolution of load at a constant strain using different indentation loading rates were plotted in Figure 4 for both materials tested. The load decreased at a higher rate in the early stages of the relaxation stage (100 second hold period) of the tests and slowed down once the hold time reached ~50 seconds. Viscoelastic materials, such as polymers and metals, exhibit greater load loss rate when they are subjected to higher indentation loading rates. The load loss rate during relaxation increased from 51.5 to 103.2 mN for Acrylic, and from 15.0 to 27.4 mN for Copper, respectively, as the indentation loading rate increased from 1 to 10 µm/min, as summarized in Figure 5.


As mentioned In ASTM Standard E328ii, the major problem encountered in stress relaxation tests is an instrument’s inability of maintaining a constant strain/depth. The Nanovea Mechanical Tester provides excellent accurate stress relaxation measurements due to its ability to apply a closed feedback loop control of the depth between the fast acting piezo-electric actuator and the independent capacitor depth sensor. During the relaxation stage, the piezo-electric actuator adjusts the indenter to maintain its constant depth constraint in real-time while the change in load is measured and recorded by an independent high precision load sensor.
CONCLUSION

The stress relaxation of an acrylic and a copper sample were measured using the nanoindentation module of the Nanovea Mechanical Tester at different loading rates. A greater maximum depth is reached when indentations are performed at lower loading rates due to the creep effect of the material during loading. Both the acrylic and the copper sample exhibit stress relaxation behavior when the indenter position at a targeted maximum load is held constant. Larger changes in load loss during the relaxation stage were observed for the tests with higher indentation loading rates.
The stress relaxation test produced by the Nanovea Mechanical Tester showcase the instruments ability to quantify and reliably measure the time-dependent viscoelastic behavior of polymer and metal materials. It has an unmatched multi-function Nano and Micro modules on a single platform. Humidity and temperature control modules can be paired with these instruments for environmental testing capabilities applicable to a wide range of industries. Both the Nano and Micro modules include scratch testing, hardness testing, and wear testing modes, providing the widest and most user-friendly range of mechanical testing capabilities available on a single system.


