USA/GLOBAL: +1-949-461-9292
EUROPE: +39-011-3052-794
CONTACT US
Sandpaper Roughness Profilometer

Sandpaper: Roughness & Particle Diameter Analysis

Sandpaper: Roughness & Particle Diameter Analysis

Learn more


SANDPAPER

Roughness & Particle Diameter Analysis

Prepared by

FRANK LIU

INTRODUCTION

Sandpaper is a common commercially available product used as an abrasive. The most common use for sandpaper is to remove coatings or to polish a surface with its abrasive properties. These abrasive properties are classified into grits, each related to how smooth or
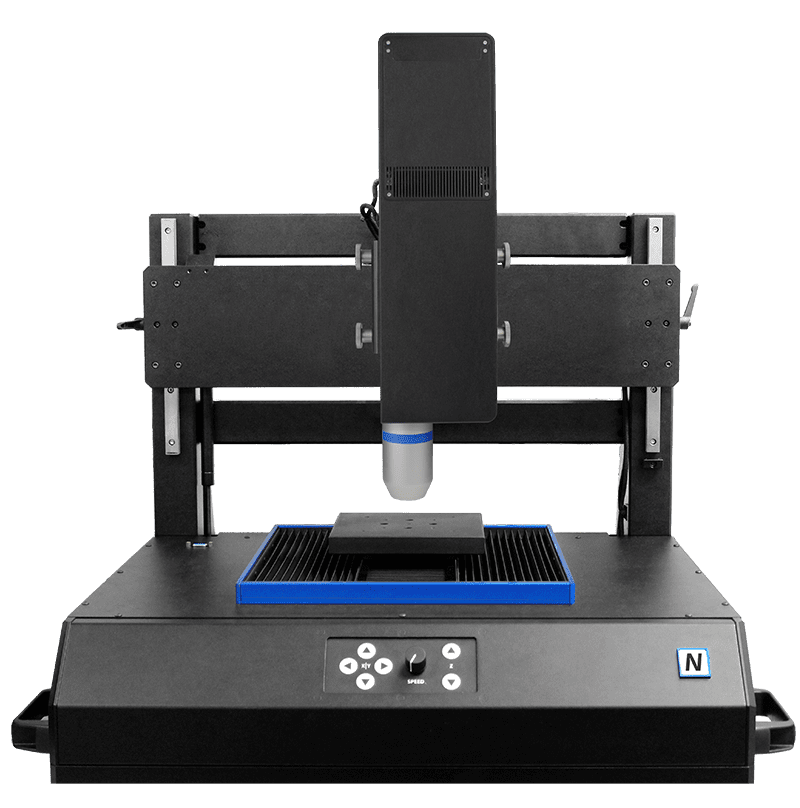
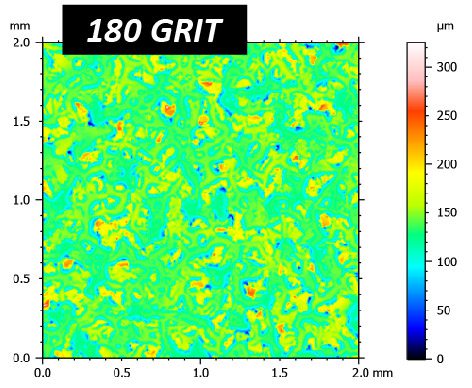
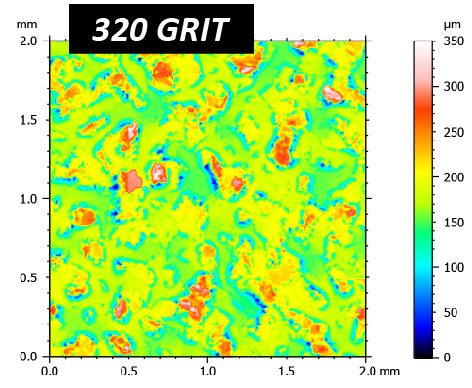
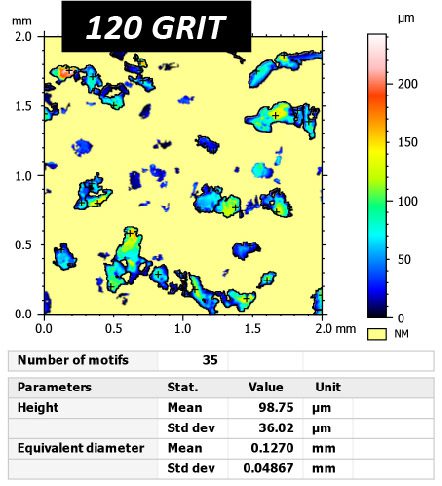
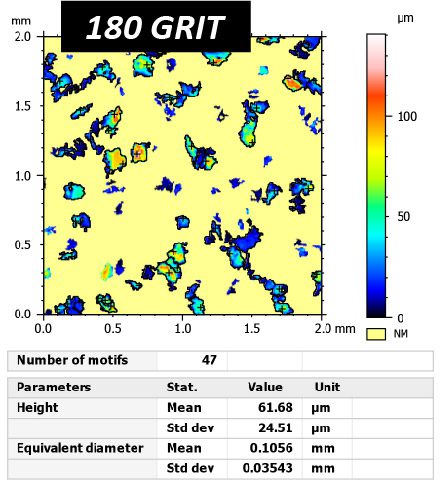
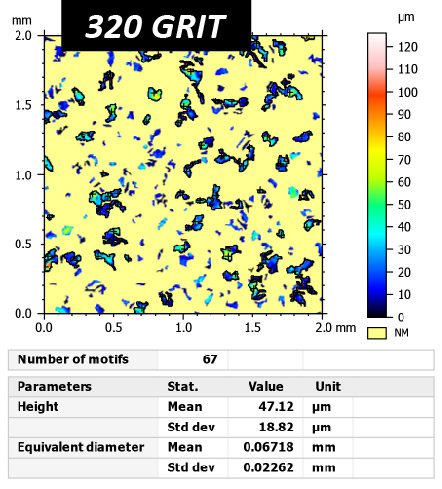
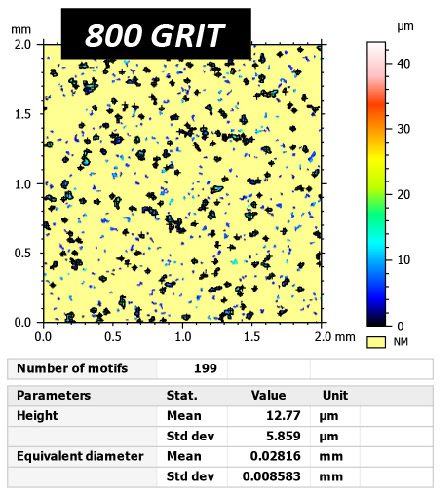
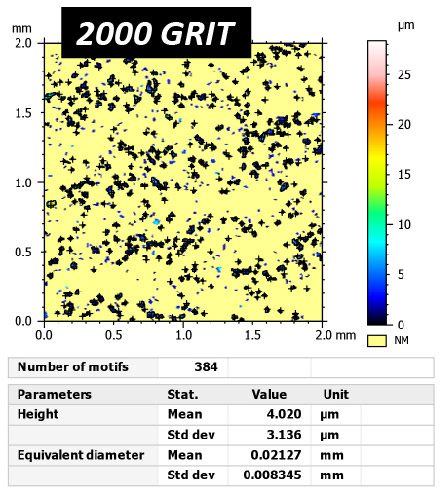
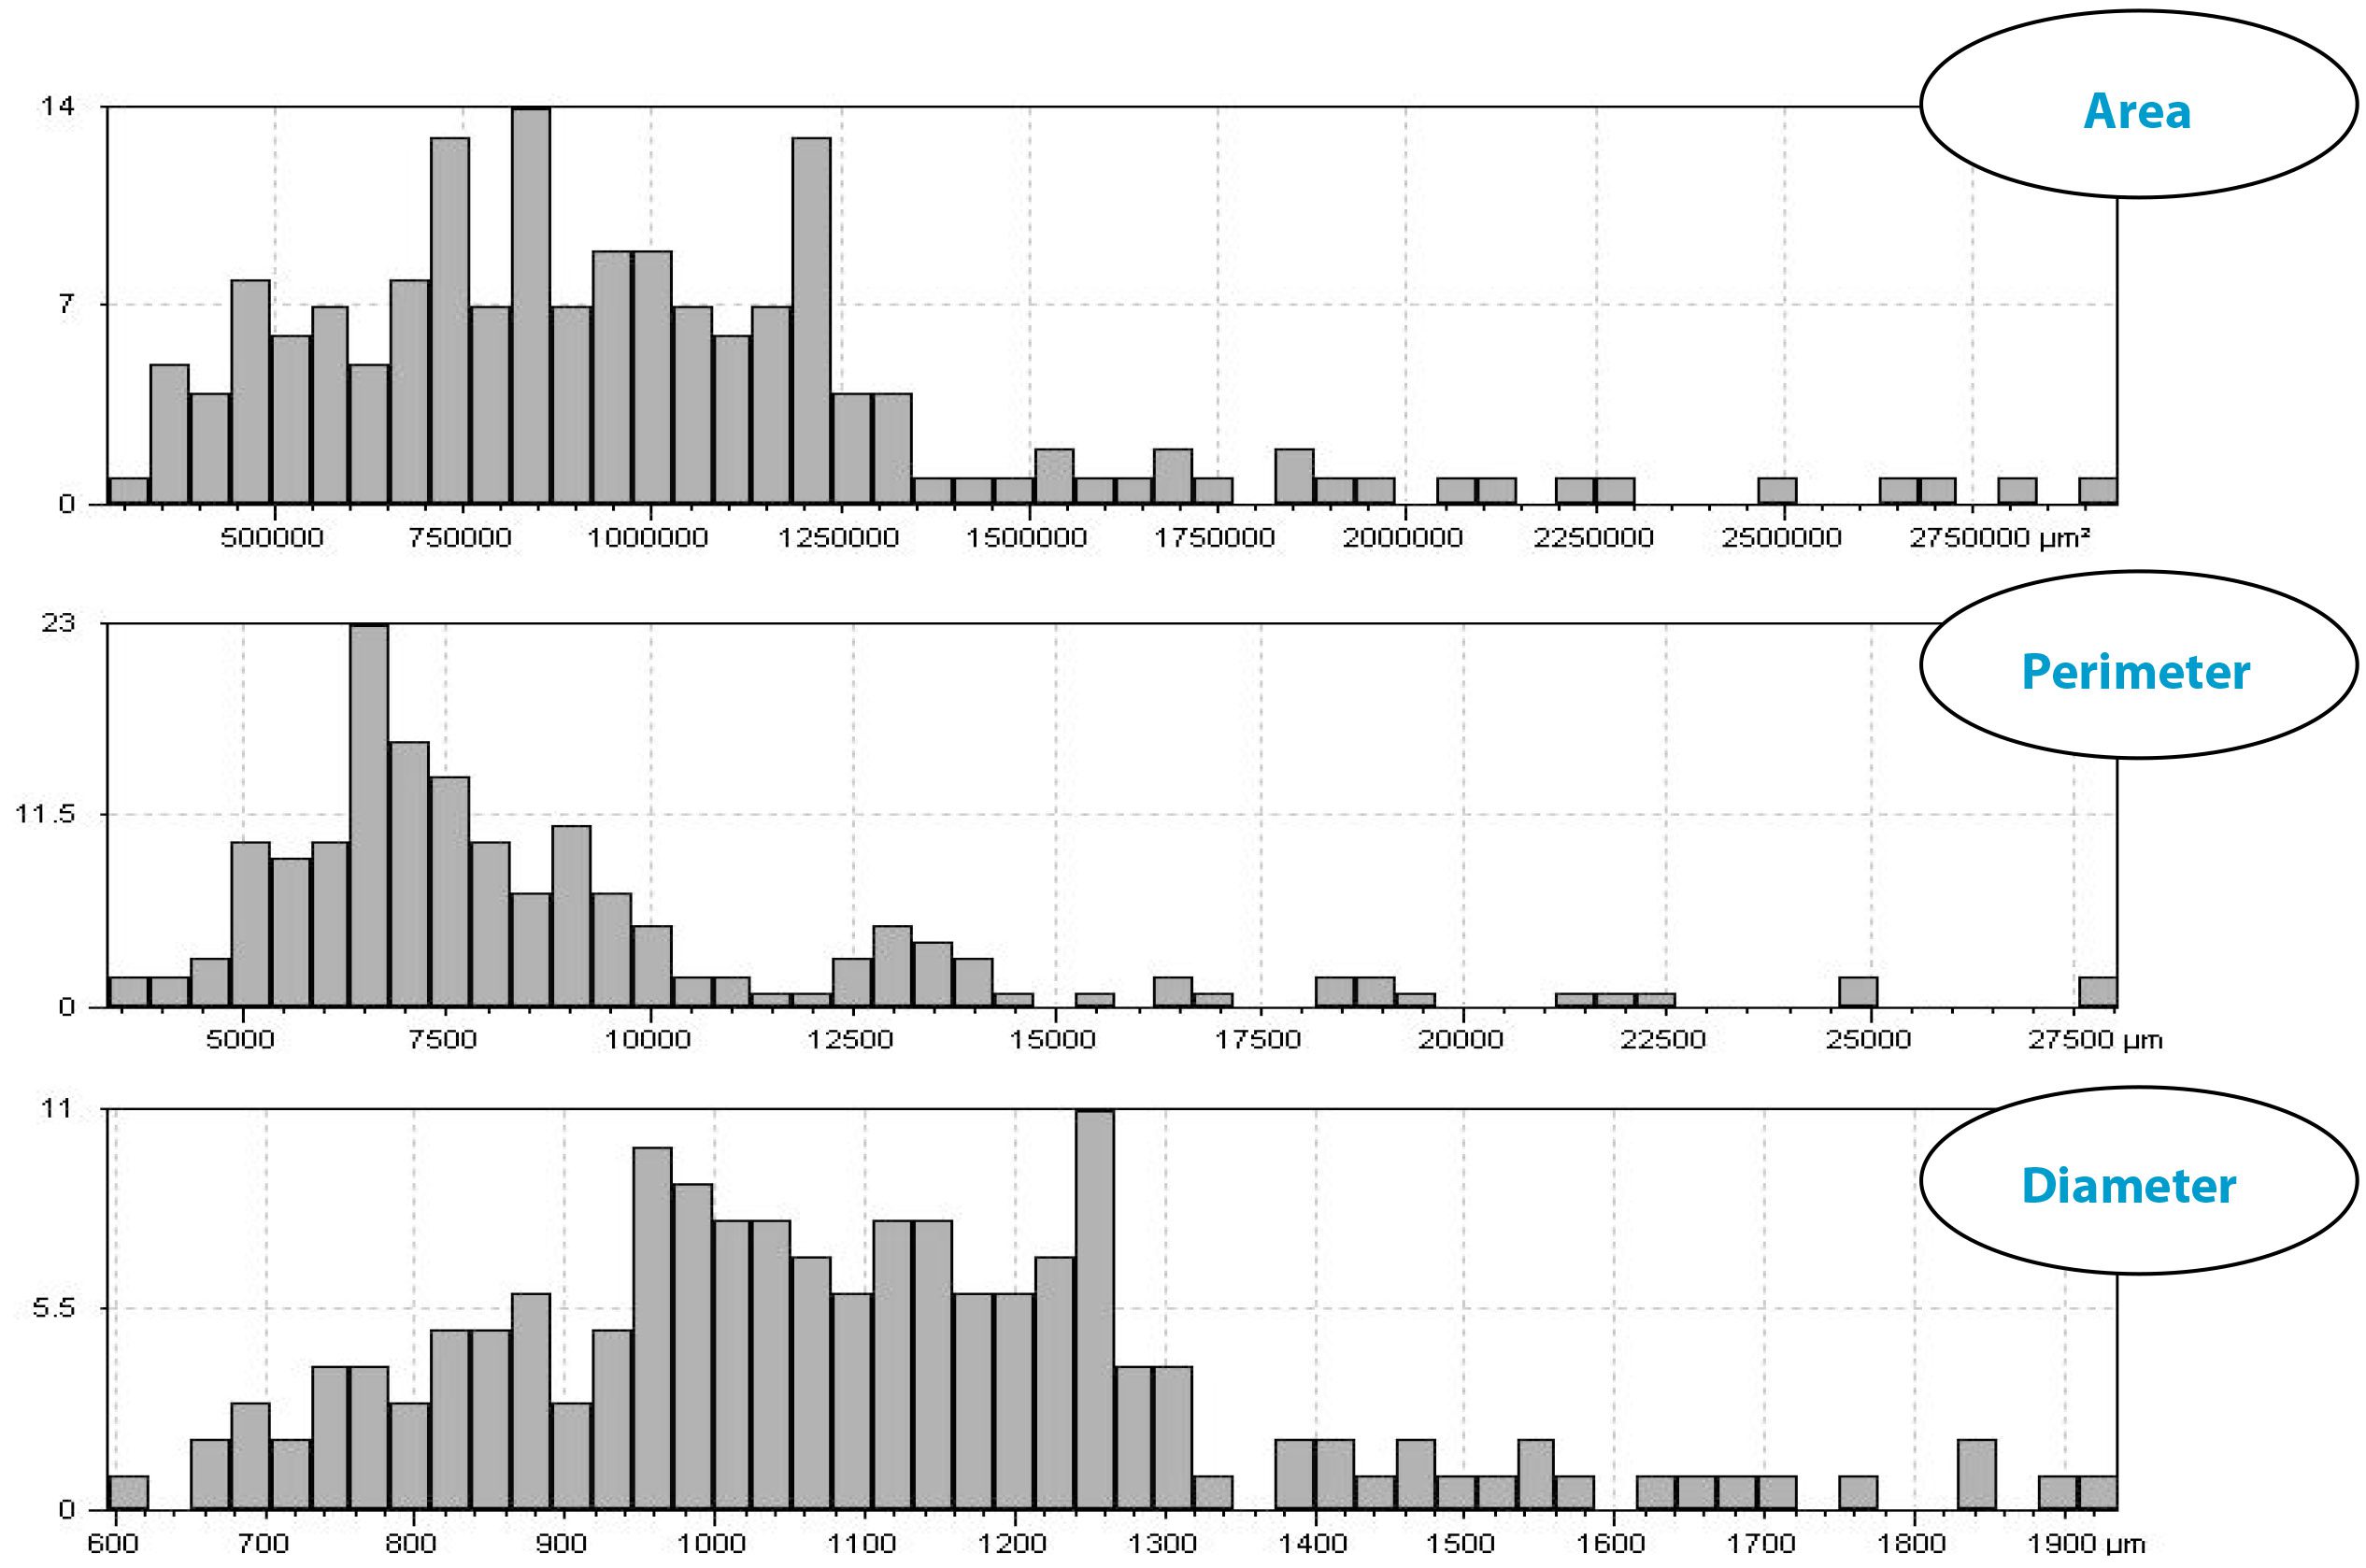
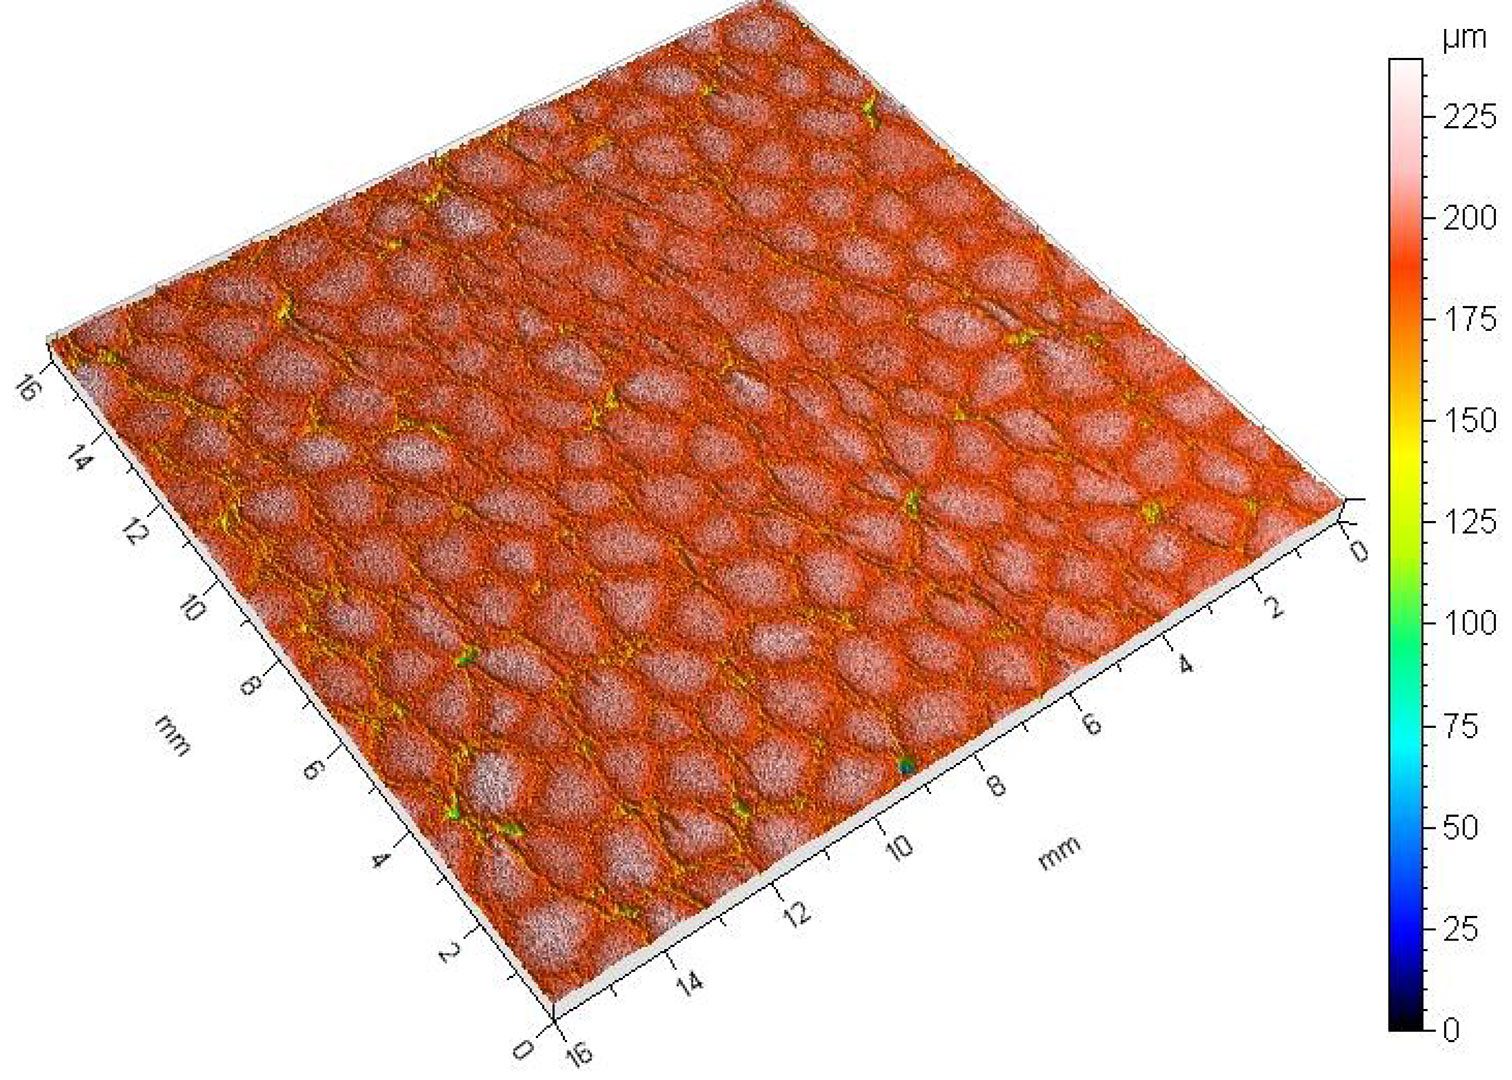
rough of a surface finish it will give. To achieve desired abrasive properties, manufactures of sandpaper must ensure that the abrasive particles are of a specific size and have little deviation. To quantify the quality of sandpaper, NANOVEA’s 3D Non-Contact Profilometer can be used to obtain the arithmetic mean (Sa) height parameter and average particle diameter of a sample area.

IMPORTANCE OF 3D NON-CONTACT OPTICAL PROFILER FOR SANDPAPER

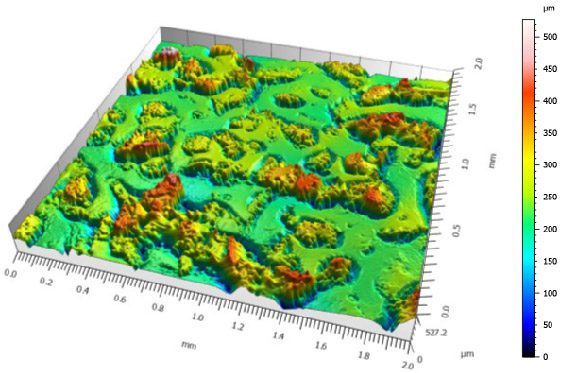
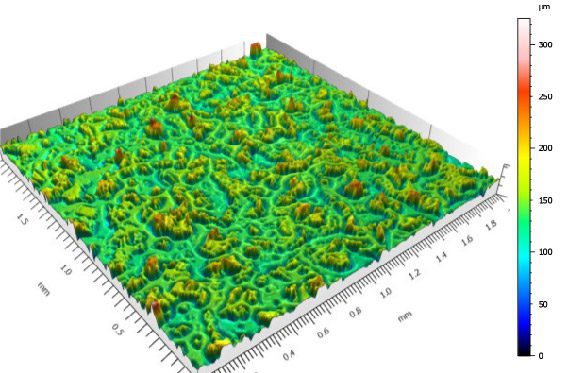
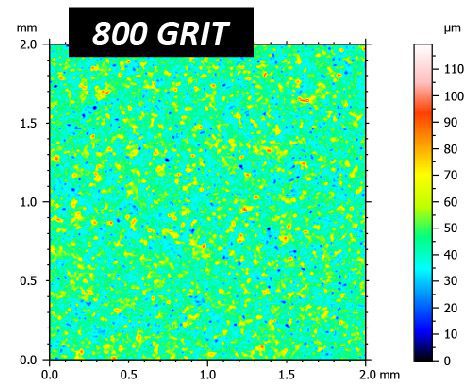
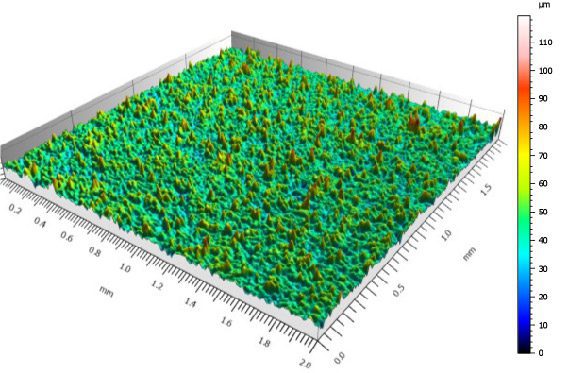
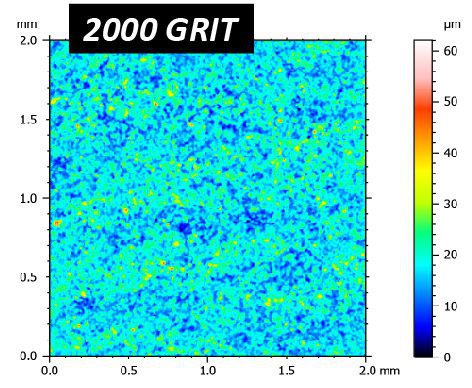
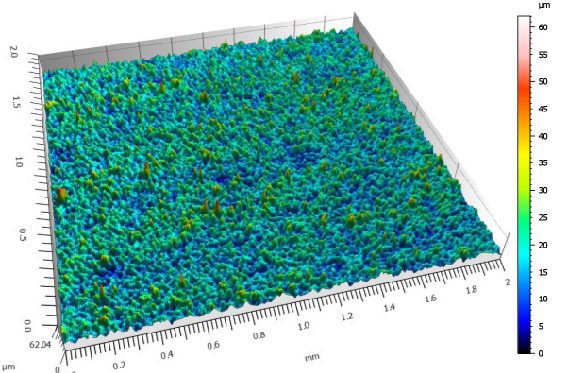
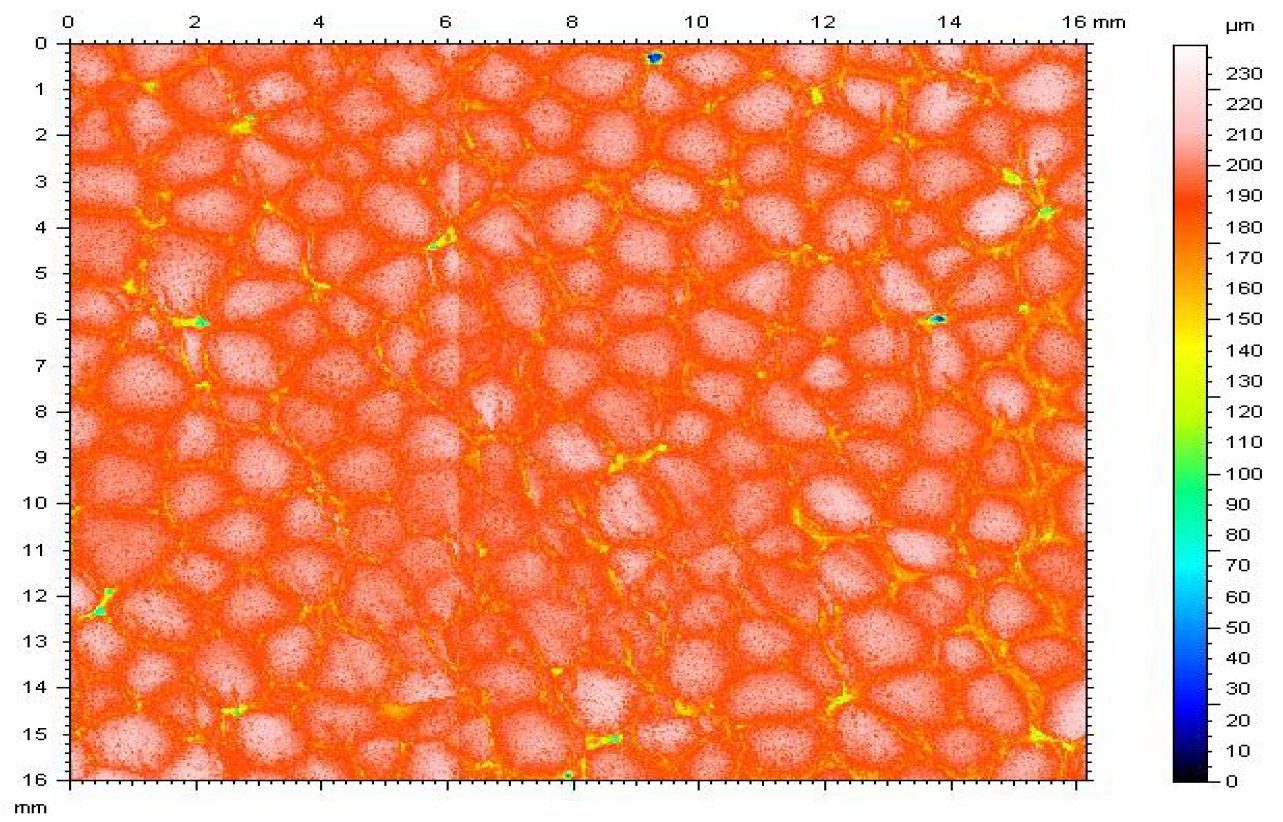
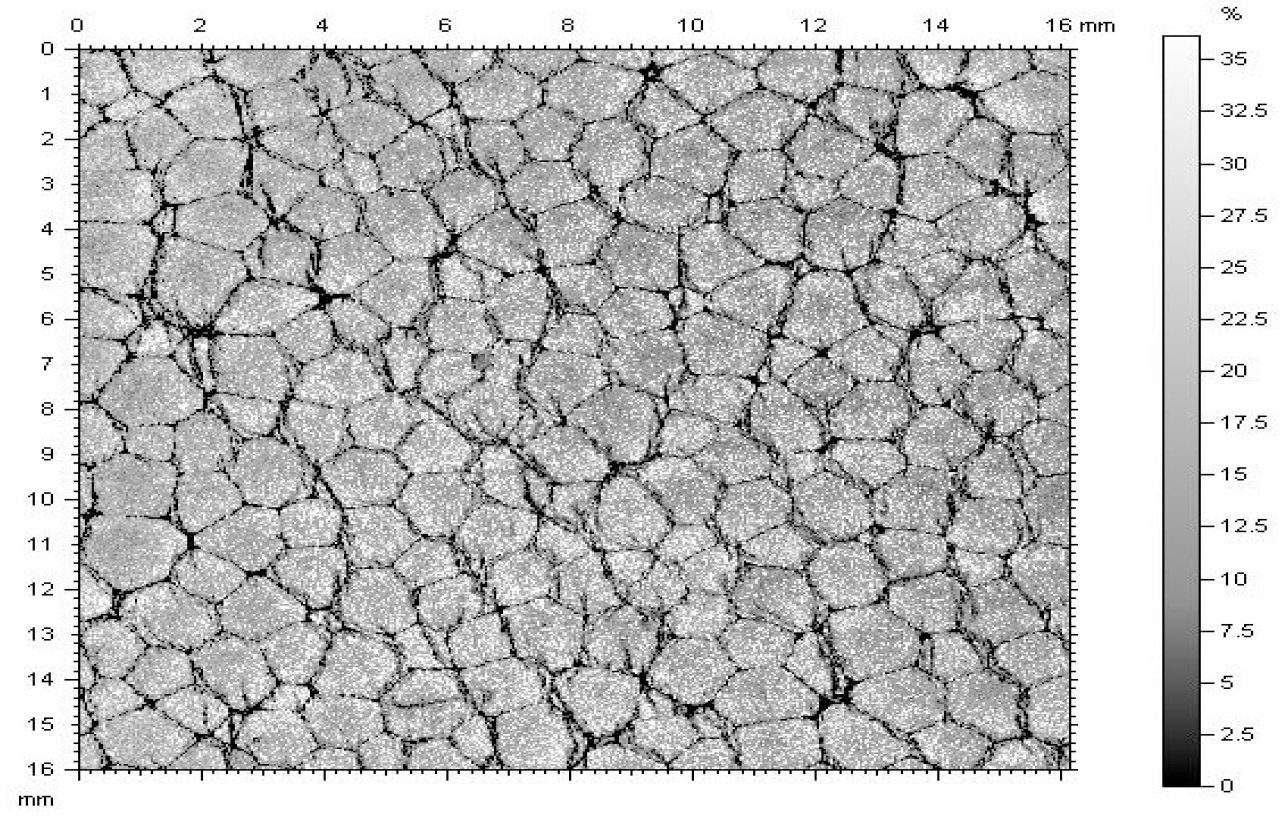
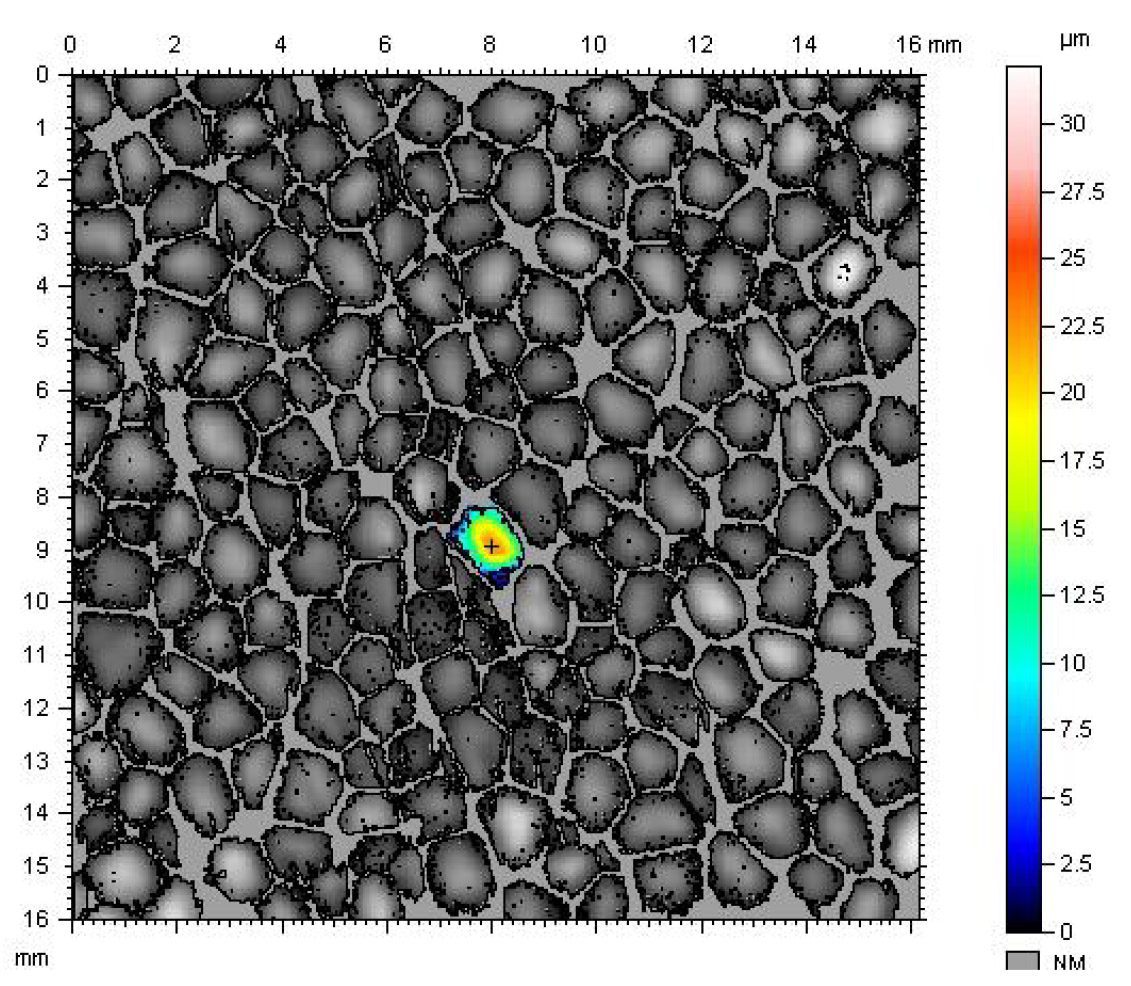
When using sandpaper, interaction between abrasive particles and the surface being sanded must be uniform to obtain consistent surface finishes. To quantify this, the surface of the sandpaper can be observed with NANOVEA’s 3D Non-Contact Optical Profiler to see deviations in the particle sizes, heights, and spacing.

MEASUREMENT OBJECTIVE

In this study, five different sandpaper grits (120,
180, 320, 800, and 2000) are scanned with the
NANOVEA ST400 3D Non-Contact Optical Profiler.
The Sa is extracted from the scan and the particle
size is calculated by conducting a Motifs analysis to
find their equivalent diameter

NANOVEA

ST400

RESULTS & DISCUSSION

The sandpaper decreases in surface roughness (Sa) and particle size as the grit increases, as expected. The Sa ranged from 42.37 μm to 3.639 μm. The particle size ranges from 127 ± 48.7 to 21.27 ± 8.35. Larger particles and high height variations create stronger abrasive action on surfaces as opposed to smaller particles with low height variation.
Please note all definitions of the given height parameters are listed on page.A.1.

TABLE 1: Comparison between sandpaper grits and height parameters.

TABLE 2: Comparison between sandpaper grits and particle diameter.

2D & 3D VIEW OF SANDPAPER 

Below are the false-color and 3D view for the sandpaper samples.
A gaussian filter of 0.8 mm was used to remove the form or waviness.

MOTIF ANALYSIS

To accurately find the particles at the surface, the height scale threshold was redefined to only show the upper layer of the sandpaper. A motifs analysis was then conducted to detect the peaks.

CONCLUSION

NANOVEA’s 3D Non-Contact Optical Profiler was used to inspect the surface properties of various sandpaper grits due to its ability to scan surfaces with micro and nano features with precision.

Surface height parameters and the equivalent particle diameters were obtained from each of the sandpaper samples using advanced software to analyze the 3D scans. It was observed that as the grit size increased, the surface roughness (Sa) and particle size decreased as expected.

NOW, LET'S TALK ABOUT YOUR APPLICATION

Styrofoam Surface Boundary Measurement Profilometry

Surface Boundary Measurement

Surface Boundary Measurement Using 3D Profilometry

Learn more


SURFACE BOUNDARY MEASUREMENT

USING 3D PROFILOMETRY

Prepared by

Craig Leising

INTRODUCTION

In studies where the interface of surface features, patterns, shapes etc., are being evaluated for orientation, it will be useful to quickly identify areas of interest over the entire profile of measurement. By segmenting a surface into significant areas the user can quickly evaluate boundaries, peaks, pits, areas, volumes and many others to understand their functional role in the entire surface profile under study. For example, like that of a grain boundary imaging of metals, the importance of analysis is the interface of many structures and their overall orientation. By understanding each area of interest defects and or abnormalities within the overall area can be identified. Although grain boundary imaging is typically studied at a range surpassing Profilometer capability, and is only 2D image analysis, it is a helpful reference to illustrate the concept of what will be shown here on a larger scale along with 3D surface measurement advantages.

IMPORTANCE OF 3D NON CONTACT PROFILOMETER FOR SURFACE SEPARATION STUDY

Unlike other techniques such as touch probes or interferometry, the 3D Non Contact Profilometer, using axial chromatism, can measure nearly any surface, sample sizes can vary widely due to open staging and there is no sample preparation needed. Nano through macro range is obtained during surface profile measurement with zero influence from sample reflectivity or absorption, has advanced ability to measure high surface angles and there is no software manipulation of results. Easily measure any material: transparent, opaque, specular, diffusive, polished, rough etc. The technique of the Non Contact Profilometer provides an ideal, broad and user friendly capability to maximize surface studies when surface boundary analysis will be needed; along with the benefits of combined 2D & 3D capability.

MEASUREMENT OBJECTIVE

In this application the Nanovea ST400 Profilometer is used to measure the surface area of Styrofoam. Boundaries were established by combining a reflected intensity file along with the topography, which are simultaneously acquired using the NANOVEA ST400. This data was then used to calculate different shape and size information of each Styrofoam “grain”.

NANOVEA

ST400

RESULTS & DISCUSSION: 2D Surface Boundary Measurement

Topography image(below left) masked by reflected intensity image(below right) to clearly define grain boundaries. All grains below 565µm diameter have been ignored by applying filter.

Total number of grains: 167
Total projected area occupied by the grains: 166.917 mm² (64.5962 %)
Total projected area occupied by boundaries: (35.4038 %)
Density of grains: 0.646285 grains / mm2

Area = 0.999500 mm² +/- 0.491846 mm²
Perimeter = 9114.15 µm +/- 4570.38 µm
Equivalent diameter = 1098.61 µm +/- 256.235 µm
Mean diameter = 945.373 µm +/- 248.344 µm
Min diameter = 675.898 µm +/- 246.850 µm
Max diameter = 1312.43 µm +/- 295.258 µm

RESULTS & DISCUSSION: 3D Surface Boundary Measurement

By using the 3D topography data obtained, the volume, height, peak, aspect ratio and general shape information can be analyzed on each grain. Total 3D area occupied: 2.525mm3

CONCLUSION

In this application, we have shown how the NANOVEA 3D Non Contact Profilometer can precisely characterize the surface of Styrofoam. Statistical information can be gained over the entire surface of interest or on individual grains, whether they are peaks or pits. In this example all grains larger than a user defined size were used to show the area, perimeter, diameter and height. The features shown here can be critical to research and quality control of natural and pre fabricated surfaces ranging from bio medical to micromachining applications along with many others. 

NOW, LET'S TALK ABOUT YOUR APPLICATION