Monthly Archives: April 2020
Composite Material Analysis using 3D Profilometry
Importance of Non-Contact Profilometry for Composite Materials
It is crucial defects are minimized so composite materials are as strong as possible in reinforcement applications. As an anisotropic material, it is critical weave direction is consistent to maintain high performance predictability. Composite materials have one of the highest strength to weight ratios making it stronger than steel in some cases. It is important to limit exposed surface area in composites to minimize chemical vulnerability and thermal expansion effects. Profilometry surface inspection is critical to quality control production of composites to ensure strong performance over a long service time.
Nanovea’s 3D Non-Contact Profilometer is unlike other surface measurement techniques such as touch probes or interferometry. Our profilometers use axial chromatism to measure nearly any surface and open staging allows for samples of any size with no preparation needed. Nano through macro measurements are obtained during surface profile measurement with zero influence from sample reflectivity or absorption. Our profilometers easily measure any material: transparent, opaque, specular, diffusive, polished, and rough with the advanced ability to measure high surface angles with no software manipulation. The Non-Contact Profilometer technique provides the ideal and user-friendly capability to maximize composite material surface studies; along with the benefits of combined 2D & 3D capability.
Measurement Objective
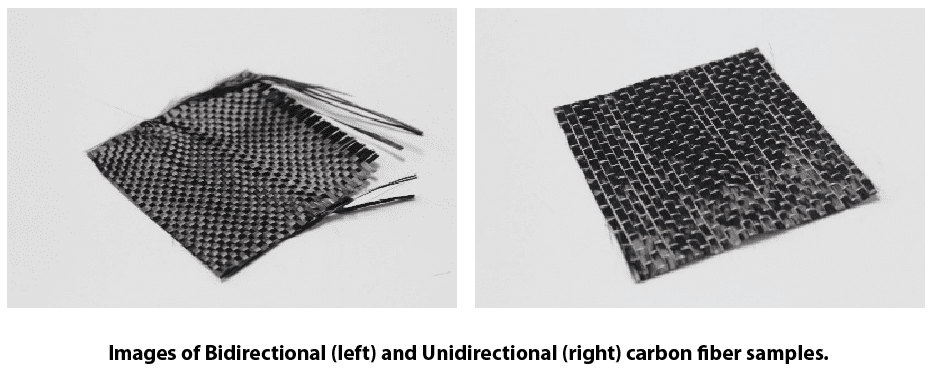
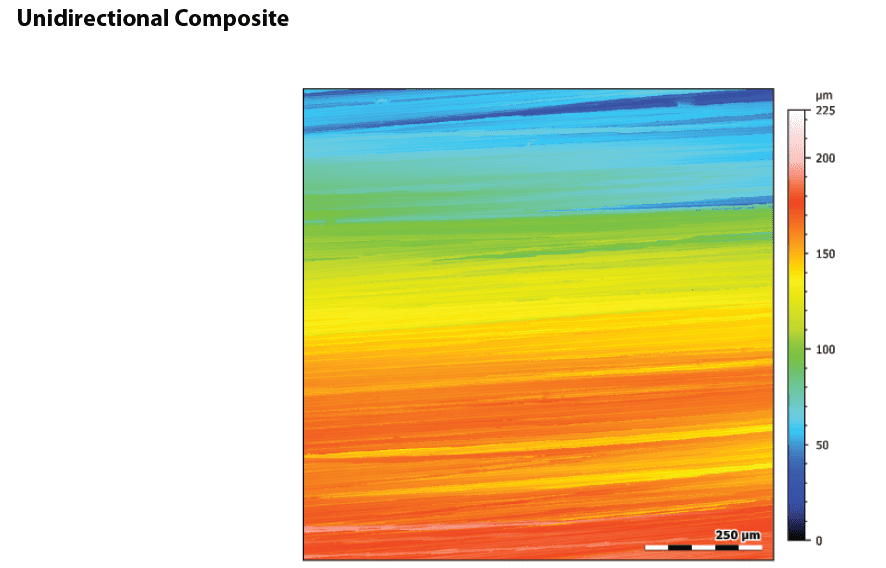
The Nanovea HS2000L Profilometer used in this application measured the surface of two weaves of carbon fiber composites. Surface roughness, weave length, isotropy, fractal analysis, and other surface parameters are used to characterize the composites. The area measured was randomly selected and assumed large enough that property values can be compared using Nanovea’s powerful surface analysis software.
Results and Discussion
Surface Analysis
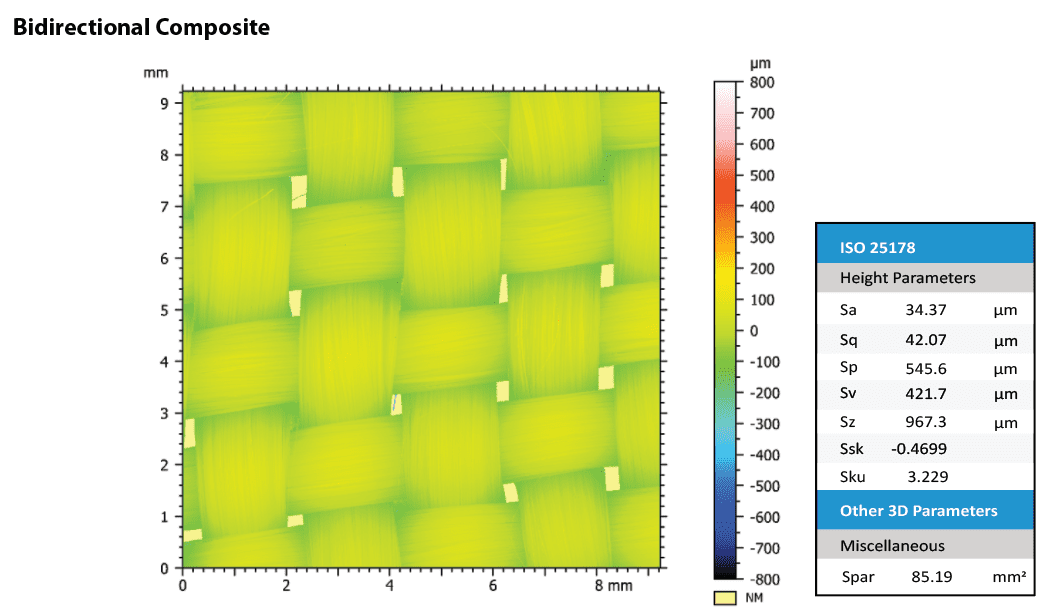
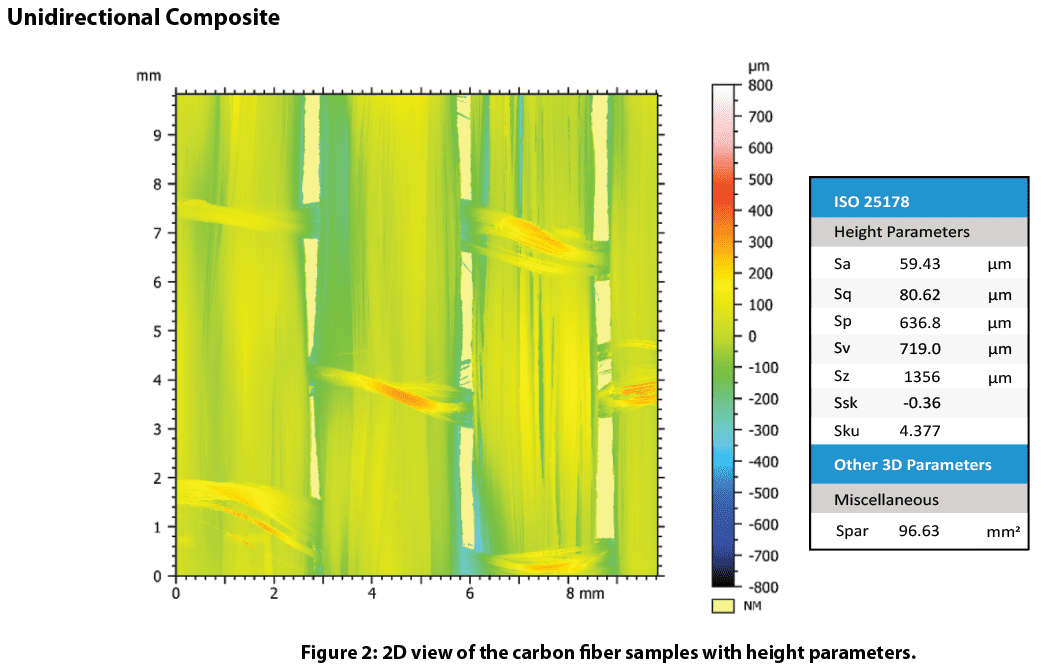
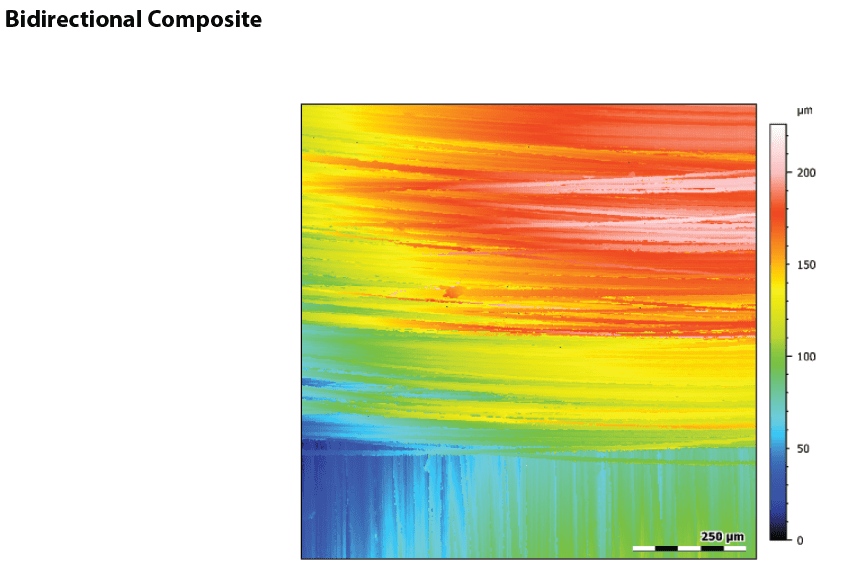
Height parameters determine how rough composite parts will be with a low fiber to matrix ratio. Our results compare different weave types and fabric to determine surface finish post-processing. Surface finish becomes critical in applications where aerodynamics may become involved.
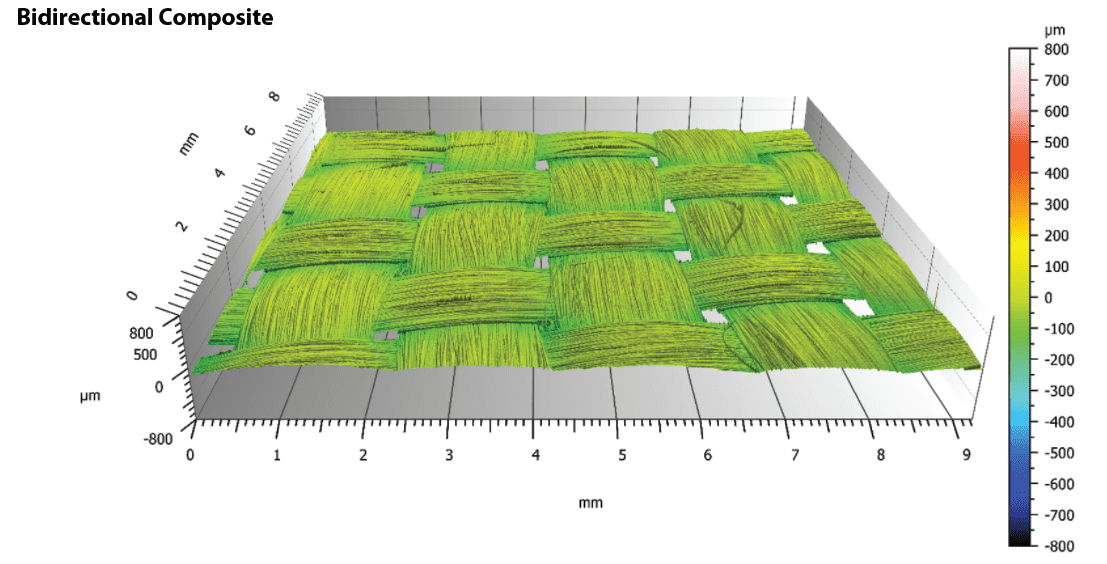
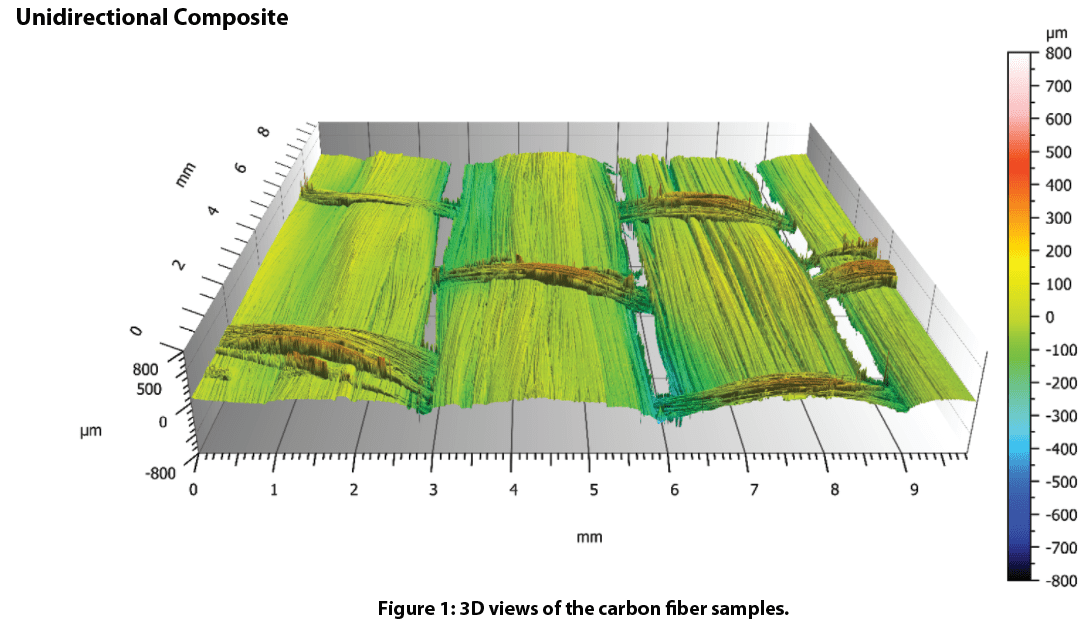
Isotropy
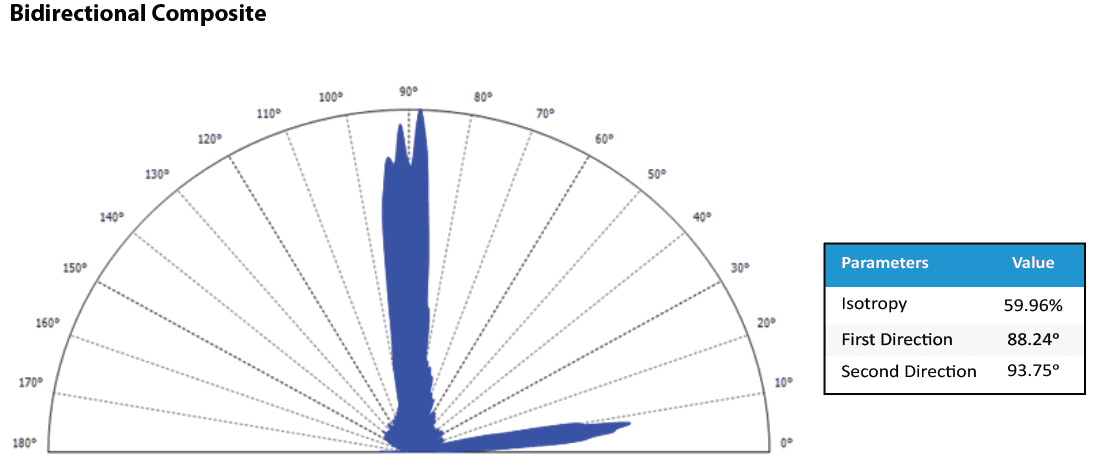
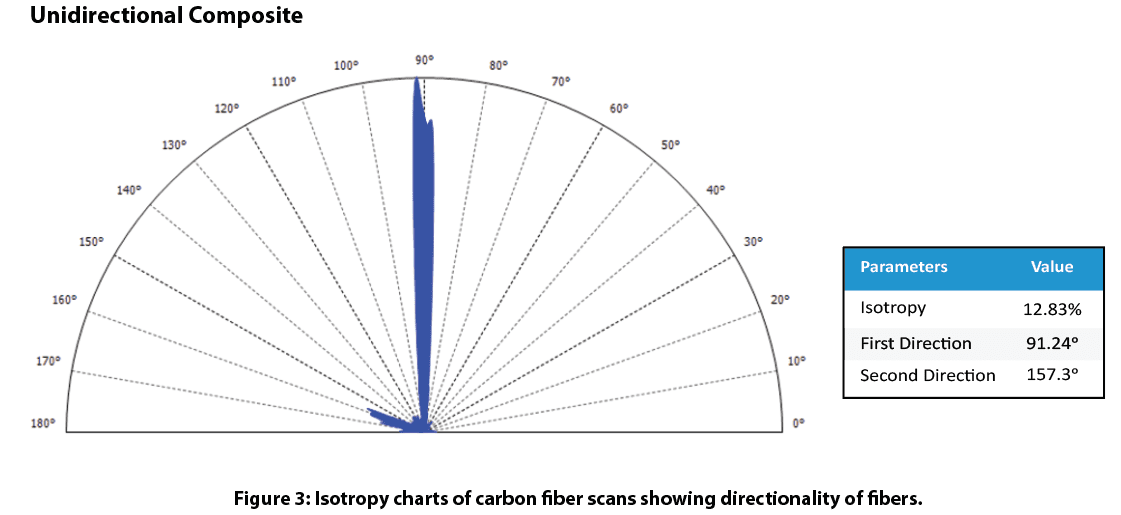
Isotropy shows directionality of the weave to determine expected property values. Our study shows how the bidirectional composite is ~60% isotropic as expected. Meanwhile, the unidirectional composite is ~13% isotropic due to the strong single fiber path direction fiber.
Weave Analysis
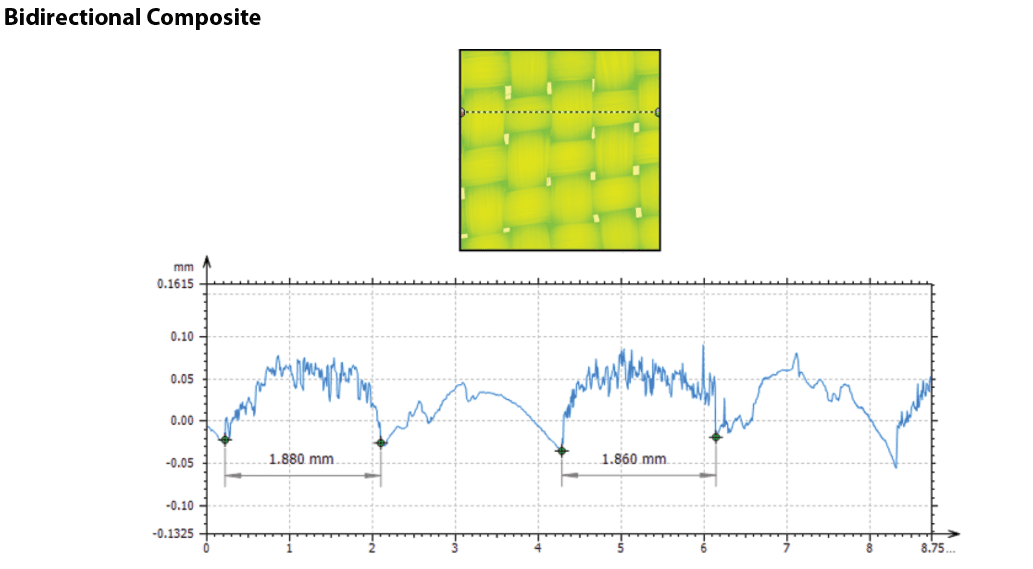
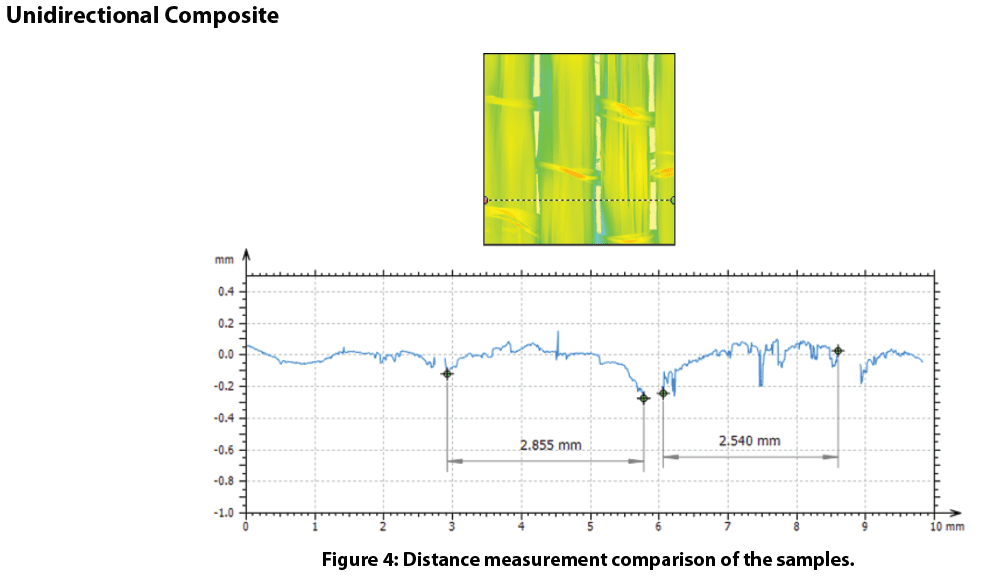
Weave size determines the consistency of packing and width of fibers used in the composite. Our study shows how easily we can measure weave size down to micron accuracy to ensure quality parts.
Texture Analysis
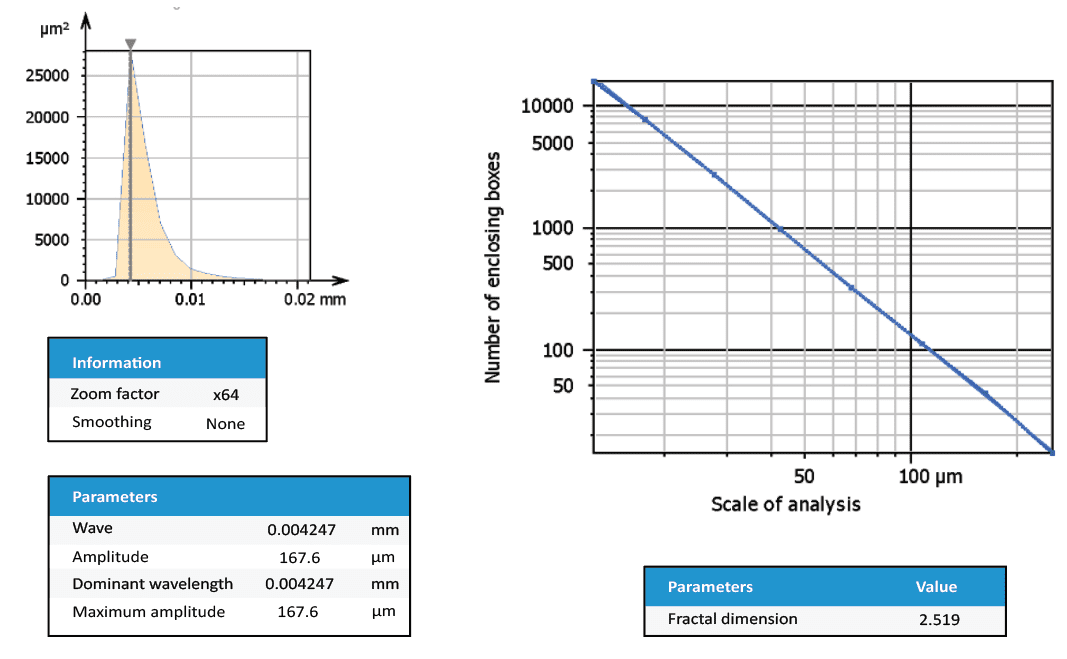

Texture analysis of the dominant wavelength suggests strand size for both composites are 4.27 microns thick. Fractal dimension analysis of the fiber surface determines smoothness to find how easily fibers will set in a matrix. The fractal dimension of the unidirectional fiber is higher than the bidirectional fiber which may affect the processing of composites.
Conclusion
In this application, we have shown the Nanovea HS2000L Non-Contact Profilometer precisely characterizes the fibrous surface of composite materials. We distinguished differences between weave types of carbon fiber with height parameters, isotropy, texture analysis, and distance measurements along with much more.
Our profilometer surface measurements precisely and quickly mitigate composite damage which decreases defects in parts, maximizing composite material capability. Nanovea’s 3D profilometer speed ranges from <1mm/s to 500mm/s for suitability in research applications to the needs of high-speed inspection. The Nanovea profilometer is the solution
to any composite measurement need.

Biological Tissue Hardness Evaluation using Nanoindentation
Traditional mechanical tests (hardness, adhesion, compression, puncture, yield strength, etc.) require greater precision and reliability in today’s quality control environments with a wide range of advanced materials from tissues to brittle materials. Traditional mechanical instrumentation fails to provide the sensitive load control and resolution required for advanced materials. The challenges associated with biomaterials require developing mechanical tests capable of accurate load control on extremely soft materials. These materials require very low sub mN testing loads with large depth range to ensure proper property measurement. In addition, many different mechanical test types can be performed on a single system allowing for greater functionality. This provides a range of important measurements on biomaterials including hardness, elastic modulus, loss and storage modulus, and creep in addition to scratch resistance and yield strength failure points.
Measurement Objective
In this application Nanovea’s mechanical tester in nanoindentation mode is used to study the hardness and elastic modulus of 3 separate areas of a biomaterial substitute on fat, light meat, and dark meat regions of prosciutto.
Nanoindentation is based on instrumented indentation standards ASTM E2546 and ISO 14577. It uses established methods where an indenter tip of known geometry is driven into a specific site of the test material with a controlled increasing normal load. When reaching a pre-set maximum depth, normal load is reduced until complete relaxation occurs. Load is applied by a piezo actuator and measured in a controlled loop with a high sensitivity load cell. During experiments the indenter position relative to the sample surface is monitored with a high precision capacitive sensor. The resulting load and displacement curves provide data specific to the mechanical nature of the tested material. Established models calculate quantitative hardness and modulus values with the measured data. Nanoindentation is suited to low load and penetration depth measurements at nanometer scales.
Results and Discussion
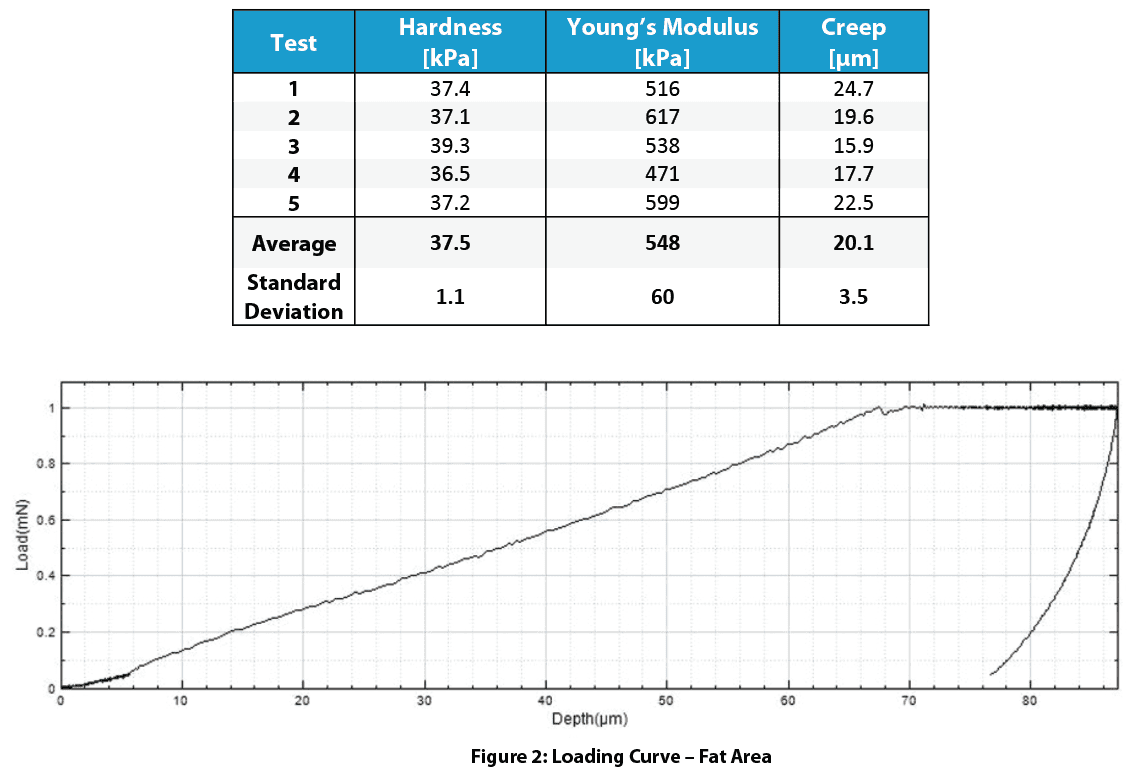
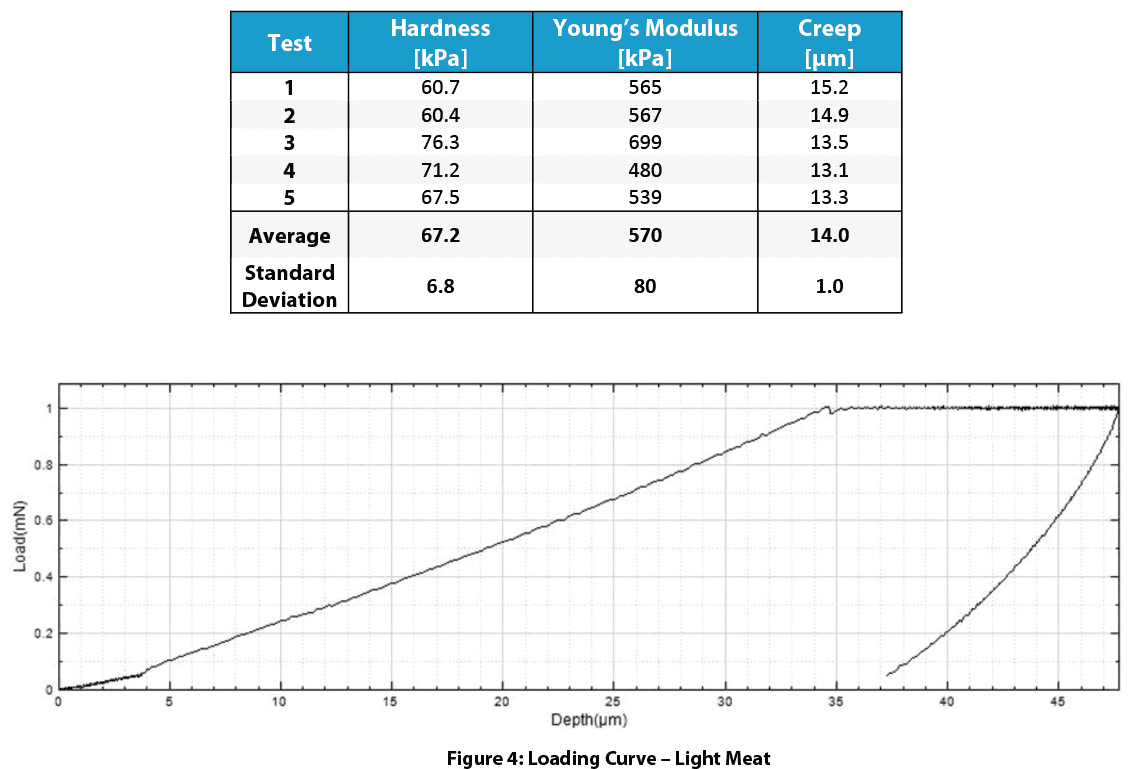
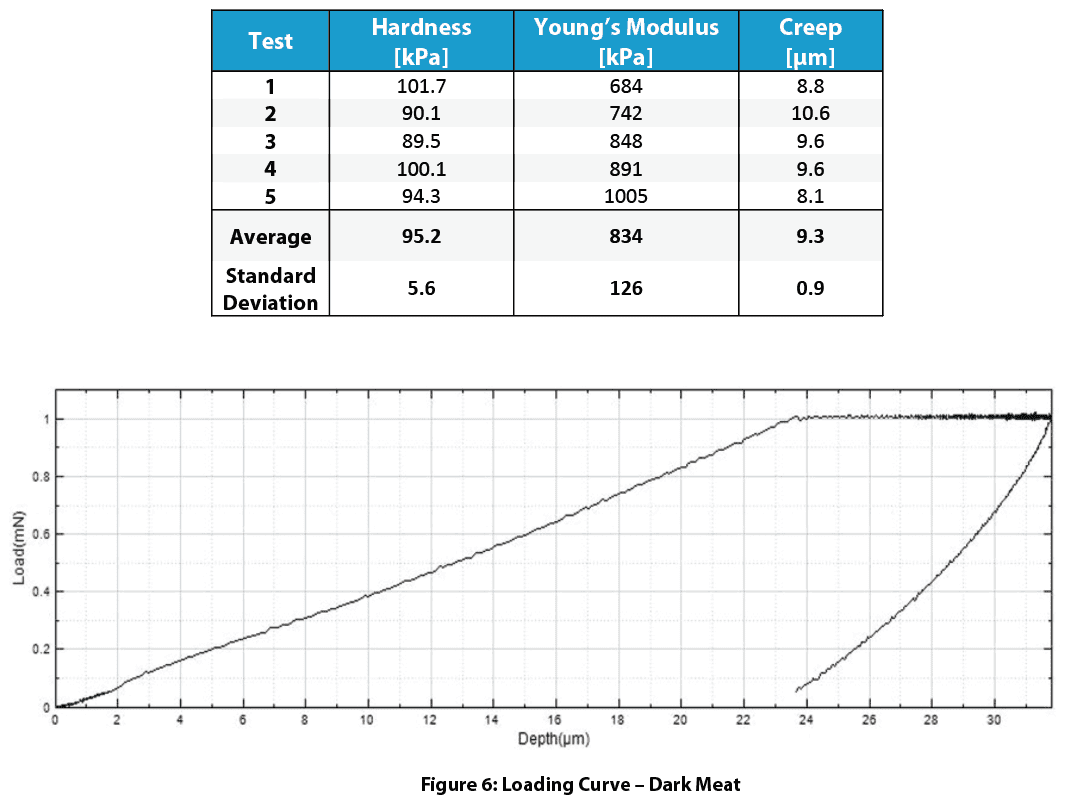
These tables below present measured values of hardness and Young’s modulus with averages and standard deviations. High surface roughness may cause large variations in the results due to small indentation size.
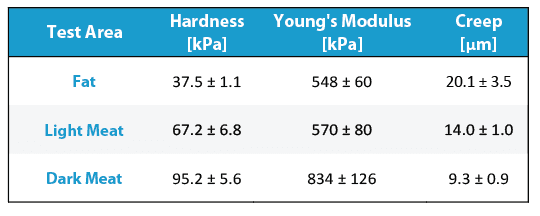
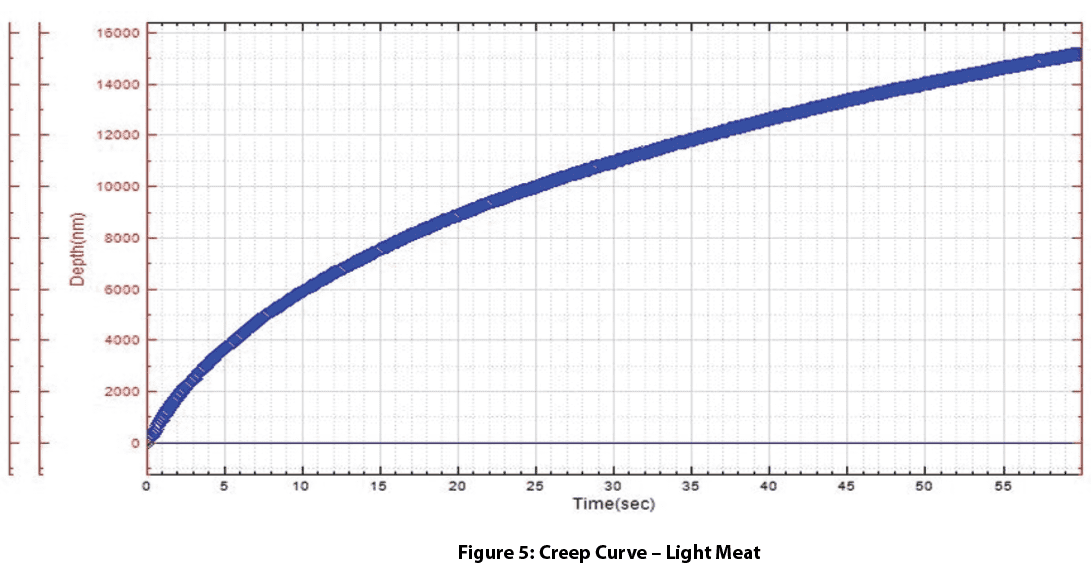
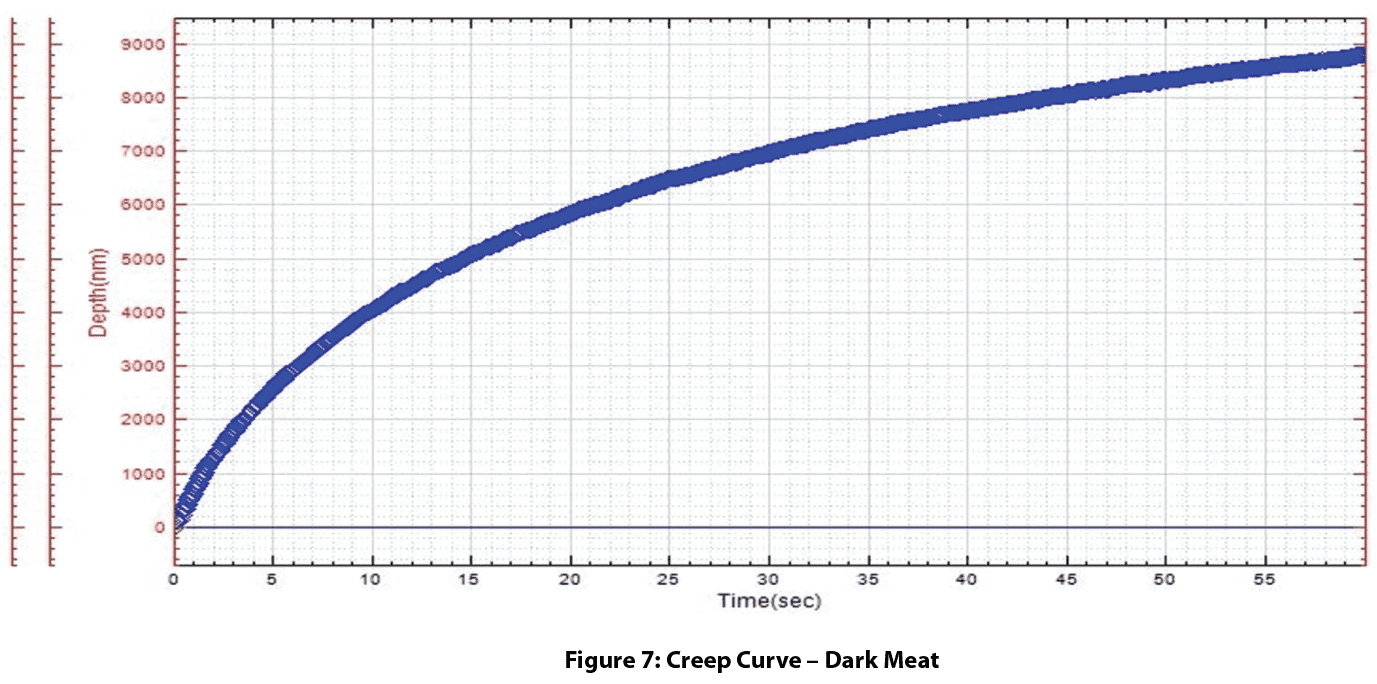
The fat area had about half the hardness of the meat areas. Meat treatment caused the darker meat area to be harder than the light meat area. Elastic modulus and hardness are in direct relation to mouth feel chewiness of the fat and meat areas. The fat and light meat area have creep continuing at a higher rate than the dark meat after 60 seconds.
Detailed Results – Fat

Detailed Results – Light Meat
Detailed Results – Dark Meat
Conclusion

In this application, Nanovea’s mechanical tester in nanoindentation mode reliably determined mechanical properties of the fat and meat areas while overcoming high sample surface roughness. This demonstrated the wide and unmatched capability of Nanovea’s mechanical tester. The system simultaneously provides precise mechanical property measurements on extremely hard materials and soft biological tissues.
The load cell in closed loop control with the piezo table ensures precise measurement of hard or soft gel materials from 1 to 5kPa. Using the same system, it is possible to test biomaterials at higher loads up to 400N. Multi-cycle loading can be used for fatigue testing and yield strength information in each zone can be obtained using a flat cylindrical diamond tip. In addition, with Dynamic Mechanical Analysis (DMA), the viscoelastic properties loss and storage moduli can be evaluated with high accuracy using the closed loop load control. Tests at various temperatures and under liquids are also available on the same system.
Nanovea’s mechanical tester continues to be the superior tool for biological and soft polymer/gel applications.
Wear and Scratch Evaluation of Surface Treated Copper Wire


Importance of Wear and Scratch Evaluation of Copper Wire
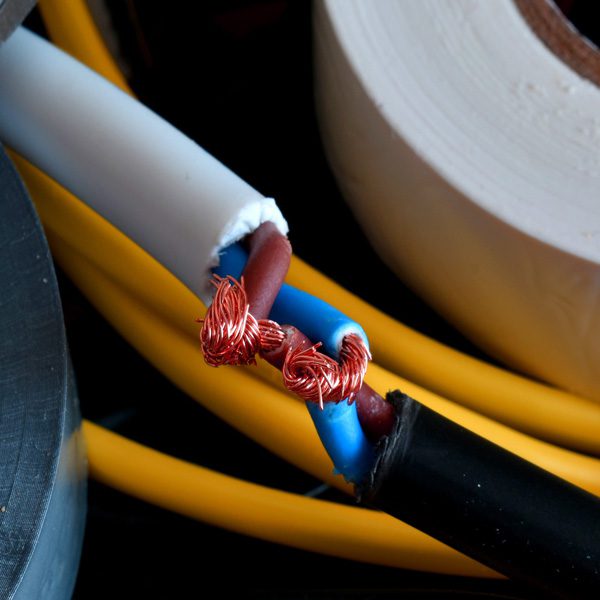
Copper has a long history of use in electric wiring since the invention of the electromagnet and telegraph. Copper wires are applied in a wide range of electronic equipment such as panels, meters, computers, business machines, and appliances thanks to its corrosion resistance, solderability, and performance at elevated temperatures up to 150°C. Approximately half of all mined copper is used for manufacturing electrical wire and cable conductors.
Copper wire surface quality is critical to application service performance and lifetime. Micro defects in wires may lead to excessive wear, crack initiation and propagation, decreased conductivity, and inadequate solderability. Proper surface treatment of copper wires removes surface defects generated during wire drawing improving corrosion, scratch, and wear resistance. Many aerospace applications with copper wires require controlled behavior to prevent unexpected equipment failure. Quantifiable and reliable measurements are needed to properly evaluate the wear and scratch resistance of the copper wire surface.
Measurement Objective
In this application we simulate a controlled wear process of different copper wire surface treatments. Scratch testing measures the load required to cause failure on the treated surface layer. This study showcases the Nanovea Tribometer and Mechanical Tester as ideal tools for evaluation and quality control of electric wires.
Test Procedure and Procedures
Coefficient of friction (COF) and wear resistance of two different surface treatments on copper wires (Wire A and Wire B) were evaluated by the Nanovea tribometer using a linear reciprocating wear module. An Al₂O₃ ball (6 mm diameter) is the counter material used in this application. The wear track was examined using Nanovea’s 3D non-contact profilometer. Test parameters are summarized in Table 1.
A smooth Al₂O₃ ball as a counter material was used as an example in this study. Any solid material with different shape and surface finish can be applied using a custom fixture to simulate the actual application situation.

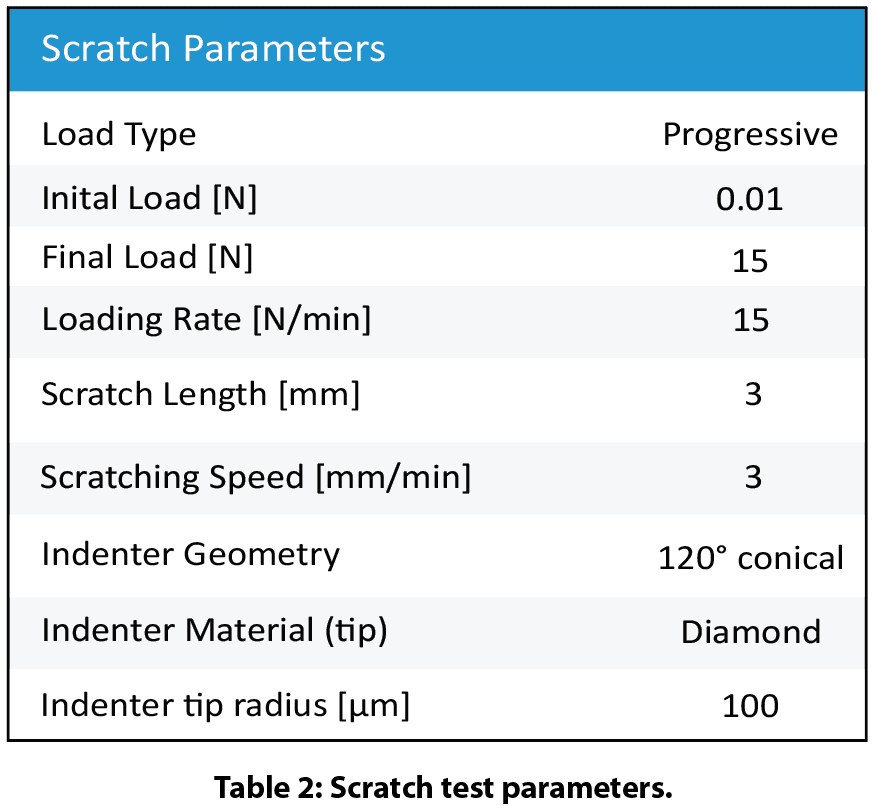
Nanovea’s mechanical tester equipped with a Rockwell C diamond stylus (100 μm radius) performed progressive load scratch tests on the coated wires using micro scratch mode. Scratch test parameters and tip geometry are shown in Table 2.
Results and Discussion
Wear of copper wire:
Figure 2 shows COF evolution of the copper wires during wear tests. Wire A shows a stable COF of ~0.4 throughout the wear test while wire B exhibits a COF of ~0.35 in the first 100 revolutions and progressively increases to ~0.4.
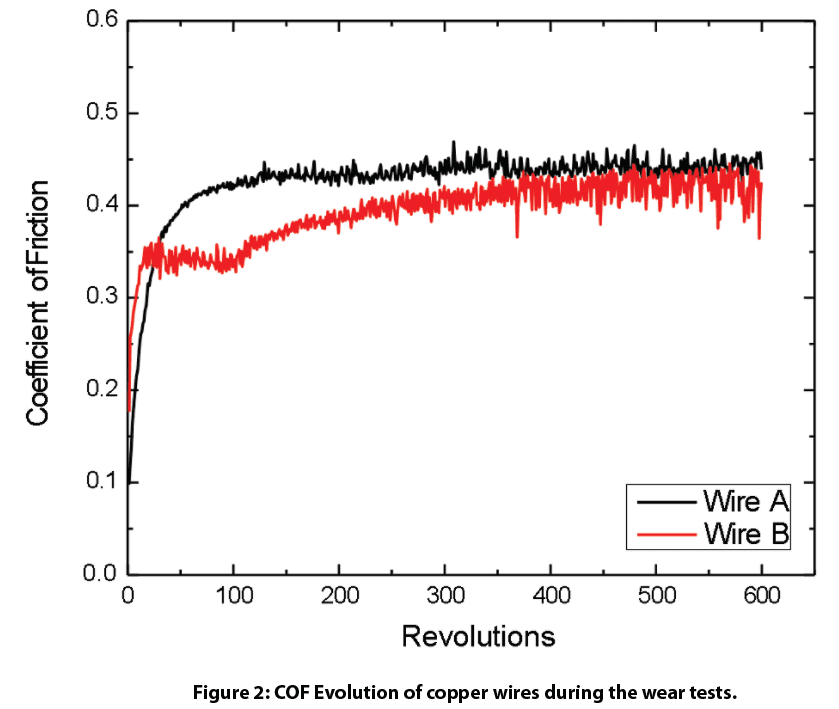
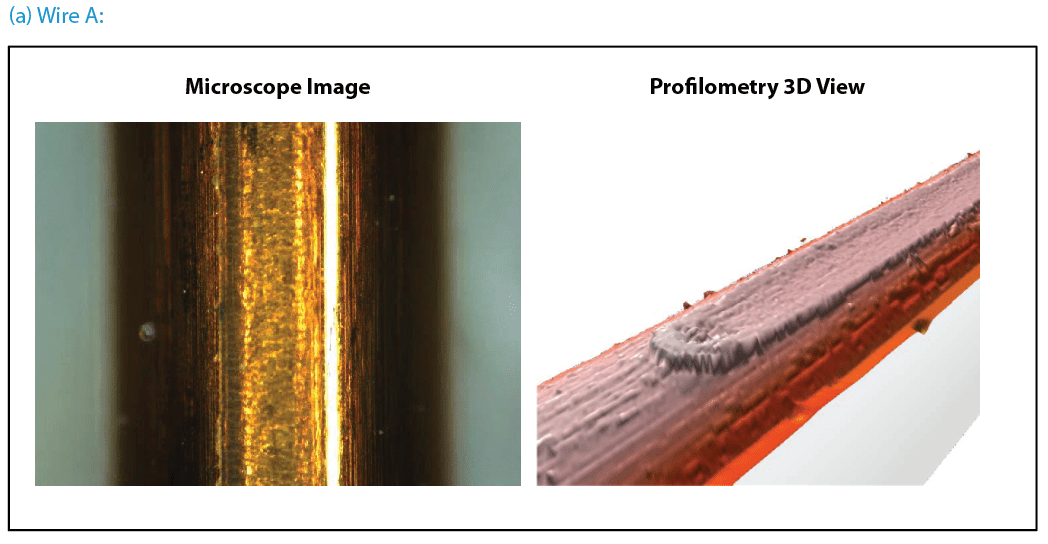
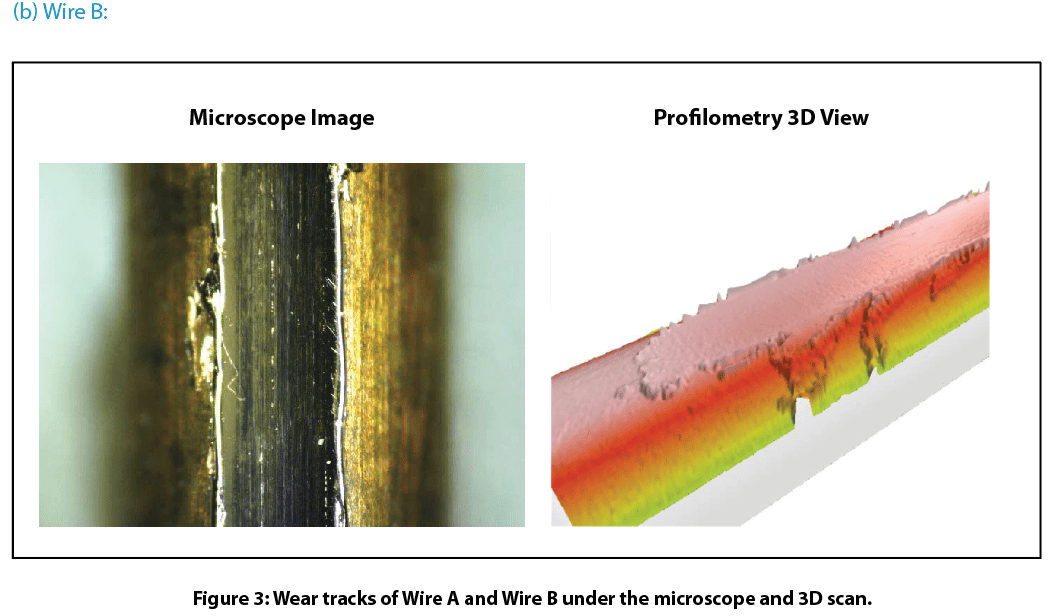
Figure 3 compares wear tracks of the copper wires after tests. Nanovea’s 3D non-contact profilometer offered superior analysis of the detailed morphology of wear tracks. It allows direct and accurate determination of the wear track volume by providing a fundamental understanding of the wear mechanism. Wire B’s surface has signi¬ficant wear track damage after a 600-revolution wear test. The profilometer 3D view shows the surface treated layer of Wire B removed completely which substantially accelerated the wear process. This left a flattened wear track on Wire B where copper substrate is exposed. This may result in significantly shortened lifespan of electrical equipment where Wire B is used. In comparison, Wire A exhibits relatively mild wear shown by a shallow wear track on the surface. The surface treated layer on Wire A did not remove like the layer on Wire B under the same conditions.
Scratch resistance of the copper wire surface:
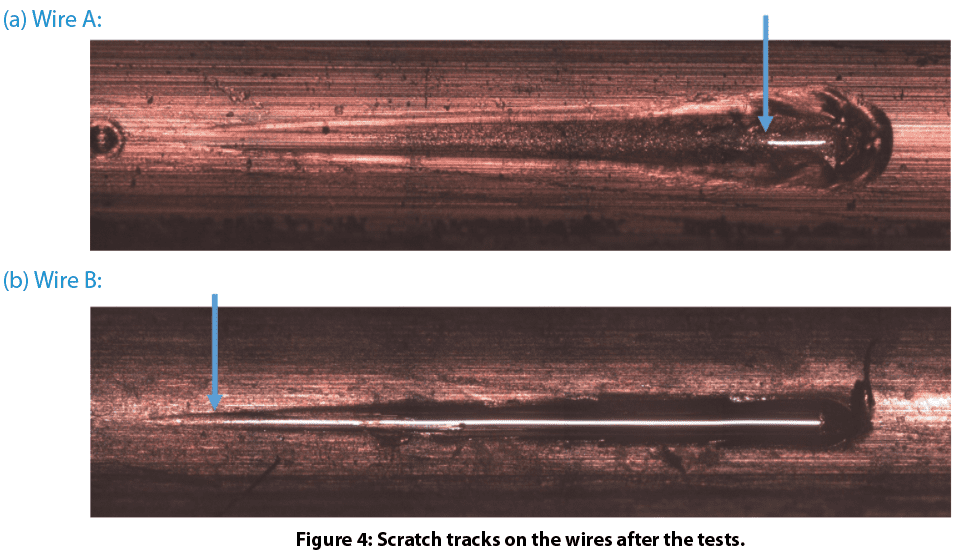
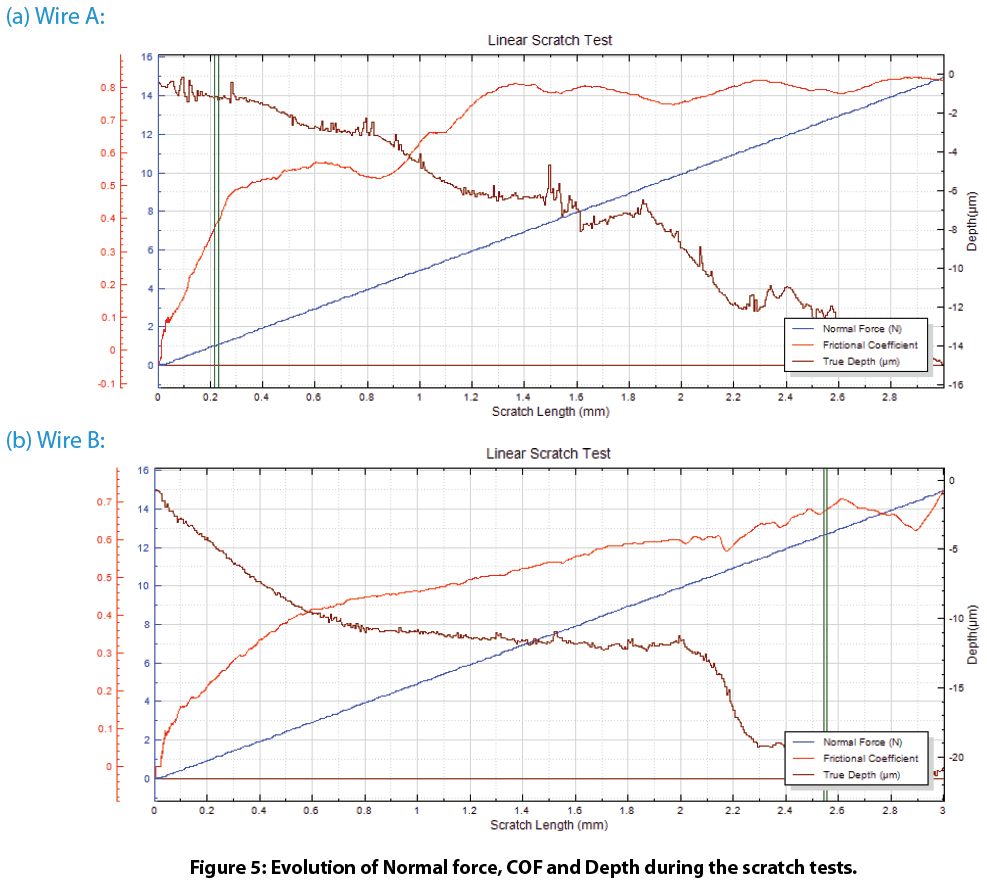
Figure 4 shows the scratch tracks on the wires after testing. The protective layer of Wire A exhibits very good scratch resistance. It delaminates at a load of ~12.6 N. In comparison, the protective layer of Wire B failed at a load of ~1.0 N. Such a significant difference in scratch resistance for these wires contributes to their wear performance, where Wire A possesses substantially enhanced wear resistance. The evolution of normal force, COF, and depth during the scratch tests shown in Fig. 5 provides more insight on coating failure during tests.
Conclusion

In this controlled study we showcased the Nanovea’s tribometer conducting quantitative evaluation of wear resistance for surface treated copper wires and Nanovea’s mechanical tester providing reliable assessment of copper wire scratch resistance. Wire surface treatment plays a critical role in the tribo-mechanical properties during their lifetime. Proper surface treatment on Wire A significantly enhanced wear and scratch resistance, critical in the performance and lifespan of electrical wires in rough environments.
Nanovea’s tribometer offers precise and repeatable wear and friction testing using ISO and ASTM compliant rotative and linear modes, with optional high temperature wear, lubrication, and tribo-corrosion modules available in one pre-integrated system. Nanovea’s unmatched range is an ideal solution for determining the full range of tribological properties of thin or thick, soft or hard coatings, films, and substrates.


