Monthly Archives: March 2020

Yield and Tensile Strength of Steel and Aluminum


Traditionally Yield Strength and Ultimate Tensile Strength have been tested using a large tensile testing machine requiring enormous strength to pull apart test specimens. It is costly and time-consuming to properly machine many test coupons for a material where each sample can only be tested once. Small defects in the sample create a noticeable variance in test results. Different configurations and alignments of the tensile testers in the market often result in substantial variations in testing mechanics and outcomes.
Nanovea’s innovative indentation method directly provides Yield Strength and Ultimate Tensile Strength values comparable to values measured by conventional tensile tests. This measurement opens a new realm of testing possibilities for all industries. The simple experimental setup significantly cuts sample preparation time and cost compared to the complex coupon shape required for tensile tests. Multiple measurements on a single sample are possible with a small indentation size. It prevents the influence of defects seen in tensile test coupons created during sample machining. YS and UTS measurements on small samples in localized area allow for mapping and local defect detection in pipelines or auto structures.
Measurement Objective
In this application, the Nanovea Mechanical Tester measures the Yield Strength and Ultimate Tensile Strength of stainless steel SS304 and aluminum Al6061 metal alloy samples. The samples were chosen for their commonly recognized Yield Strength and Ultimate Tensile Strength values showing the reliability of Nanovea’s indentation methods.
Test Procedure and Procedures
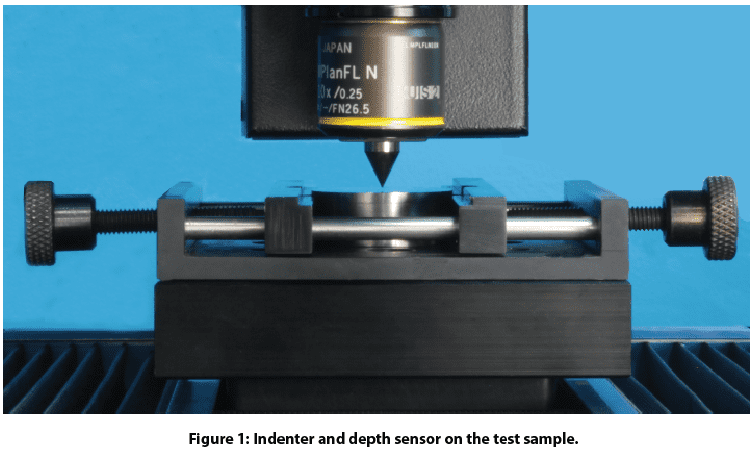
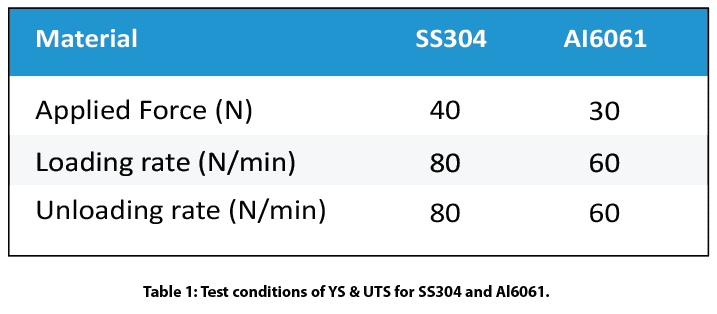
The Yield Strength and Ultimate Tensile Strength tests were performed on the Nanovea Mechanical Tester in the Microindentation mode. A cylindrical flat diamond tip of 200 μm diameter was used for this application. SS304 and Al6061 alloys were selected for their extensive industrial application and commonly recognized Yield Strength and Ultimate Tensile Strength values, in order to show the great potential and reliability of the indentation method. Samples were mechanically polished to a mirror-like finish before testing to avoid surface roughness or defect influence on test results. Test conditions are listed in Table 1. More than ten tests were performed on each sample to ensure the repeatability of the test values.
Results and Discussion
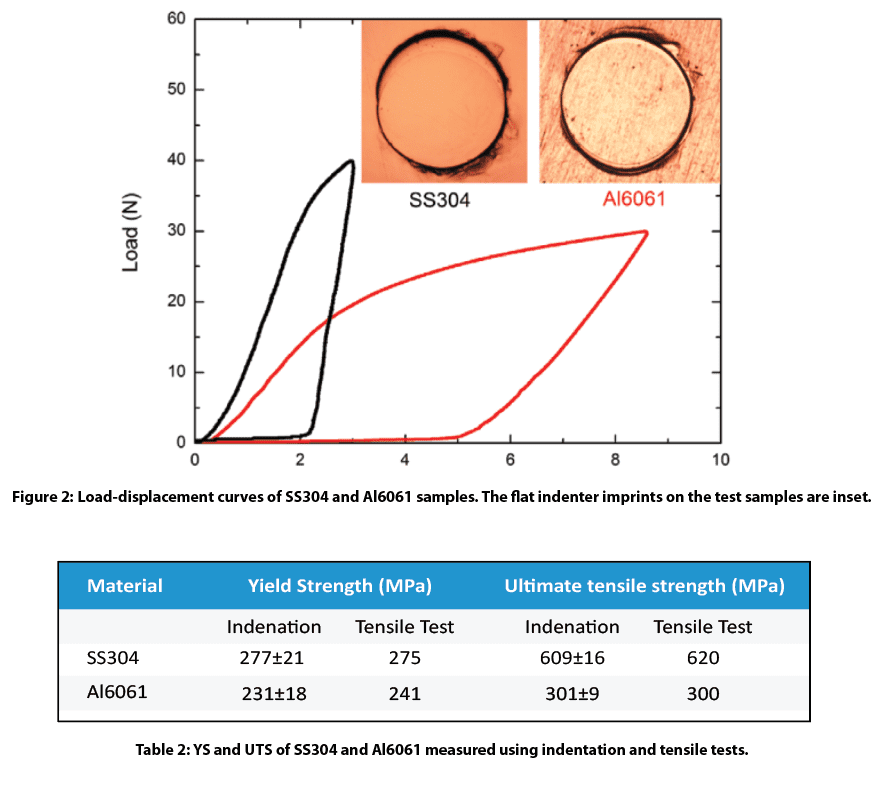
Load-displacement curves of the SS304 and Al6061 alloy samples are shown in Figure 3 with the flat indenter imprints on the test samples inset. Analysis of the “S” shaped loading curve using special algorithms developed by Nanovea calculates Yield Strength and Ultimate Tensile Strength . Values are automatically calculated by the software as summarized in Table 1. Yield Strength and Ultimate Tensile Strength values obtained by conventional tensile tests are listed for comparison.
Conclusion

In this study, we showcased the capacity of Nanovea Mechanical Tester in evaluating Yield Strength & Ultimate Tensile Strength of stainless steel and aluminum alloy sheet samples. The simple experimental setup significantly cuts the time and cost for sample preparation required for tensile tests. The small indentation size makes it possible to perform multiple measurements on one single sample. This method allows YS/UTS measurements on small samples and localized areas, providing a solution for YS/UTS mapping and local defect detection of pipelines or auto structure.
The Nano, Micro or Macro modules of the Nanovea Mechanical Tester all include ISO and ASTM compliant indentation, scratch and wear tester modes, providing the widest and most user friendly range of testing available in a single system. Nanovea’s unmatched range is an ideal solution for determining the full range of mechanical properties of thin or thick, soft or hard coatings, films and substrates, including hardness, Young’s modulus, fracture toughness, adhesion, wear resistance and many others. In addition, optional 3D non-contact profiler and AFM Module are available for high resolution 3D imaging of indentation, scratch and wear track in addition to other surface measurements such as roughness.
Dynamic Load Tribology
Introduction
Wear takes place in virtually every industrial sector and imposes costs of ~0.75% of the GDP1. Tribology research is vital in improving production efficiency, application performance, as well as conservation of material, energy, and the environment. Vibration and oscillation inevitably occur in a wide range of tribological applications. Excessive external vibration accelerates the wear process and reduces service performance which leads to catastrophic failures to the mechanical parts.
Conventional dead load tribometers apply normal loads by mass weights. Such a loading technique not only limits the loading options to a constant load, but it also creates intense uncontrolled vibrations at high loads and speeds leading to limited and inconsistent wear behavior assessments. A reliable evaluation of the effect of controlled oscillation on the wear behavior of materials is desirable for R&D and QC in different industrial applications.
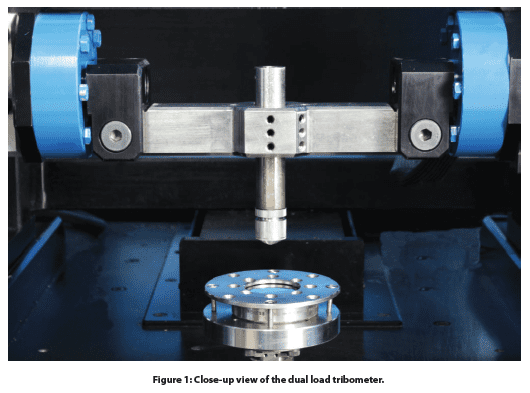
Nanovea’s groundbreaking high load tribometer has a maximum load capacity of 2000 N with a dynamic load control system. The advanced pneumatic compressed air loading system enables users to evaluate the tribological behavior of a material under high normal loads with the advantage of damping undesired vibration created during the wear process. Therefore, the load is measured directly with no need for buffer springs used in older designs. A parallel electromagnet oscillating loading module applies well-controlled oscillation of desired amplitude up to 20 N and frequency up to 150 Hz.
Friction is measured with high accuracy directly from the side force applied to the upper holder. The displacement is monitored in situ, providing insight into the evolution of the wear behavior of the test samples. The wear test under controlled oscillation loading can also be performed in corrosion, high temperature, humidity, and lubrication environments to simulate the real work conditions for the tribological applications. An integrated high-speed non-contact profilometer automatically measures the wear track morphology and wear volume in a few seconds.
Measurement Objective
In this study, we showcase the capacity of the Nanovea T2000 Dynamic Load Tribometer in studying the tribological behavior of different coating and metal samples under controlled oscillation loading conditions.
Test Procedure
The tribological behavior, e.g. coefficient of friction, COF, and wear resistance of a 300 µm thick wear-resistant coating was assessed and compared by the Nanovea T2000 Tribometer with a conventional dead load tribometer using a pin on disk setup following ASTM G992.
Separate Cu and TiN coated samples against a 6 mm Al₂0₃ ball under controlled oscillation were evaluated by Dynamic Load Tribology Mode of the Nanovea T2000 Tribometer.
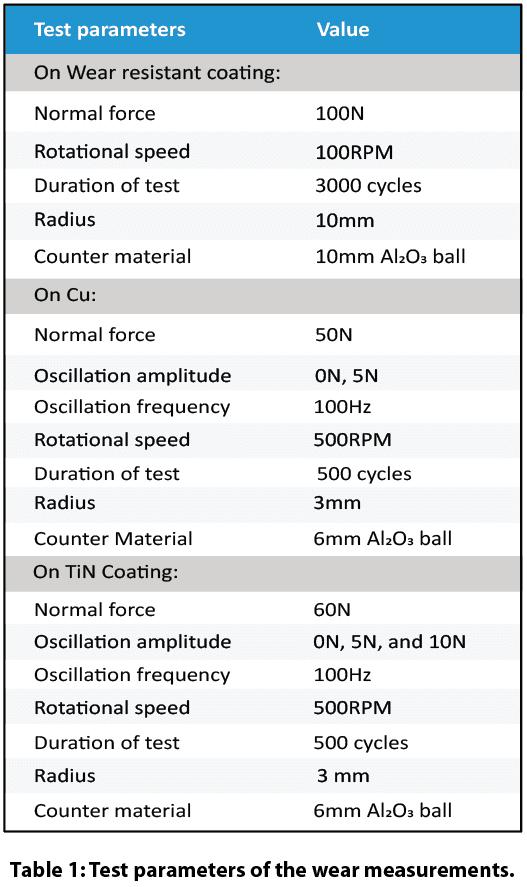
The test parameters are summarized in Table 1.
The integrated 3D profilometer equipped with a line sensor automatically scans the wear track after the tests, providing the most accurate wear volume measurement in seconds.
Results and Discussion
Pneumatic loading system vs. Dead load system
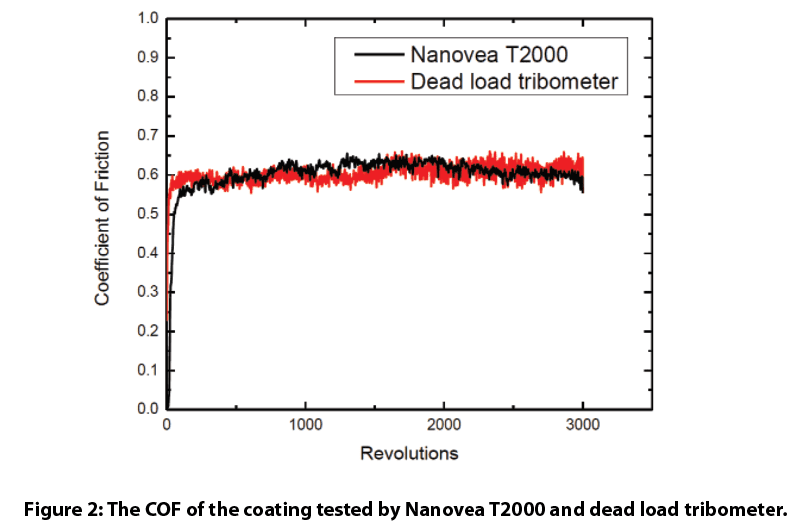
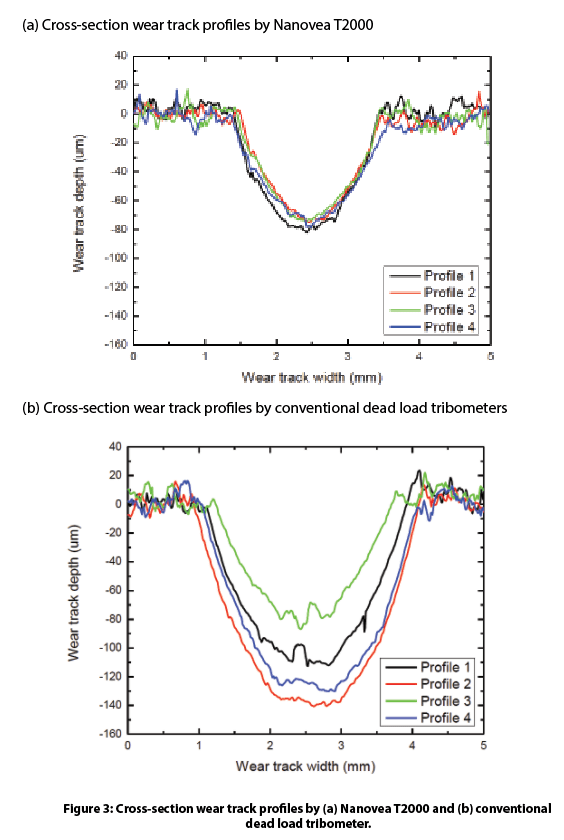
The tribological behavior of a wear-resistant coating using Nanovea T2000 Tribometer is compared to a conventional dead load (DL) tribometer. The evolution of the COF of the coating are shown in Fig. 2. We observe the coating exhibits a comparable COF value of ~0.6 during the wear test. However, the 20 cross-section profiles at different locations of the wear track in Fig. 3 indicate that the coating experienced much more severe wear under the dead load system.
Intense vibrations were generated by the wear process of the dead load system at high load and speed. The massive concentrated pressure at the contact face combined with a high sliding speed creates substantial weight and structure vibration leading to accelerated wear. The conventional dead load tribometer applies load using mass weights. This method is reliable at lower contact loads under mild wear conditions; however, under aggressive wear conditions at higher loads and speeds, the significant vibration causes the weights to bounce repeatedly, resulting in an uneven wear track causing unreliable tribological evaluation. The calculated wear rate is 8.0±2.4 x 10⁻⁴ mm3/N m, showing a high wear rate and large standard deviation.
The Nanovea T2000 tribometer is designed with a dynamic control loading system to dampen the oscillations. It applies the normal load with compressed air which minimizes undesired vibration created during the wear process. In addition, active closed loop loading control ensures a constant load is applied throughout the wear test and the stylus follows the depth change of the wear track. A significantly more consistent wear track profile is measured as shown in Fig. 3a, resulting in a low wear rate of 3.4±0.5 x 10⁻⁴ mm3/N m.
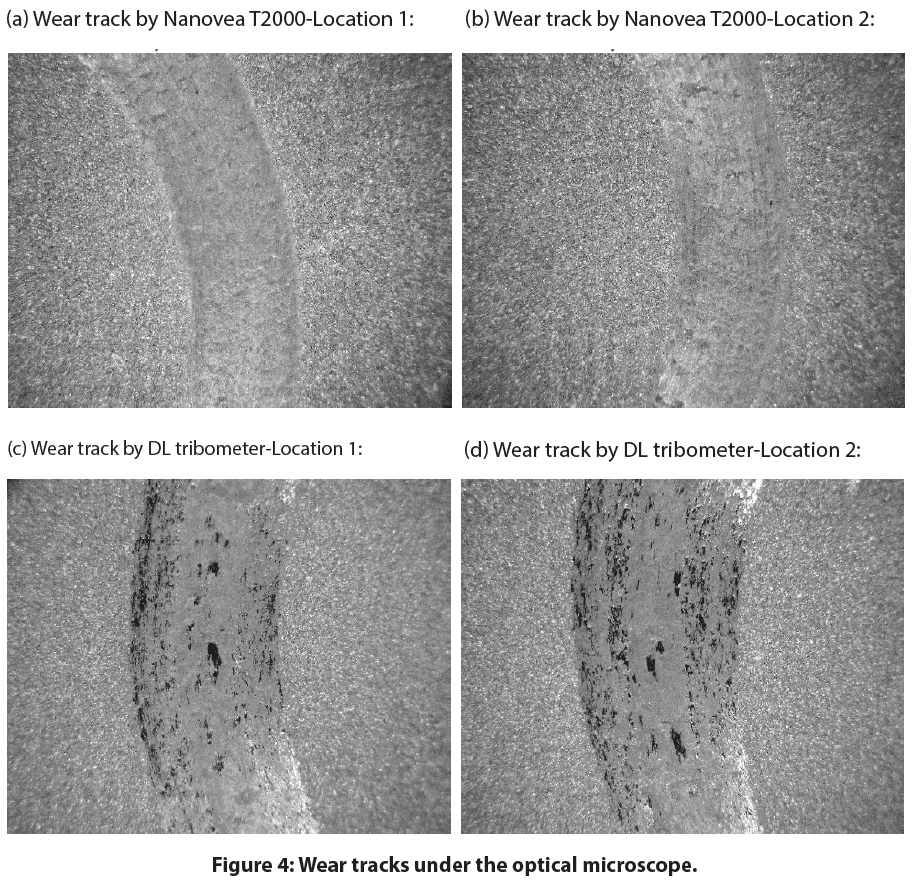
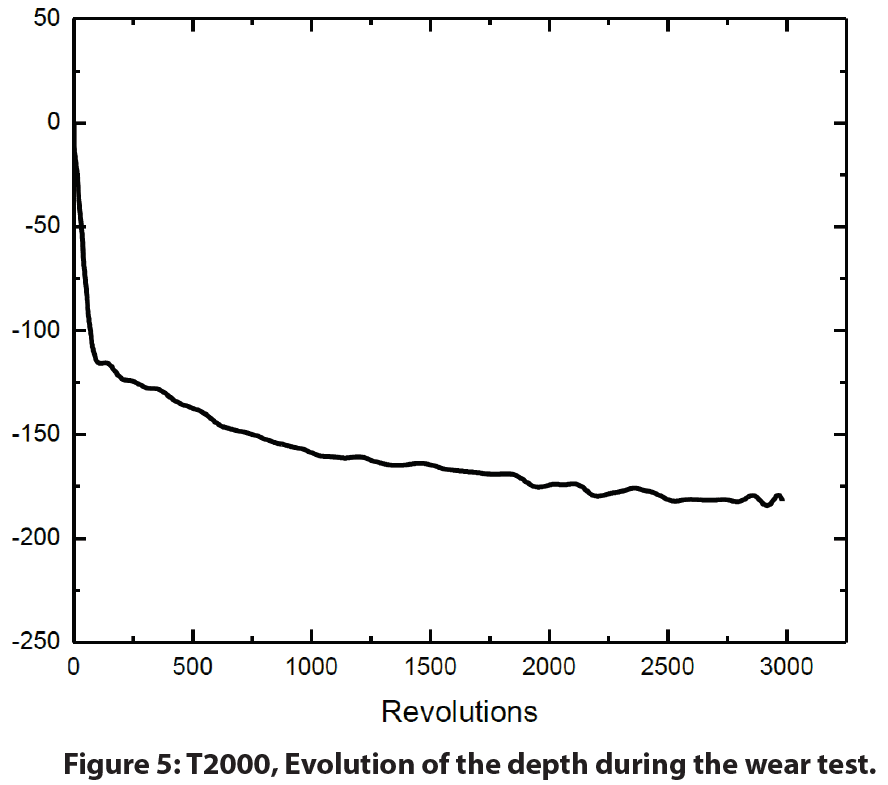
The wear track analysis shown in Fig. 4 confirms the wear test performed by the pneumatic compressed air loading system of the Nanovea T2000 Tribometer creates a smoother and more consistent wear track compared to the conventional dead load tribometer. In addition, the Nanovea T2000 tribometer measures stylus displacement during the wear process providing further insight into the progress of the wear behavior in situ.
Controlled Oscillation on Wear of the Cu sample
The parallel oscillating loading electromagnet module of the Nanovea T2000 Tribometer enables users to investigate the effect of controlled amplitude and frequency oscillations on the wear behavior of materials. The COF of the Cu samples is recorded in situ as shown in Fig. 6. The Cu sample exhibits a constant COF of ~0.3 during the first 330-revolution measurement, signifying the formation of a stable contact at the interface and relatively smooth wear track. As the wear test continues, the variation of the COF indicates a change in the wear mechanism. In comparison, the wear tests under a 5 N amplitude-controlled oscillation at 50 N exhibits a different wear behavior: the COF increases promptly at the beginning of the wear process, and shows significant variation throughout the wear test. Such behavior of COF indicates that the imposed oscillation in the normal load plays a role in the unstable sliding state at the contact.
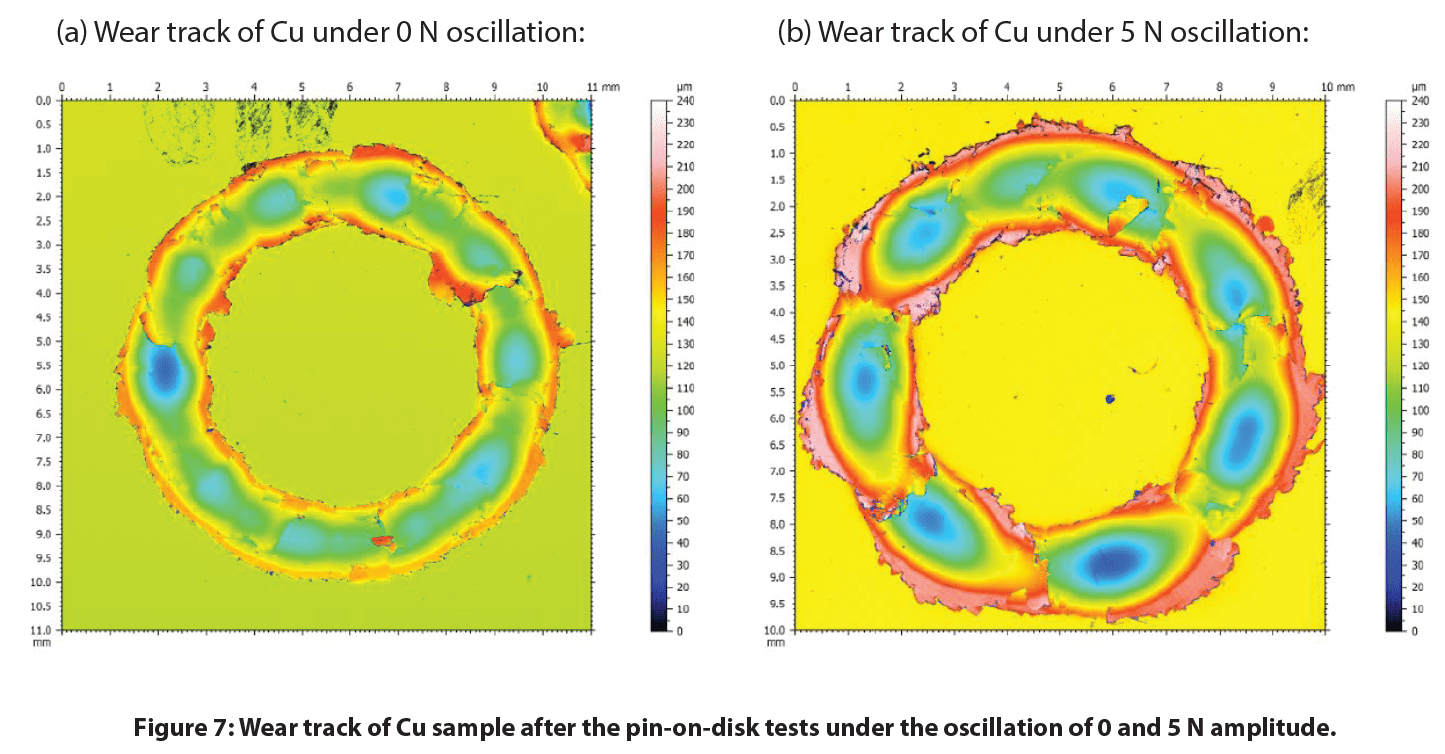
Fig. 7 compares the wear track morphology measured by the integrated non-contact optical profilometer. It can be observed that the Cu sample under a controlled oscillation amplitude of 5 N exhibits a much larger wear track with a volume of 1.35 x 109 µm3, compared to 5.03 x 108 µm3 under no imposed oscillation. The controlled oscillation significantly accelerates the wear rate by a factor of ~2.7, showing the critical effect of oscillation on wear behavior.

Controlled Oscillation on Wear of the TiN Coating
The COF and wear tracks of the TiN coating sample are shown in Fig. 8. The TiN coating exhibits significantly different wear behaviors under oscillation as indicated by the evolution of COF during the tests. The TiN coating shows a constant COF of ~0.3 following the run-in period at the beginning of the wear test, due to the stable sliding contact at the interface between the TiN coating and the Al₂O₃ ball. However, when the TiN coating starts to fail, the Al₂O₃ ball penetrates through the coating and slides against the fresh steel substrate underneath. A significant amount of hard TiN coating debris is generated in the wear track at the same time, turning a stable two-body sliding wear into three-body abrasion wear. Such a change of the material couple characteristics leads to the increased variations in the evolution of COF. The imposed 5 N and 10 N oscillation accelerates the TiN coating failure from ~400 revolutions to below 100 revolutions. The larger wear tracks on the TiN coating samples after the wear tests under the controlled oscillation is in agreement with such a change in COF.

Conclusion
The advanced pneumatic loading system of the Nanovea T2000 Tribometer possesses an intrinsic advantage as a naturally quick vibration damper compared to traditional dead load systems. This technological advantage of pneumatic systems is true compared to load-controlled systems that use a combination of servo motors and springs to apply the load. The technology ensures reliable and better-controlled wear evaluation at high loads as demonstrated in this study. In addition, the active closed loop loading system can change the normal load to a desired value during wear tests to simulate real-life applications seen in brake systems.
Instead of having influence from uncontrolled vibration conditions during tests, we have shown the Nanovea T2000 Dynamic-Load Tribometer enables users to quantitatively assess the tribological behaviors of materials under different controlled oscillation conditions. Vibrations play a significant role in the wear behavior of metal and ceramic coating samples.
The parallel electromagnet oscillating loading module provides precisely controlled oscillations at set amplitudes and frequencies, allowing users to simulate the wear process under real-life conditions when environmental vibrations are often an important factor. In the presence of imposed oscillations during wear, both the Cu and the TiN coating samples exhibit substantially increased wear rate. The evolution of the coefficient of friction and stylus displacement measured in situ are important indicators for the performance of the material during the tribological applications. The integrated 3D non-contact profilometer offers a tool to precisely measure the wear volume and analyze the detailed morphology of the wear tracks in seconds, providing more insight into the fundamental understanding of wear mechanism.
The T2000 is equipped with a self-tuned, high-quality, and high torque motor with a 20-bit internal speed and a 16-bit external position encoder. It enables the tribometer to provide an unmatched range of rotational speeds from 0.01 to 5000 rpm that can change in stepwise jumps or at continuous rates. Contrary to systems that use a bottom located torque sensor, the Nanovea Tribometer uses a top located high-precision load cell to accurately and separately measure friction forces.
Nanovea Tribometers offers precise and repeatable wear and friction testing using ISO and ASTM compliant rotative and linear modes (including 4ball, thrust washer, and block on ring tests), with optional high-temperature wear, lubrication and tribo-corrosion modules available in one pre-integrated system. Nanovea T2000’s unmatched range is an ideal solution for determining the full range of tribological properties of thin or thick, soft or hard coatings, films, and substrates.

Paint Orange Peel Texture Analysis using 3D Profilometry
Introduction
The size and frequency of surface structures on substrates affect the quality of gloss coatings. Paint orange peel texture, named after its appearance, can develop from substrate influence and paint application technique. Texture problems are commonly quantified by waviness, wavelength, and the visual effect they have on gloss coatings. The smallest textures result in gloss reduction while larger textures result in visible ripples on the coated surface. Understanding the development of these textures and its relation to substrates and techniques are critical to quality control.
Importance of Profilometry for Texture Measurement
Unlike traditional 2D instruments used to measure gloss texture, 3D non-contact measurement quickly provides a 3D image used to understand surface characteristics with the added ability to quickly investigate areas of interest. Without speed and 3D review, a quality control environment would solely rely on 2D information that gives little predictability of the entire surface. Understanding textures in 3D allows for the best selection of processing and control measures. Assuring quality control of such parameters heavily relies on quantifiable, reproducible, and reliable inspection. Nanovea 3D Non-Contact Profilometers utilize chromatic confocal technology to have the unique capability to measure the steep angles found during fast measurement. Nanovea Profilometers succeed where other techniques fail to provide reliable data due to probe contact, surface variation, angle, or reflectivity.
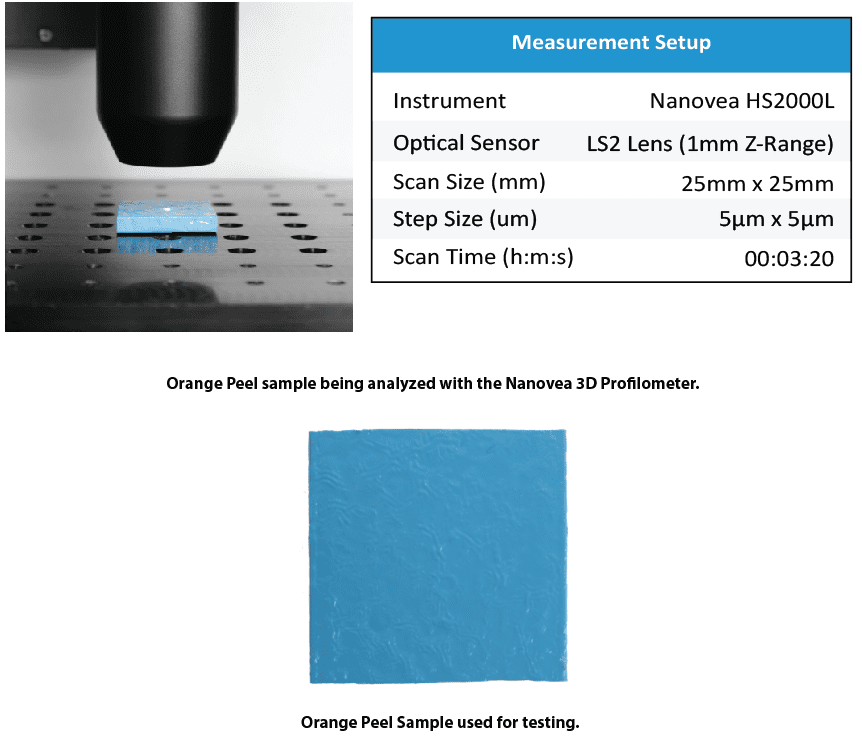
Measurement Objective
In this application, the Nanovea HS2000L measures the paint orange peel texture of a gloss paint. There are endless surface parameters automatically calculated from the 3D surface scan. Here we analyze a scanned 3D surface by quantifying the characteristics of the paint orange peel texture.
Results and Discussion

The Nanovea HS2000L quantified isotropy and height parameters of the orange peel paint. The orange peel texture quantified the random pattern direction with 94.4% isotropy. Height parameters quantify the texture with a 24.84µm height difference.

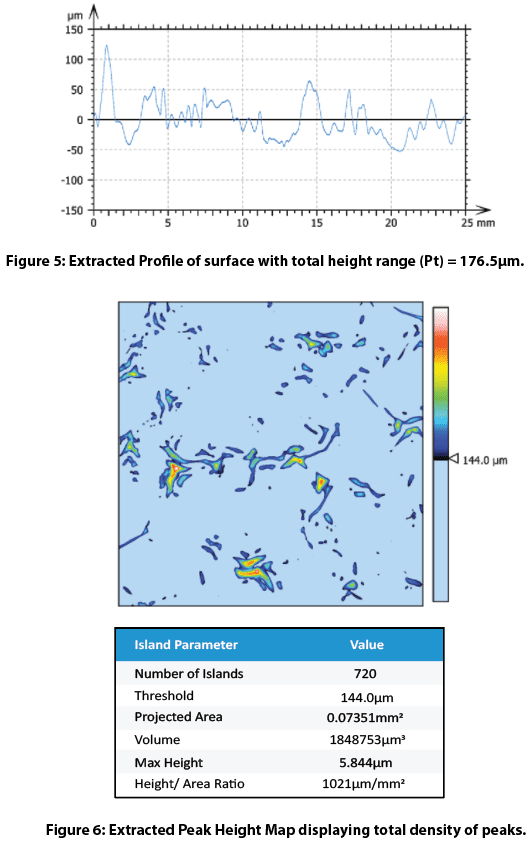
The bearing ratio curve in Figure 4 is a graphical representation of the depth distribution. This is an interactive feature within the software that allows the user to view distributions and percentages at varying depths. An extracted profile in Figure 5 gives useful roughness values for the orange peel texture. Peak extraction above a 144 micron threshold shows the orange peel texture. These parameters are easily adjusted to other areas or parameters of interest.
Conclusion
In this application, the Nanovea HS2000L 3D Non-Contact Profilometer precisely characterizes both topography and nanometer details of the paint orange peel texture on a gloss coating. Areas of interest from 3D surface measurements are quickly identified and analyzed with many useful measurements (Dimension, Roughness Finish Texture, Shape Form Topography, Flatness Warpage Planarity, Volume Area, Step-Height, etc.). Quickly chosen 2D cross-sections provide a complete set of surface measurement resources on gloss texture. Special areas of interest can be further analyzed with an integrated AFM module. Nanovea 3D Profilometer’s speed ranges from <1 mm/s to 500 mm/s for suitability in research applications to the needs of high-speed inspection. Nanovea 3D Profilometers have a wide range of configurations to suit your application.


