Understanding Scratch Resistance in Phone Screen Protectors
Protective coatings on phone screens play a critical role in scratch resistance, adhesion strength, and long-term durability. Over time, scratches, micro-cracks, and coating delamination can reduce optical clarity and reliability — especially in high-use environments. To evaluate how different screen protectors resist mechanical damage, instrumented scratch testing provides quantifiable insight into coating failure mechanisms, including adhesion, cohesion, and fracture behavior.
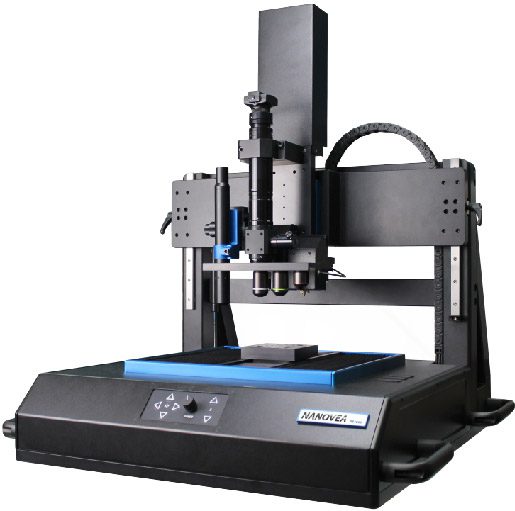
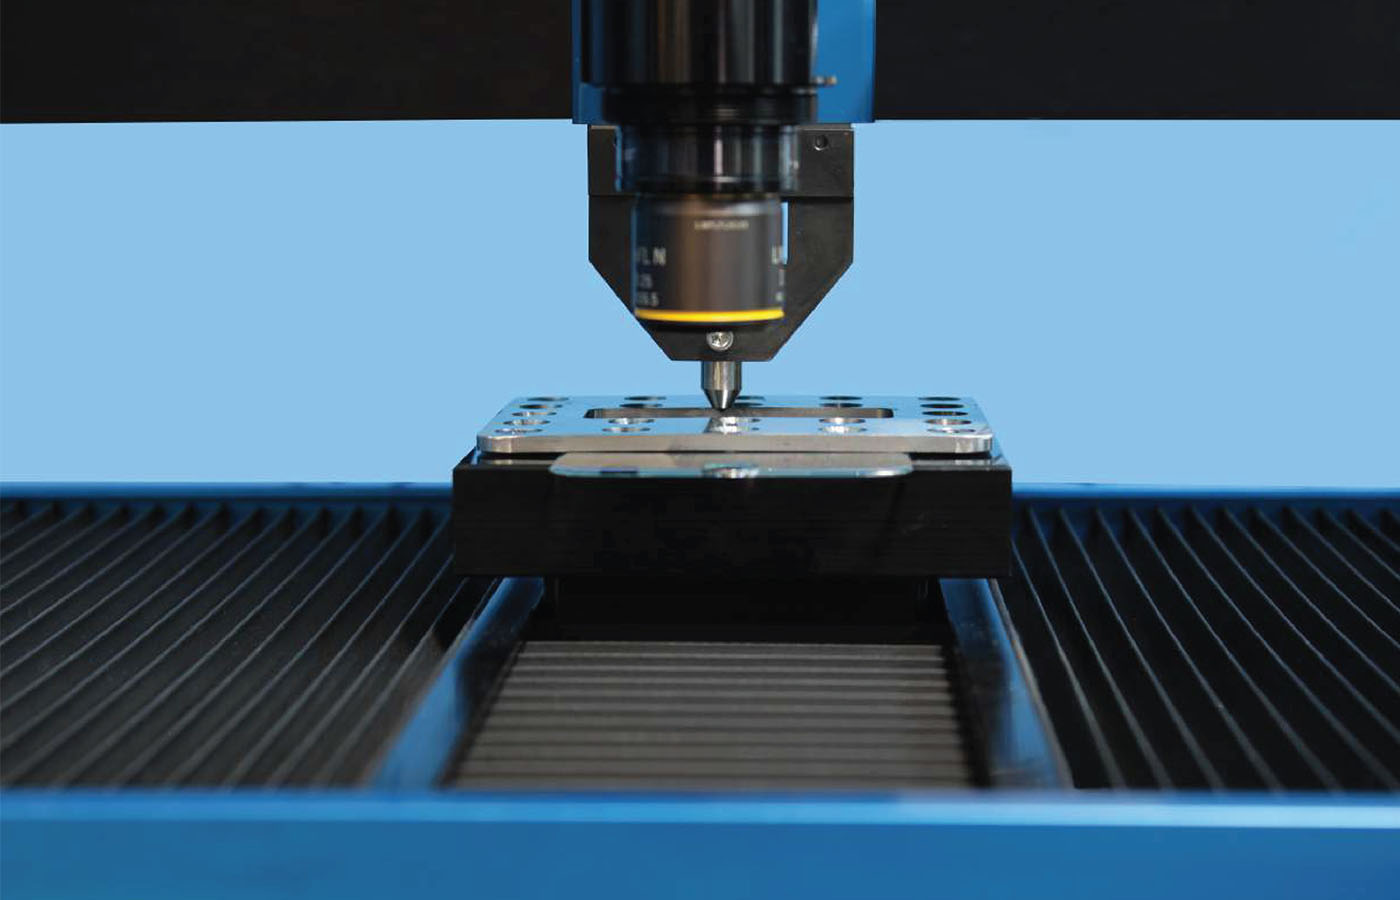
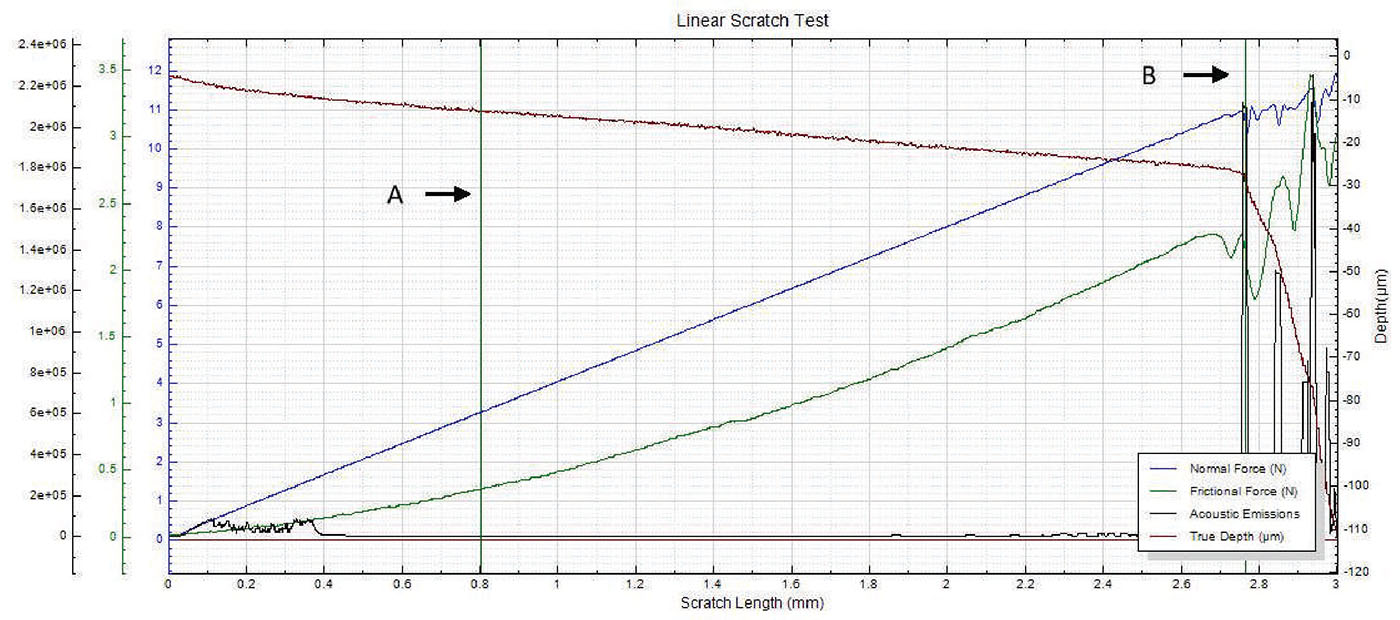
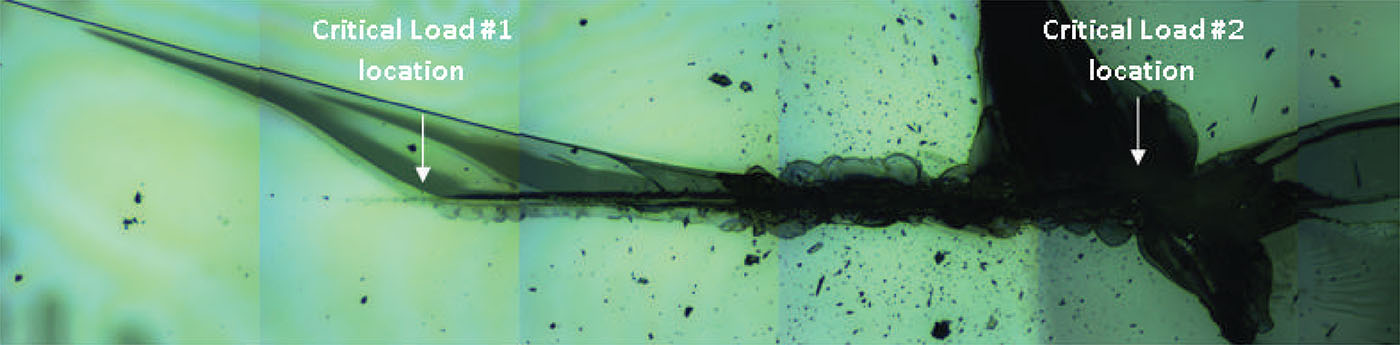
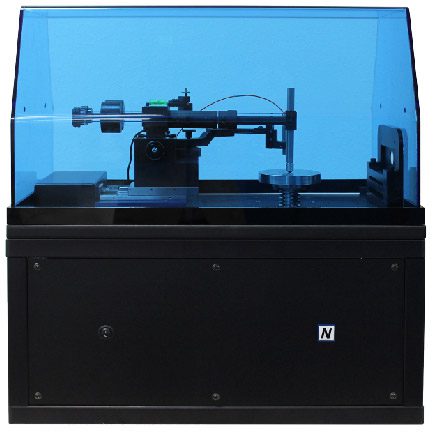
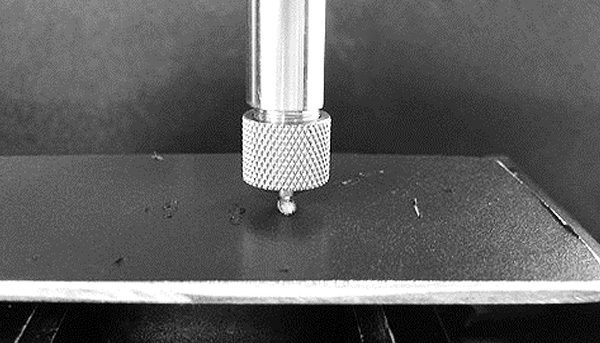
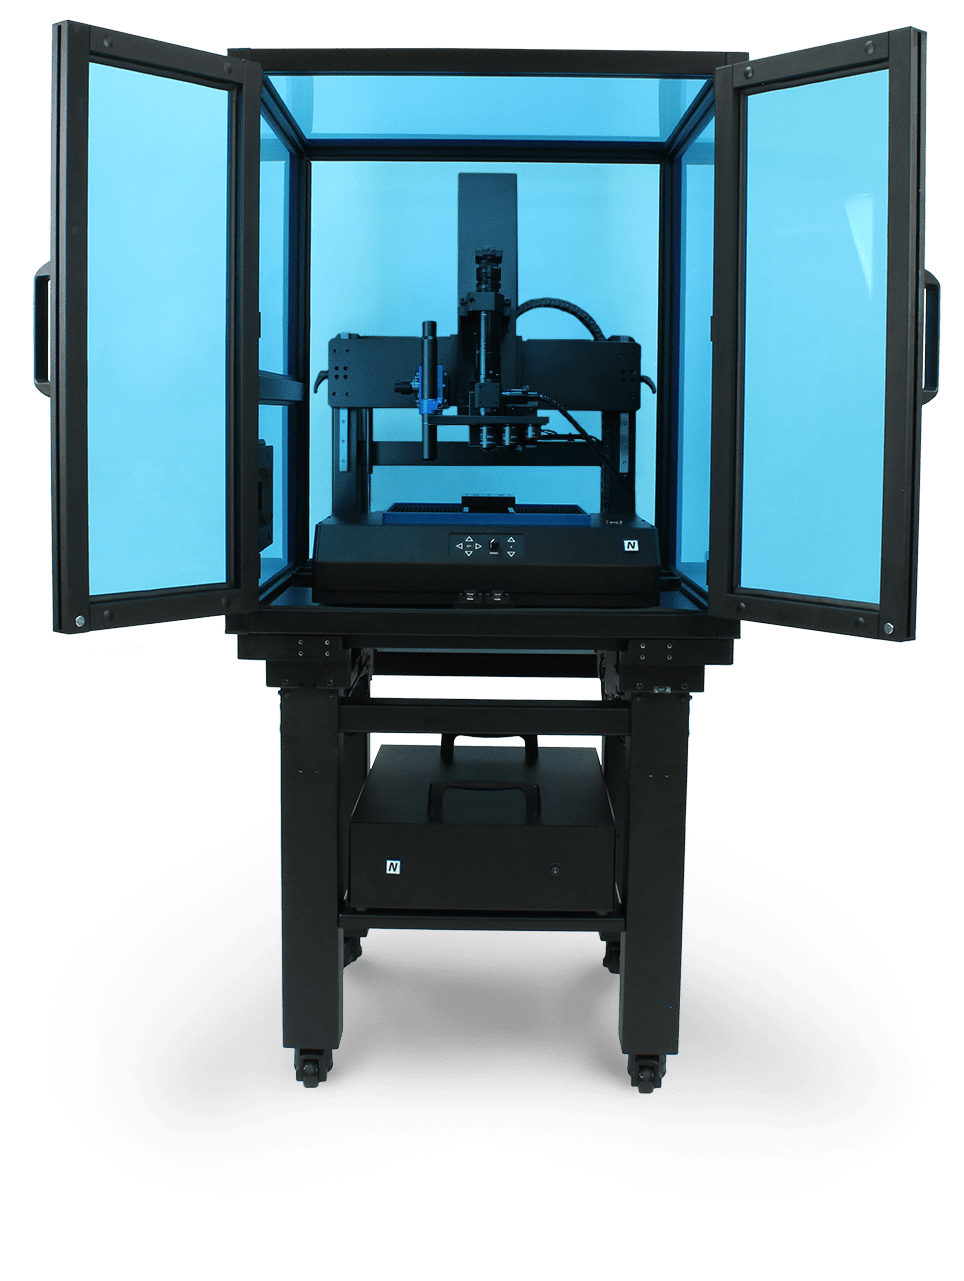
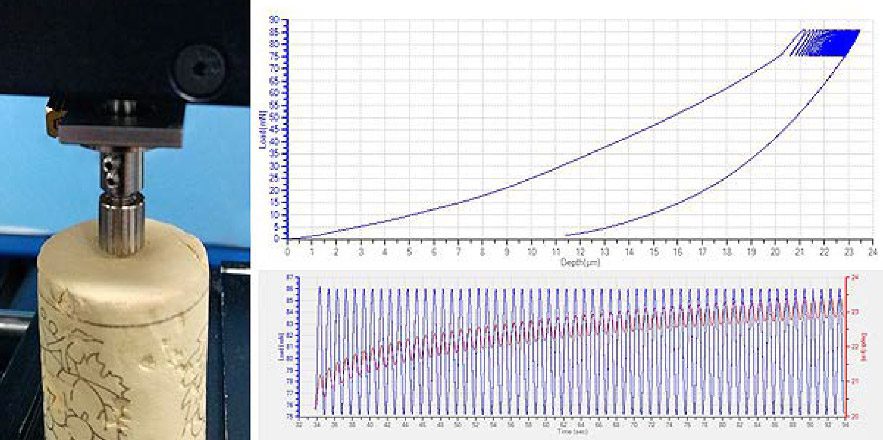
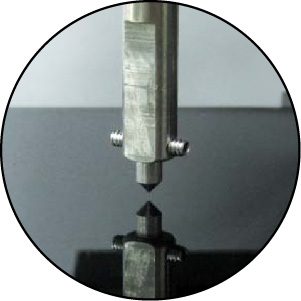
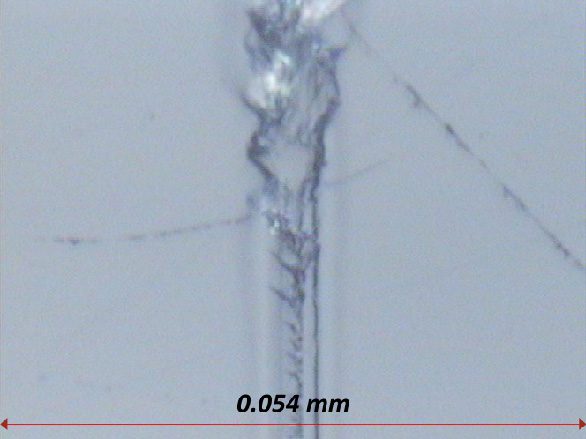
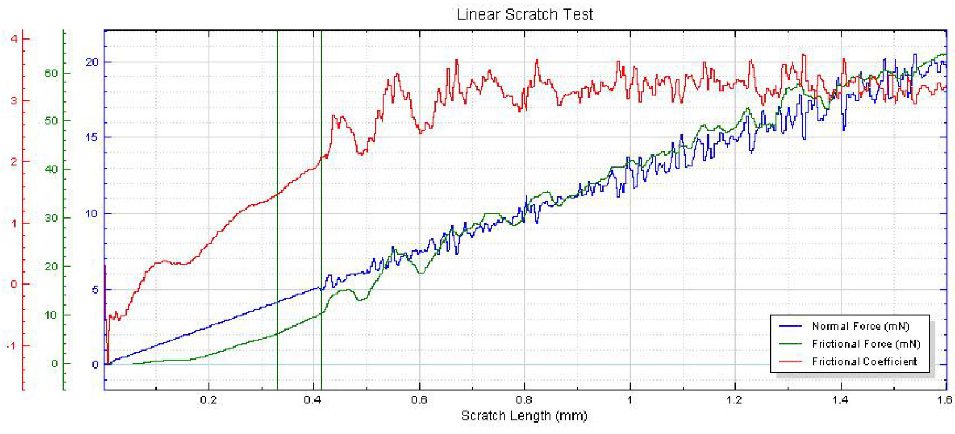
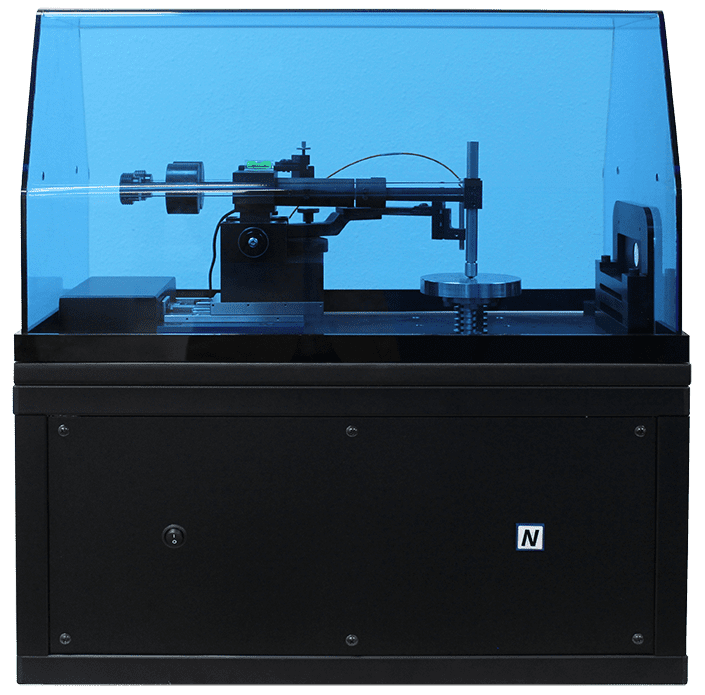
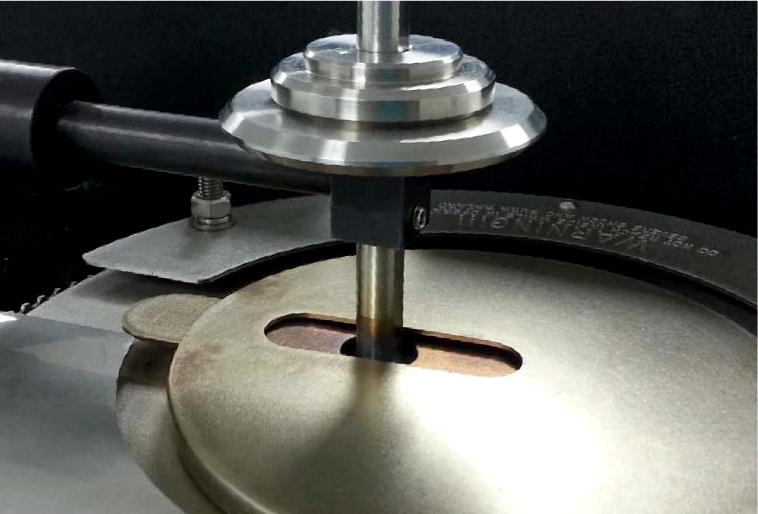
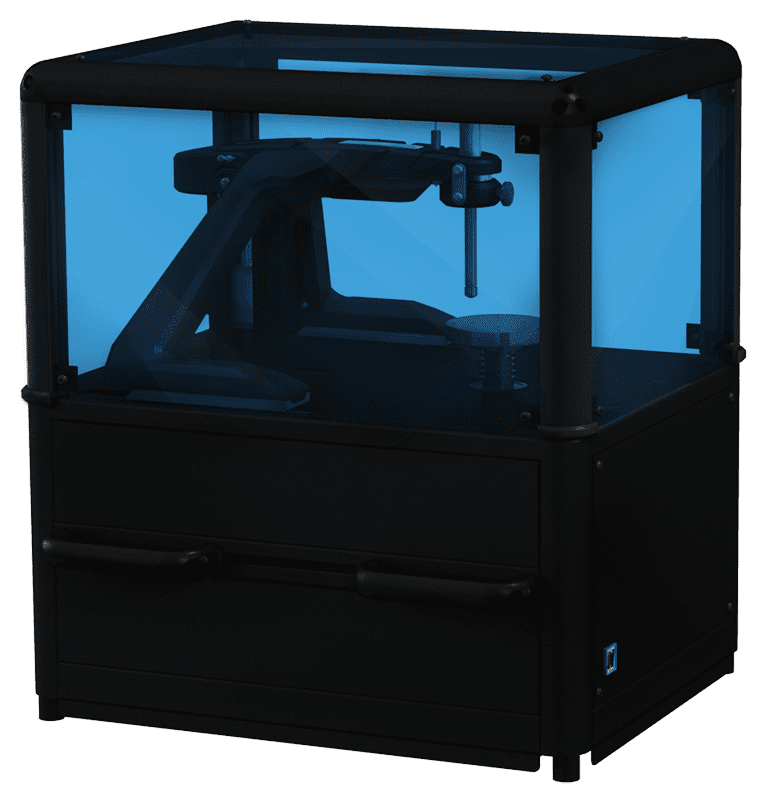
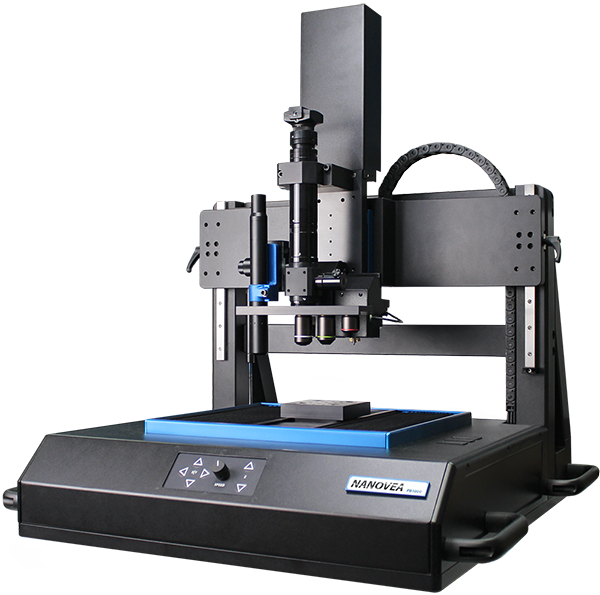
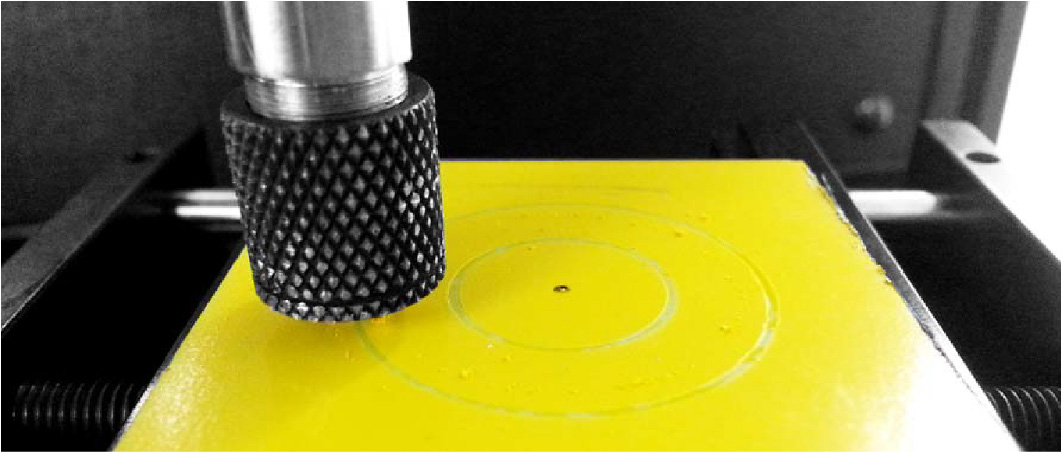
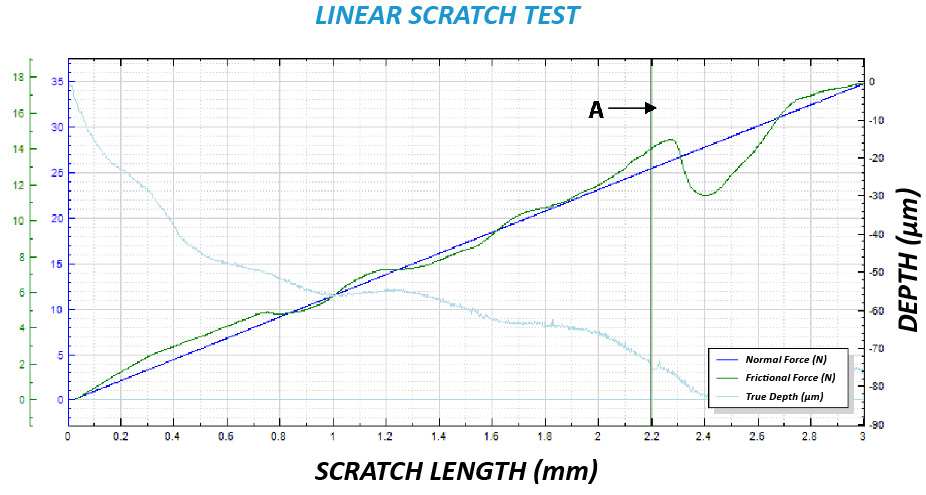
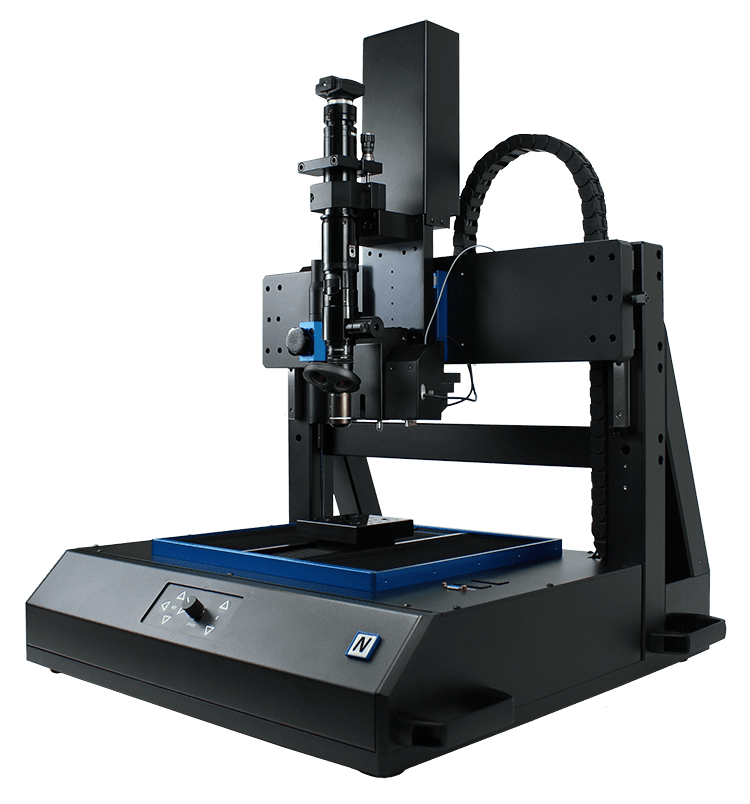
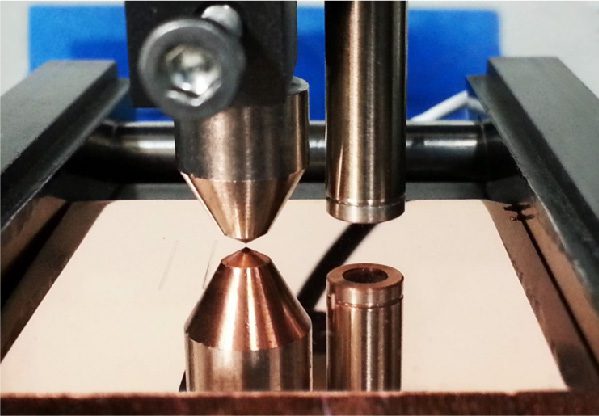
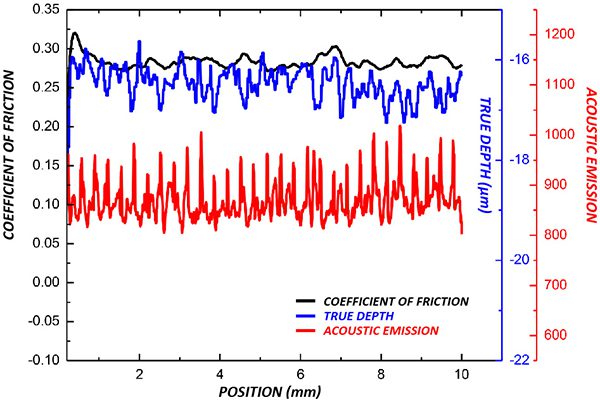
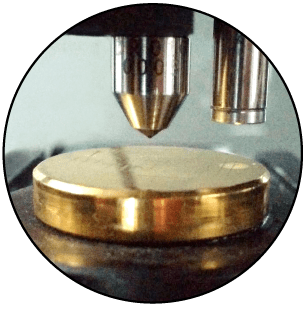
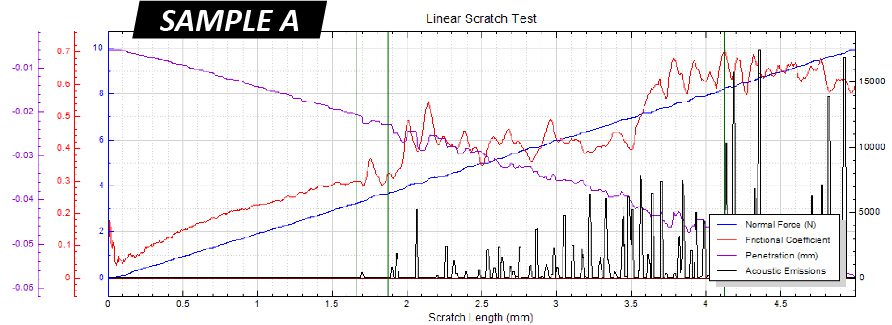
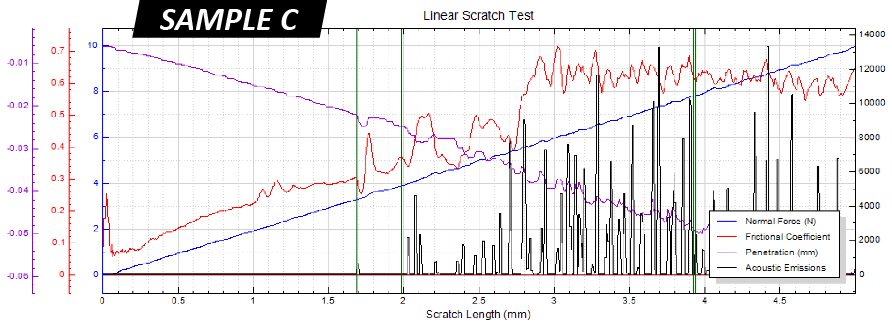
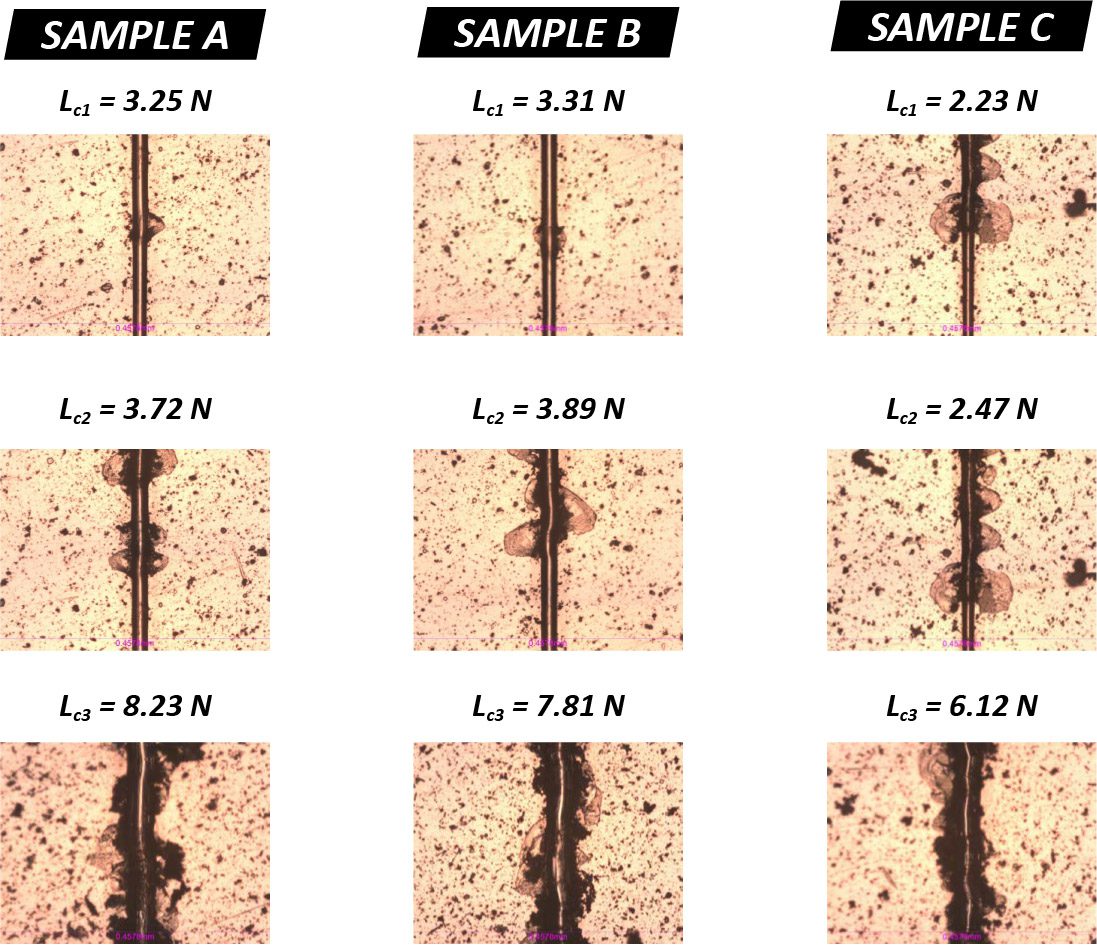
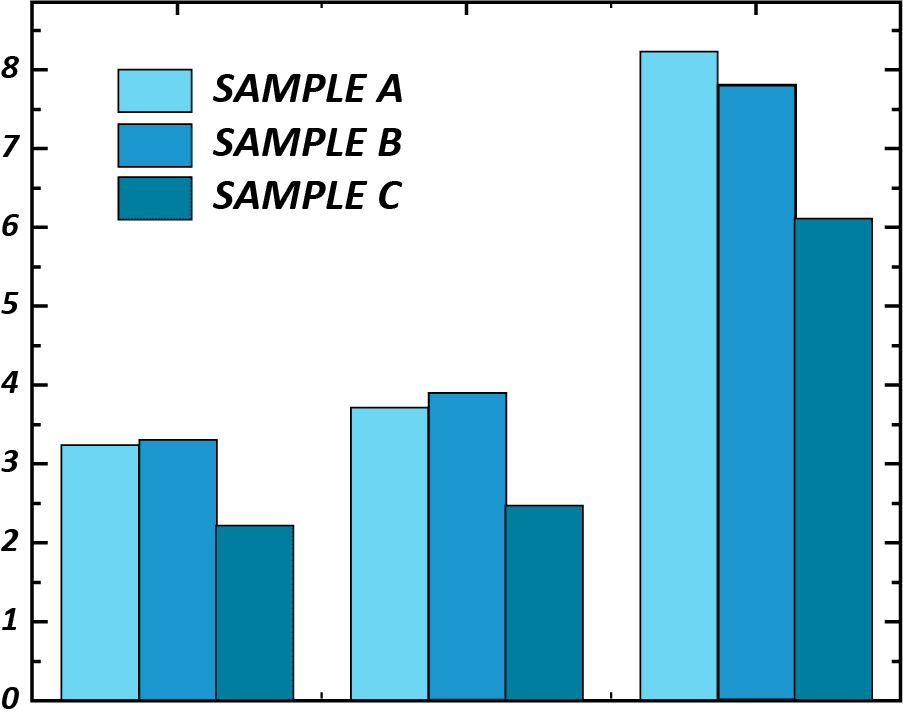
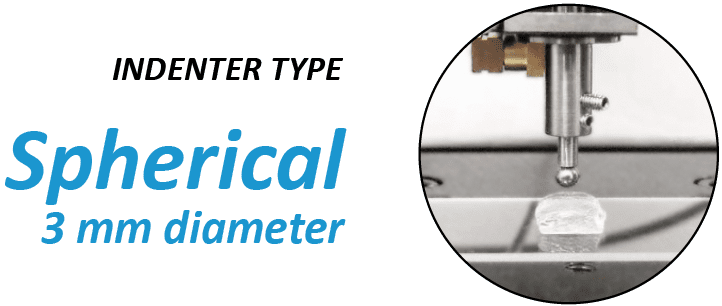
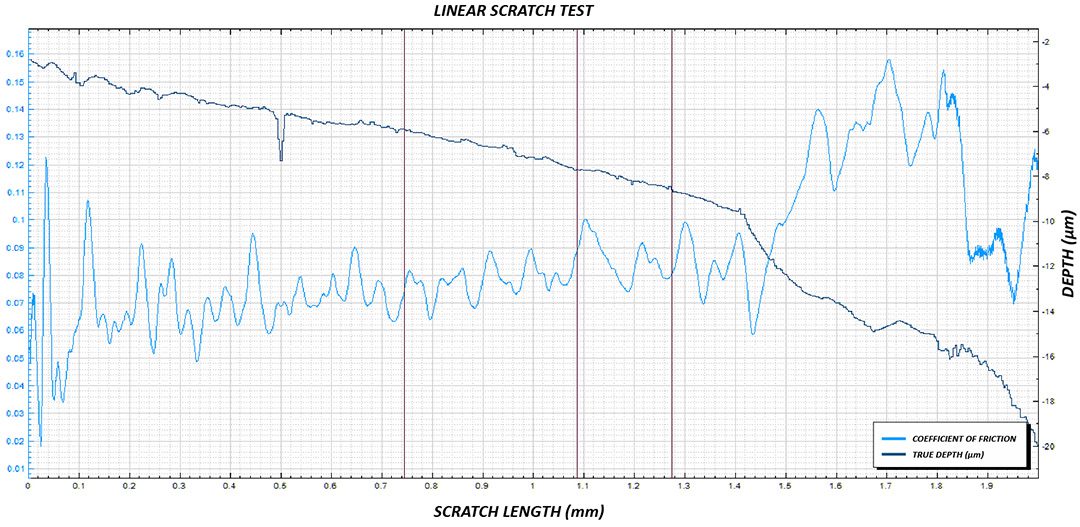
In this study, NANOVEA PB1000 Mechanical Tester is used to compare TPU vs. tempered-glass screen protectors under controlled progressive loading. Using precise acoustic emission detection, we identify critical failure loads and characterize how each material responds to increasing mechanical stress.
Why Scratch Resistance Testing Matters for Screen Protectors
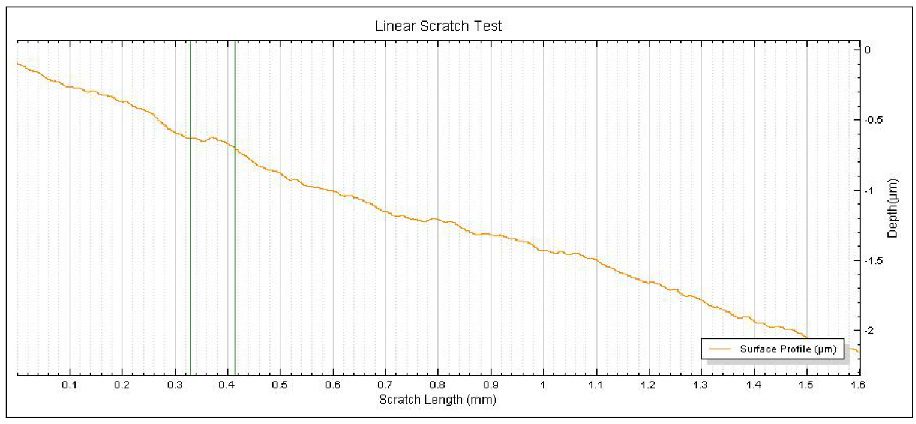
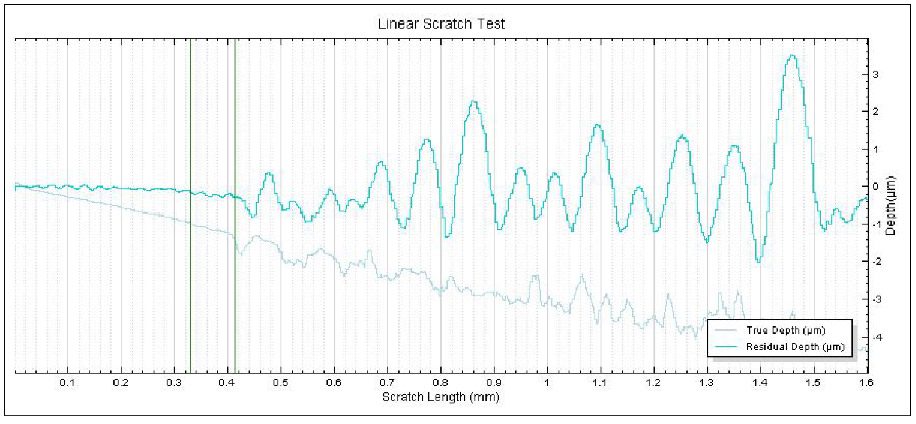
Many users assume that thicker or harder protectors automatically perform better, but real durability depends on how the material behaves under progressive load, surface deformation, and localized stress. Instrumented scratch testing allows engineers to measure coating adhesion, cohesive strength, surface wear resistance, and the exact loads at which failures initiate or propagate.
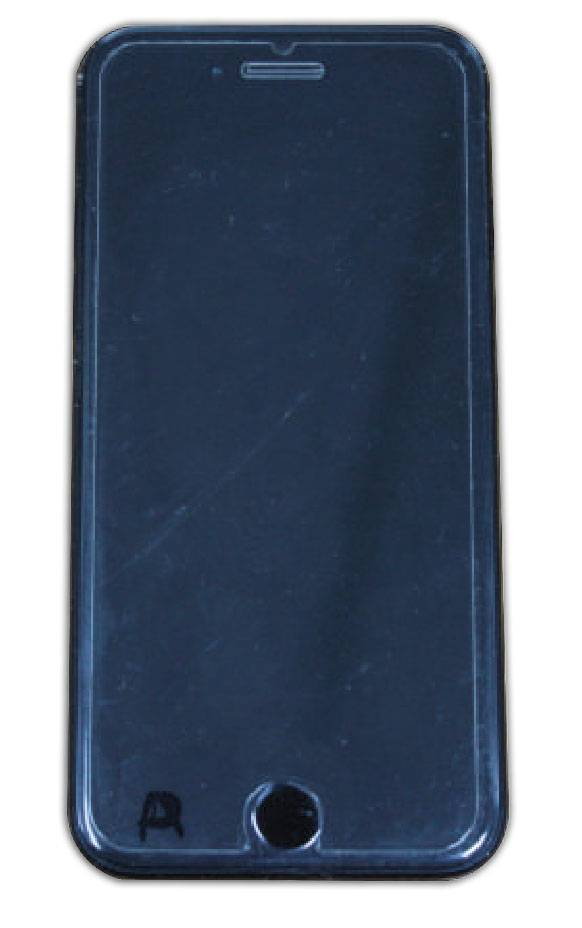
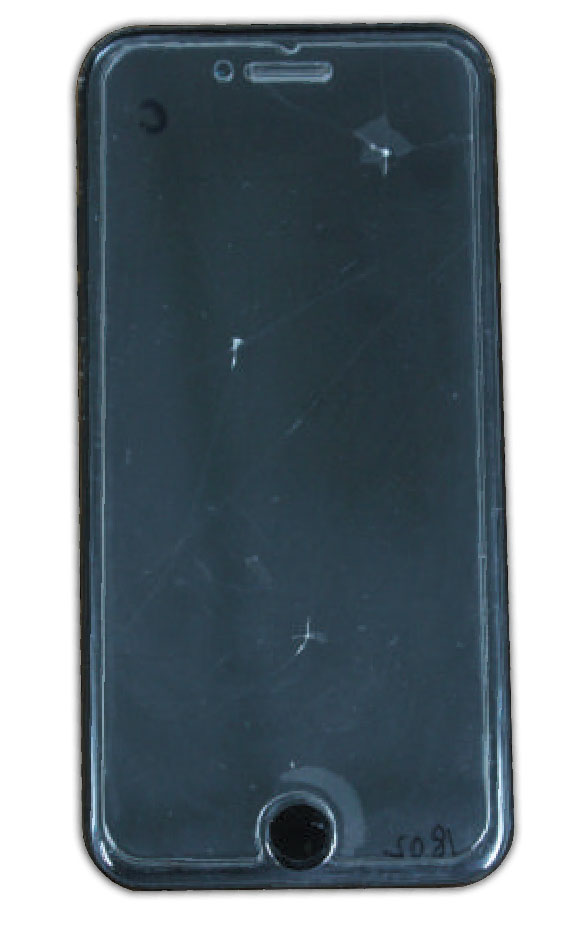
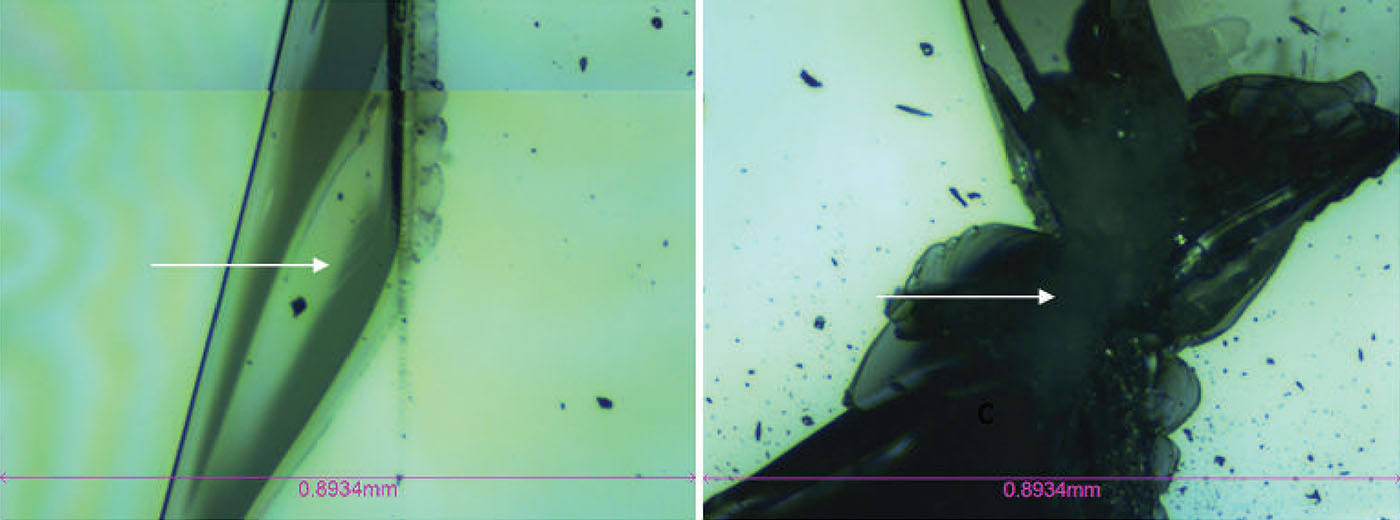
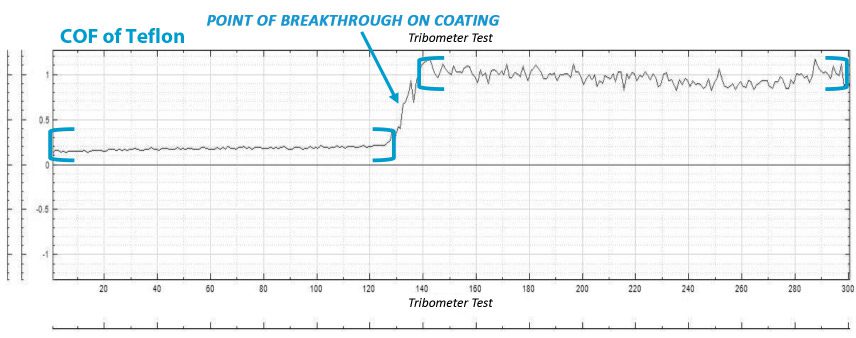
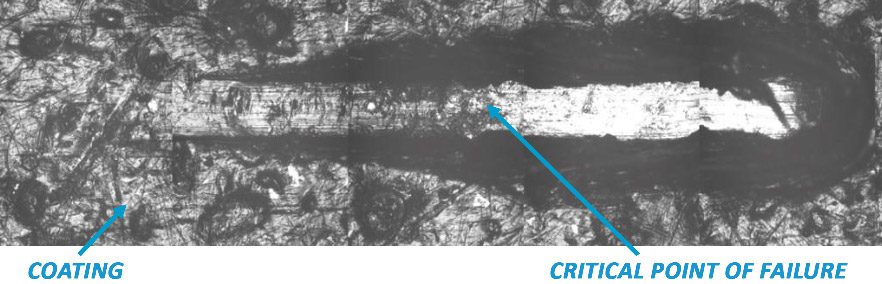
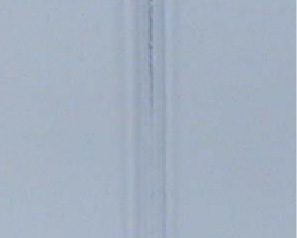
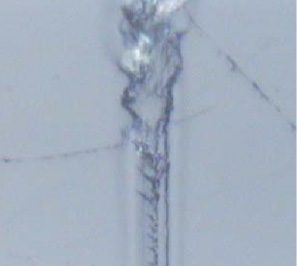
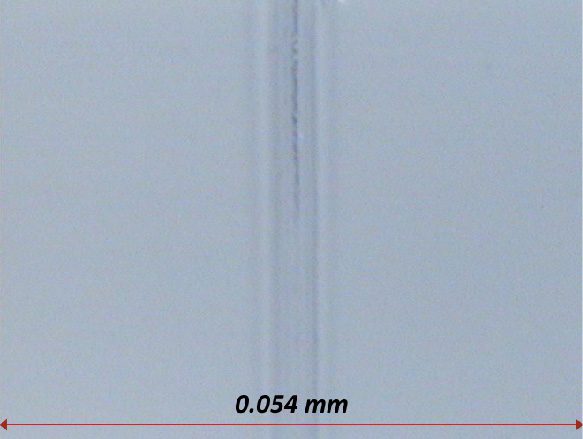
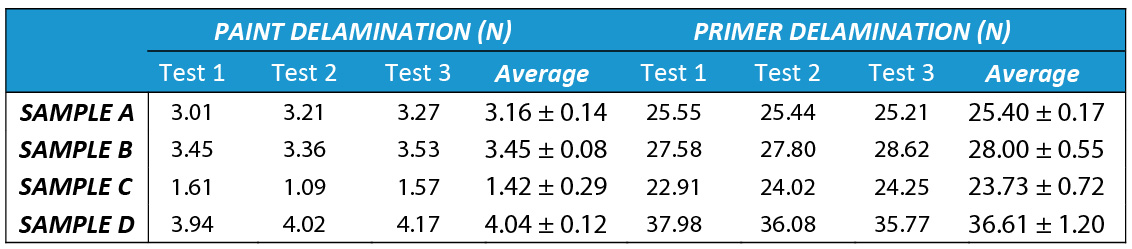
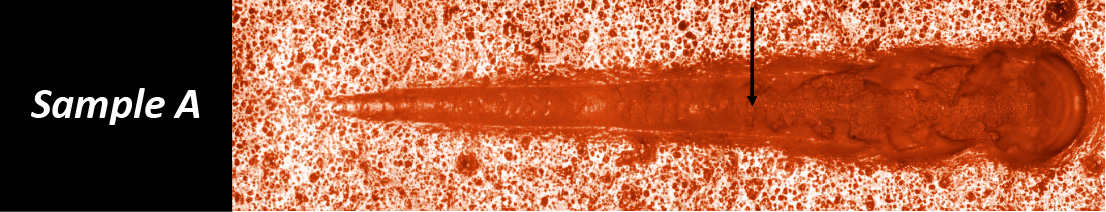
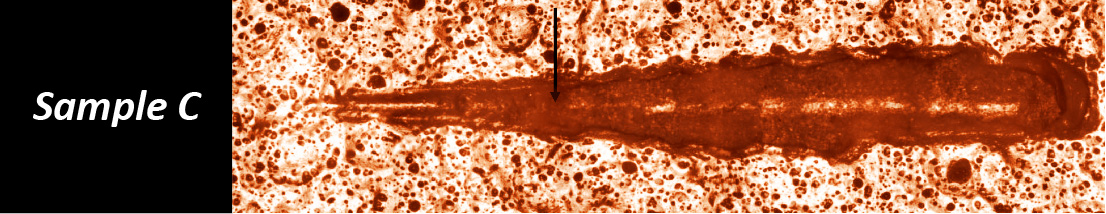
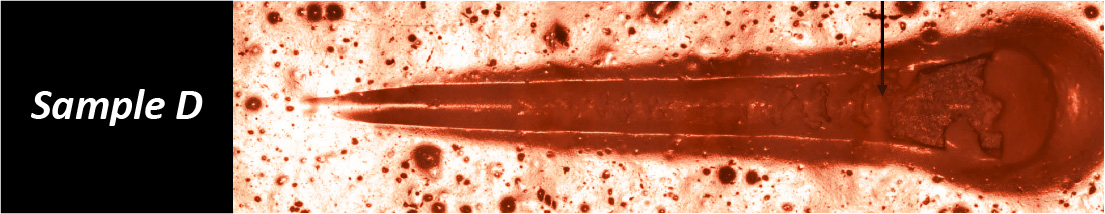
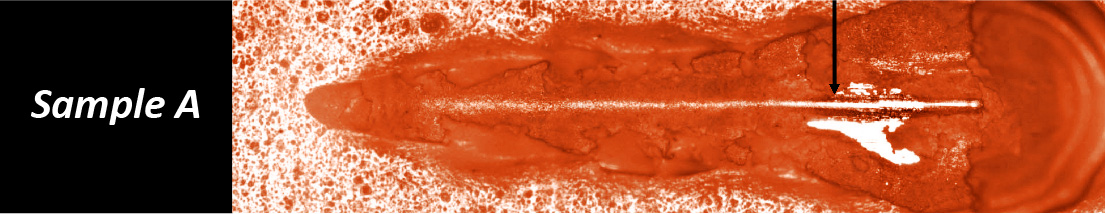
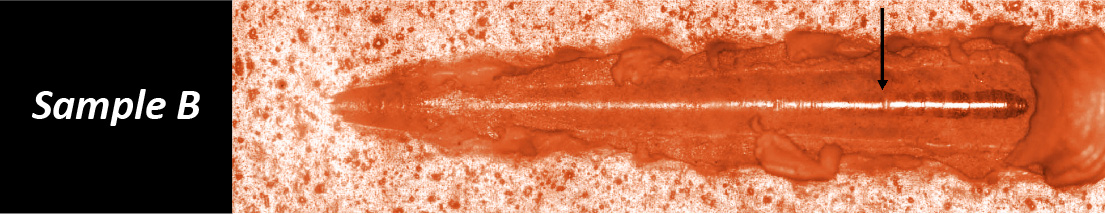
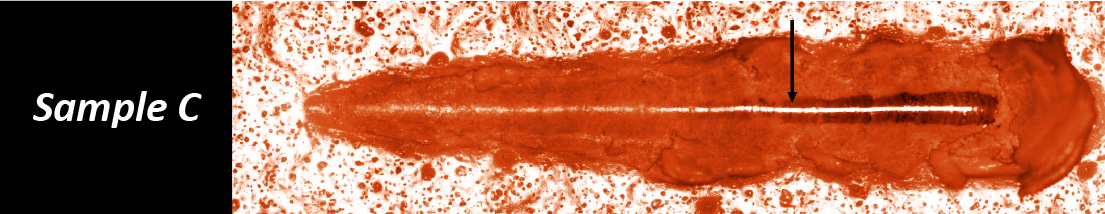
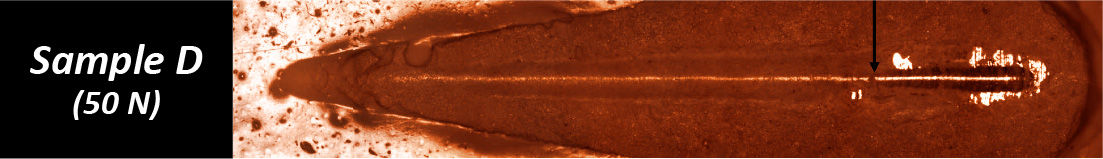
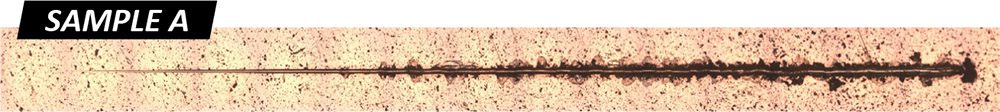
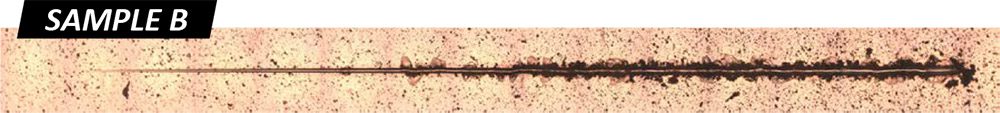
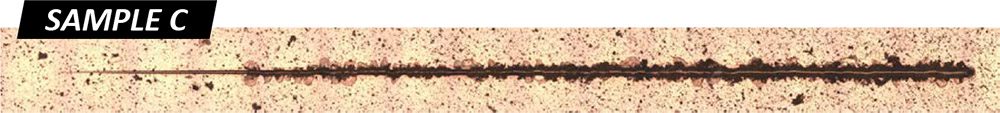
By analyzing crack initiation points, delamination behavior, and failure modes, manufacturers can validate screen-protector performance for R&D, quality control, or comparative benchmarking. Nano- and micro-scratch testing offer repeatable, data-driven insight into real-world durability far beyond traditional hardness ratings.
ℹ️ Learn more about scratch and adhesion testing services for coatings and screen protectors.