USA/GLOBAL: +1-949-461-9292
EUROPE: +39-011-3052-794
CONTACT US

Titanium Nitride Coating Scratch Test

TITANIUM NITRIDE COATING SCRATCH TEST

QUALITY CONTROL INSPECTION

Prepared by

DUANJIE LI, PhD

INTRODUCTION

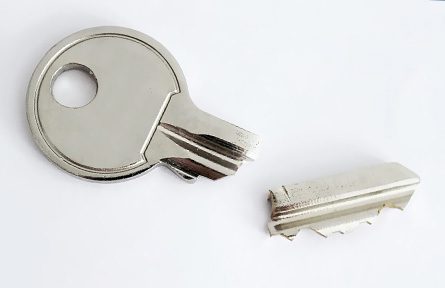
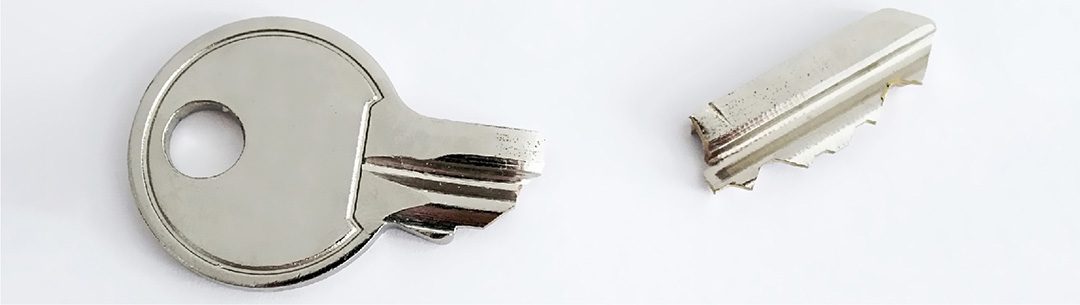
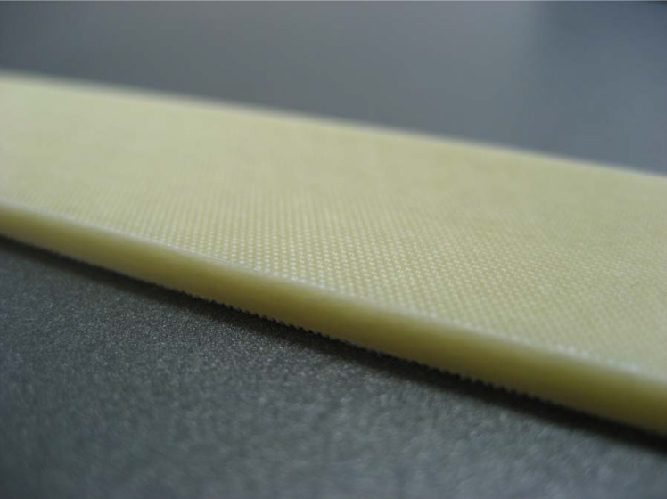
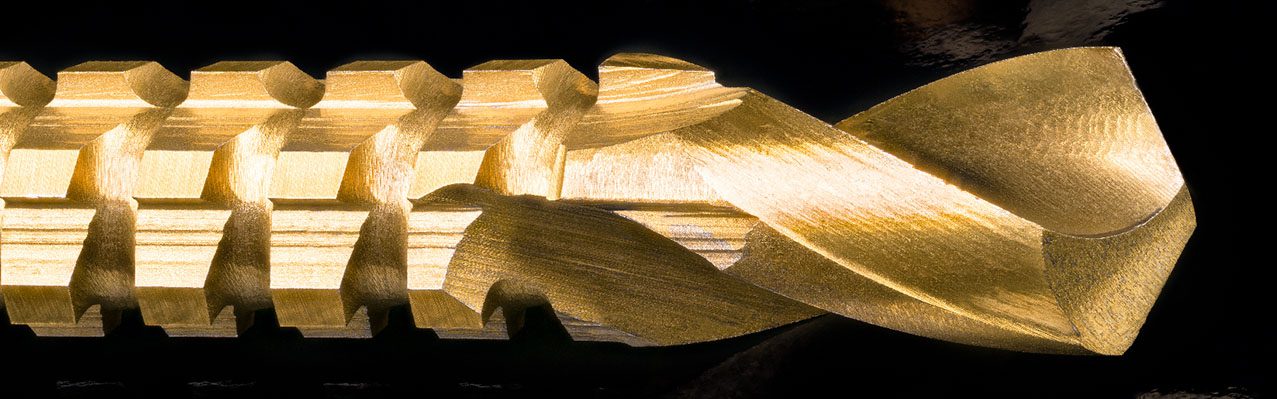
The combination of high hardness, excellent wear resistance, corrosion resistance and inertness makes titanium nitride (TiN) an ideal protective coating for metal components in various industries. For example, the edge retention and corrosion resistance of a TiN coating can substantially increase the work efficiency and extend the service life of machine tooling such as razor blades, metal cutters, injection molds and saws. Its high hardness, inertness and non-toxicity make TiN a great candidate for applications in medical devices including implants and surgical instruments.

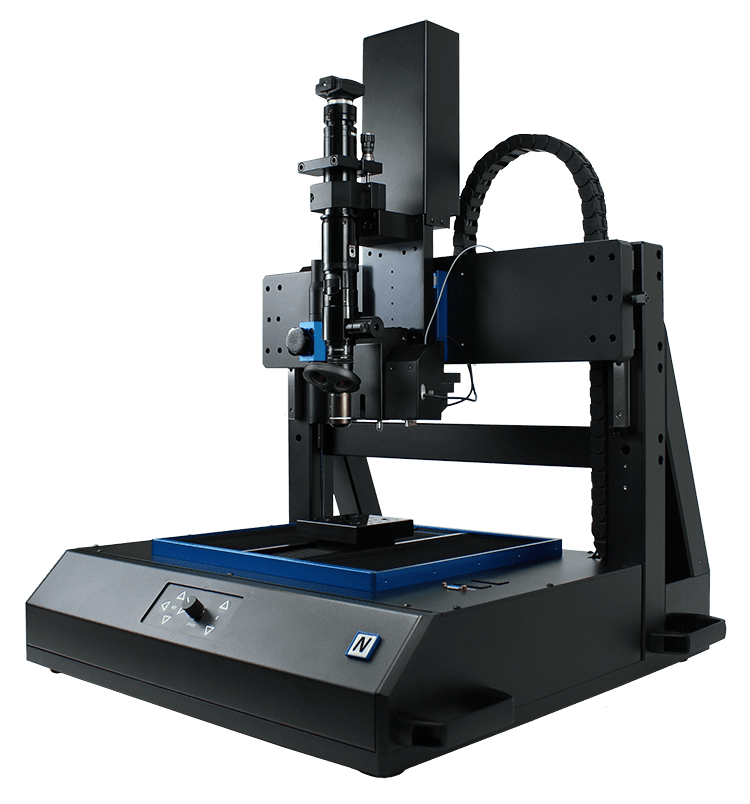
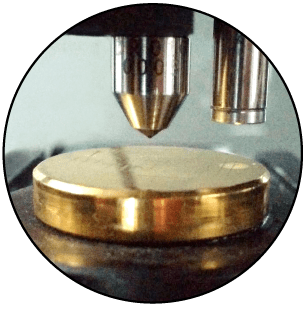
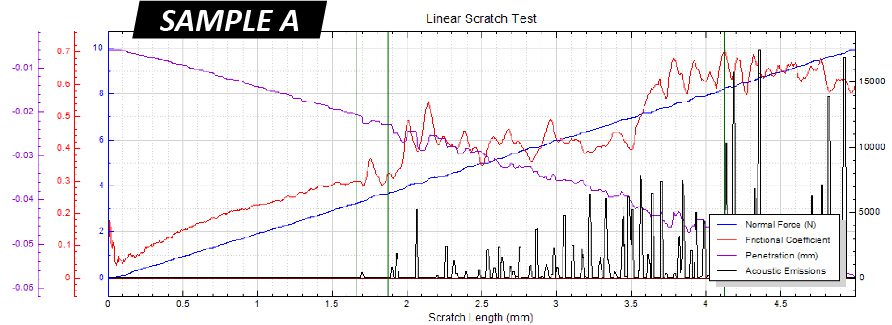
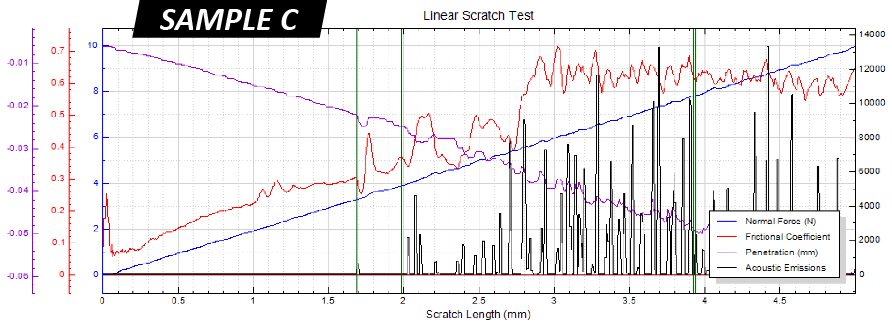
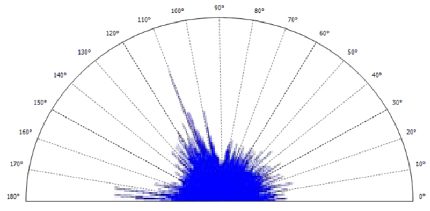
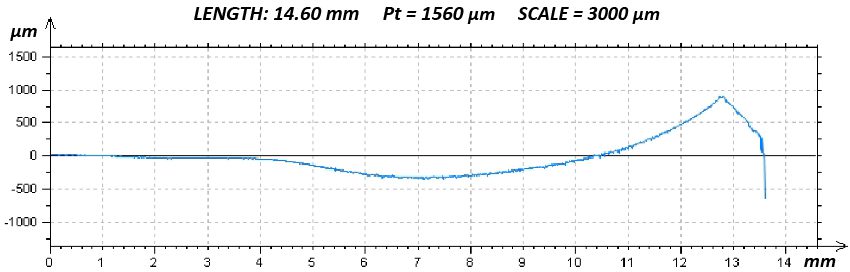
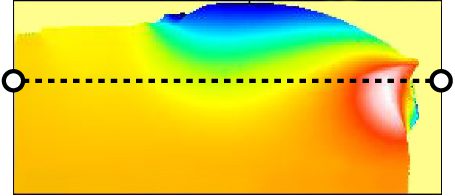
IMPORTANCE OF TiN COATING SCRATCH TESTING

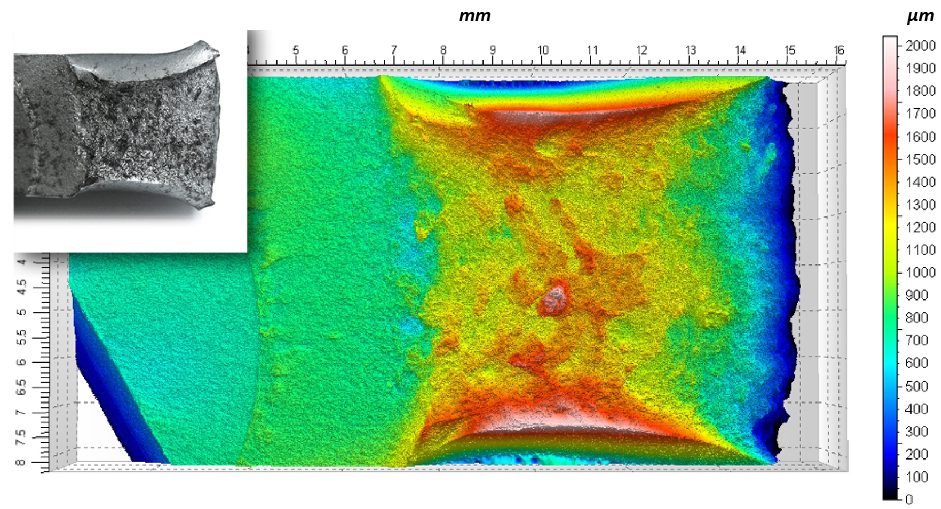
Residual stress in protective PVD/CVD coatings plays a critical role in the performance and mechanical integrity of the coated component. The residual stress derives from several major sources, including growth stress, thermal gradients, geometric constraints and service stress¹. The thermal expansion mismatch between the coating and the substrate created during coating deposition at elevated temperatures leads to high thermal residual stress. Moreover, TiN coated tools are often used under very high concentrated stresses, e.g. drill bits and bearings. It is critical to developing a reliable quality control process to quantitatively inspect the cohesive and adhesive strength of protective functional coatings.

[1] V. Teixeira, Vacuum 64 (2002) 393–399.

MEASUREMENT OBJECTIVE

In this study, we showcase that the NANOVEA Mechanical Testers in Scratch Mode are ideal for assessing the cohesive/adhesive strength of protective TiN coatings in a controlled and quantitative manner.

NANOVEA

PB1000

TEST CONDITIONS

The NANOVEA PB1000 Mechanical Tester was used to perform coating scratch tests on three TiN coatings using the same test parameters as summarized below:

LOADING MODE: Progressive Linear

INITIAL LOAD

0.02 N

FINAL LOAD

10 N

LOADING RATE

20 N/min

SCRATCH LENGTH

5 mm

INDENTER TYPE

Sphero-Conical

Diamond, 20 μm radius

RESULTS & DISCUSSION

FIGURE 1 shows the recorded evolution of penetration depth, coefficient of friction (COF) and acoustic emission during the test. The full micro scratch tracks on the TiN samples are shown in FIGURE 2. The failure behaviors at different critical loads are displayed in FIGURE 3, where critical load Lc1 is defined as the load at which the first sign of cohesive crack occurs in the scratch track, Lc2 is the load after which repeated spallation failures take place, and Lc3 is the load at which the coating is completely removed from the substrate. The critical load (Lc) values for the TiN coatings are summarized in FIGURE 4.

The evolution of penetration depth, COF and acoustic emission provides insight into the mechanism of the coating failure at different stages, which are represented by the critical loads in this study. It can be observed that Sample A and Sample B exhibit comparable behavior during the scratch test. The stylus progressively penetrates into the sample to a depth of ~0.06 mm and the COF gradually increases to ~0.3 as the normal load increases linearly at the beginning of the coating scratch test. When the Lc1 of ~3.3 N is reached, the first sign of chipping failure occurs. This is also reflected in the first large spikes in the plot of penetration depth, COF and acoustic emission. As the load continues to increase to Lc2 of ~3.8 N, further fluctuation of the penetration depth, COF and acoustic emission takes place. We can observe continuous spallation failure present on both sides of the scratch track. At the Lc3, the coating completely delaminates from the metal substrate under the high pressure applied by the stylus, leaving the substrate exposed and unprotected.

In comparison, Sample C exhibits lower critical loads at different stages of the coating scratch tests, which is also reflected in the evolution of penetration depth, coefficient of friction (COF) and acoustic emission during the coating scratch test. Sample C possesses an adhesion interlayer with lower hardness and higher stress at the interface between the top TiN coating and the metal substrate compared to Sample A and Sample B.

This study demonstrates the importance of proper substrate support and coating architecture to the quality of the coating system. A stronger interlayer can better resist deformation under a high external load and concentration stress, and thus enhance the cohesive and adhesive strength of the coating/substrate system.

FIGURE 1: Evolution of penetration depth, COF and acoustic emission of the TiN samples.

FIGURE 2: Full scratch track of the TiN coatings after the tests.

FIGURE 3: TiN coating failures under different critical loads, Lc.

FIGURE 4: Summary of critical load (Lc) values for the TiN coatings.

CONCLUSION

In this study, we showcased that the NANOVEA PB1000 Mechanical Tester performs reliable and accurate scratch tests on TiN-coated samples in a controlled and closely monitored manner. Scratch measurements allow users to quickly identify the critical load at which typical cohesive and adhesive coating failures occur. Our instruments are superior quality control tools that can quantitatively inspect and compare the intrinsic quality of a coating and the interfacial integrity of a coating/substrate system. A coating with a proper interlayer can resist large deformation under a high external load and concentration stress, and enhance the cohesive and adhesive strength of a coating/substrate system.

The Nano and Micro modules of a NANOVEA Mechanical Tester all include ISO and ASTM compliant indentation, scratch and wear tester modes, providing the widest and most user-friendly range of testing available in a single system. NANOVEA’s unmatched range is an ideal solution for determining the full range of mechanical properties of thin or thick, soft or hard coatings, films and substrates, including hardness, Young’s modulus, fracture toughness, adhesion, wear-resistance and many others.

NOW, LET'S TALK ABOUT YOUR APPLICATION

Fractography Analysis Using 3D Profilometry

FRACTOGRAPHY ANALYSIS

USING 3D PROFILOMETRY

Prepared by

CRAIG LEISING

INTRODUCTION

Fractography is the study of features on fractured surfaces and has historically been investigated via Microscope or SEM. Depending on the size of the feature, a microscope (macro features) or SEM (nano and micro features) are selected for the surface analysis. Both ultimately allowing for the identification of the fracture mechanism type. Although effective, the Microscope has clear limitations and the SEM in most cases, other than atomic-level analysis, is unpractical for fracture surface measurement and lacks broader use capability. With advances in optical measurement technology, the NANOVEA 3D Non-Contact Profilometer is now considered the instrument of choice, with its ability to provide nano through macro-scale 2D & 3D surface measurements

IMPORTANCE OF 3D NON-CONTACT PROFILOMETER FOR FRACTURE INSPECTION

Unlike an SEM, a 3D Non-Contact Profilometer can measure nearly any surface, sample size, with minimal sample prep, all while offering superior vertical/horizontal dimensions to that of an SEM. With a profiler, nano through macro range features are captured in a single measurement with zero influence from sample reflectivity. Easily measure any material: transparent, opaque, specular, diffusive, polished, rough etc. The 3D Non-Contact Profilometer provides broad and user-friendly capability to maximize surface fracture studies at a fraction of the cost of an SEM.

MEASUREMENT OBJECTIVE

In this application, the NANOVEA ST400 is used to measure the fractured surface of a steel sample. In this study, we will showcase a 3D area, 2D profile extraction and surface directional map of the surface.

NANOVEA

ST400

RESULTS

TOP SURFACE

3D Surface Texture Direction

Isotropy51.26%
First Direction123.2º
Second Direction116.3º
Third Direction0.1725º

Surface Area, Volume, Roughness and many others can be automatically calculated from this extraction.

2D Profile Extraction

RESULTS

SIDE SURFACE

3D Surface Texture Direction

Isotropy15.55%
First Direction0.1617º
Second Direction110.5º
Third Direction171.5º

Surface Area, Volume, Roughness and many others can be automatically calculated from this extraction.

2D Profile Extraction

CONCLUSION

In this application, we have shown how the NANOVEA ST400 3D Non-Contact Profilometer can precisely characterize the full topography (nano, micro and macro features) of a fractured surface. From the 3D area, the surface can be clearly identified and subareas or profiles/cross-sections can be quickly extracted and analyzed with an endless list of surface calculations. Sub nanometer surface features can be further analyzed with an integrated AFM module.

Additionally, NANOVEA has included a portable version to their Profilometer line-up, especially critical for field studies where a fracture surface is immovable. With this broad list of surface measurement capabilities, fracture surface analysis has never been easier and more convenient with a single instrument.

NOW, LET'S TALK ABOUT YOUR APPLICATION

Fiberglass Surface Topography Using 3D Profilometry

FIBERGLASS SURFACE TOPOGRAPHY

USING 3D PROFILOMETRY

Prepared by

CRAIG LEISING

INTRODUCTION

Fiberglass is a material made from extremely fine fibers of glass. It is used as a reinforcing agent for many polymer products; the resulting composite material, properly known as fiber-reinforced polymer (FRP) or glass-reinforced plastic (GRP), is called “fiberglass” in popular usage.

IMPORTANCE OF SURFACE METROLOGY INSPECTION FOR QUALITY CONTROL

Although there are many uses for Fiberglass reinforcement, in most applications it is crucial that they are as strong as possible. Fiberglass composites have one of the highest strength to weight ratios available and in some cases, pound for pound it is stronger than steel. Aside from high strength, it is also important to have the smallest possible exposed surface area. Large fiberglass surfaces can make the structure more vulnerable to chemical attack and possibly material expansion. Therefore, surface inspection is critical to quality control production.

MEASUREMENT OBJECTIVE

In this application, the NANOVEA ST400 is used to measure a Fiberglass Composite surface for roughness and flatness. By quantifying these surface features it is possible to create or optimize a stronger, longer lasting fiberglass composite material.

NANOVEA

ST400

MEASUREMENT PARAMETERS

PROBE 1 mm
ACQUISITION RATE300 Hz
AVERAGING1
MEASURED SURFACE5 mm x 2 mm
STEP SIZE5 µm x 5 µm
SCANNING MODEConstant speed

PROBE SPECIFICATIONS

MEASUREMENT RANGE1 mm
Z RESOLUTION 25 nm
Z ACCURACY200 nm
LATERAL RESOLUTION 2 μm

RESULTS

FALSE COLOR VIEW

3D Surface Flatness

3D Surface Roughness

Sa15.716 μmArithmetical Mean Height
Sq19.905 μmRoot Mean Square Height
Sp116.74 μmMaximum Peak Height
Sv136.09 μmMaximum Pit Height
Sz252.83 μmMaximum Height
Ssk0.556Skewness
Ssu3.654Kurtosis

CONCLUSION

As shown in the results, the NANOVEA ST400 Optical Profiler was able to accurately measure the roughness and flatness of the fiberglass composite surface. Data can be measured over multiple batches of fiber composites and or a given time period to provide crucial information about different fiberglass manufacturing processes and how they react over time. Thus, the ST400 is a viable option for strengthening the quality control process of fiberglass composite materials.

NOW, LET'S TALK ABOUT YOUR APPLICATION