USA/GLOBAL: +1-949-461-9292
EUROPE: +39-011-3052-794
CONTACT US

Glass Coating Humidity Wear Testing by Tribometer

Glass Coating Humidity Wear Testing by Tribometer

Learn more


GLASS COATING HUMIDITY

WEAR TESTING BY TRIBOMETER

Prepared by

DUANJIE LI, PhD

INTRODUCTION

Self-cleaning glass coating creates an easy-clean glass surface that prevents buildup of grime, dirt and staining. Its self-cleaning feature significantly reduces the frequency, time, energy and cleaning costs, making it an attractive choice for a variety of residential and commercial applications, such as glass facade, mirrors, shower glasses, windows and windshields.

IMPORTANCE OF WEAR RESISTANCE OF SELF-CLEANING GLASS COATING

A major application of the self-cleaning coating is the exterior surface of the glass facade on skyscrapers. The glass surface is often attacked by high-speed particles carried by strong winds. The weather condition also plays a major role in the service lifetime of the glass coating. It can be very difficult and costly to surface treat the glass and apply the new coating when the old one fails. Therefore, the wear resistance of the glass coating under
different weather condition is critical.


In order to simulate the realistic environmental conditions of the self-cleaning coating in different weather, repeatable wear evaluation in a controlled and monitored humidity is needed. It allows users to properly compare the wear resistance of the self-cleaning coatings exposed to different humidity and to select the best candidate for the targeted application.

MEASUREMENT OBJECTIVE

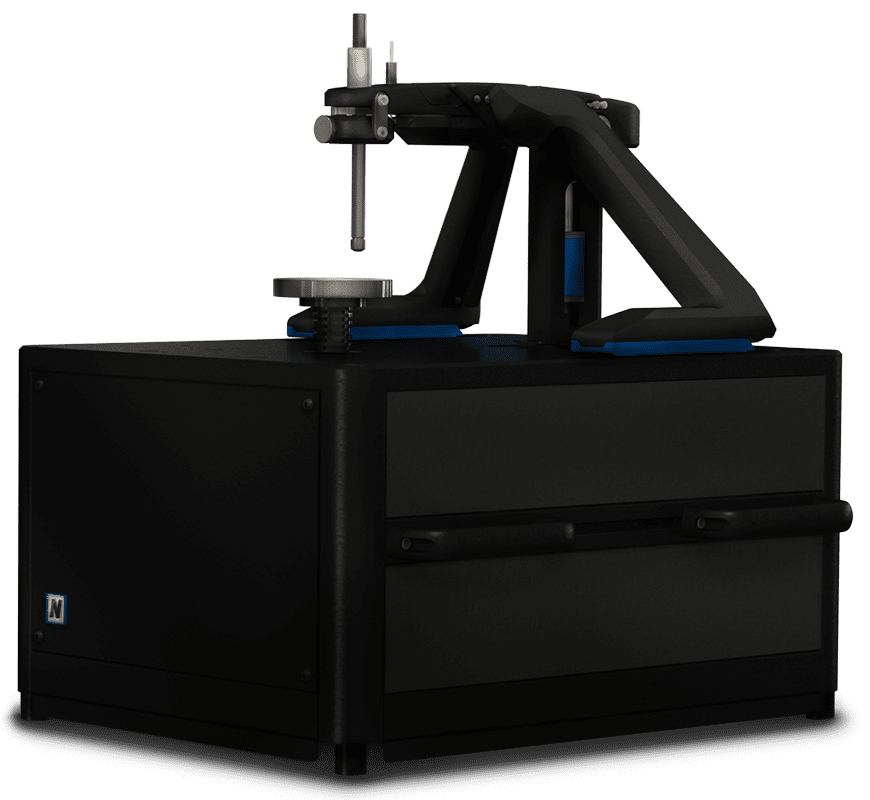
In this study, we showcased that the NANOVEA T100 Tribometer equipped with a humidity controller is an ideal tool for investigating the wear resistance of self-cleaning glass coatings in different humidity.

NANOVEA

T100

TEST PROCEDURES

The soda lime glass microscope slides were coated with self-clean glass coatings with two different treatment recipes. These two coatings are identified as Coating 1 and Coating 2. An uncoated bare glass slide is also tested for comparison.


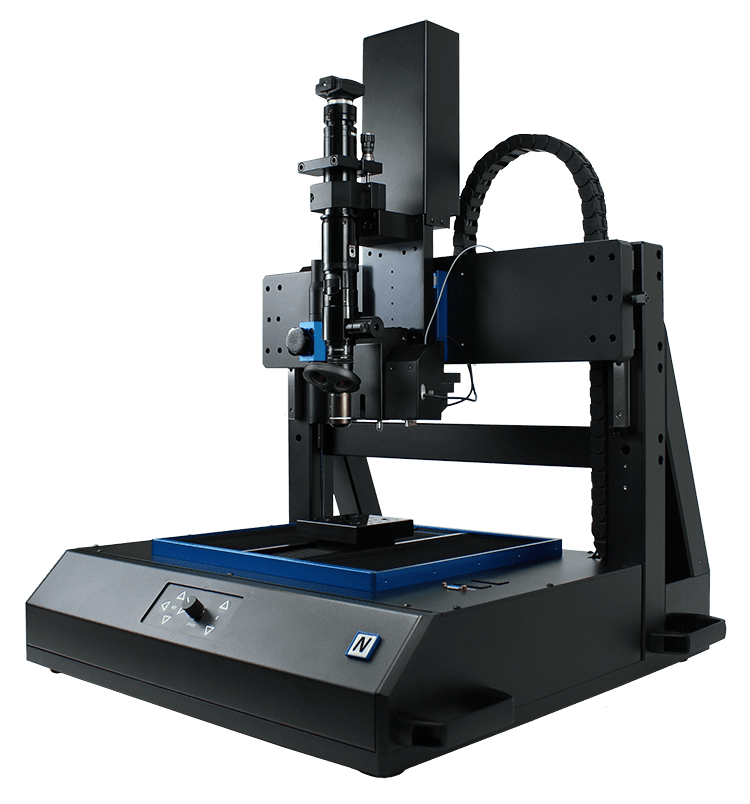
NANOVEA Tribometer equipped with a humidity control module was used to evaluate the tribological behavior, e.g. coefficient of friction, COF, and wear resistance of the self-clean glass coatings. A WC ball tip (6 mm dia.) was applied against the tested samples. The COF was recorded in situ. The humidity controller attached to the tribo-chamber precisely controlled the relative humidity (RH) value in the range of ±1 %. The wear track morphology was examined under the optical microscope after the wear tests.

MAXIMUM LOAD 40 mN
RESULTS & DISCUSSION

The pin-on-disk wear tests in different humidity conditions were conducted on the coated and uncoated glass
samples. The COF was recorded in situ during the wear tests as shown in
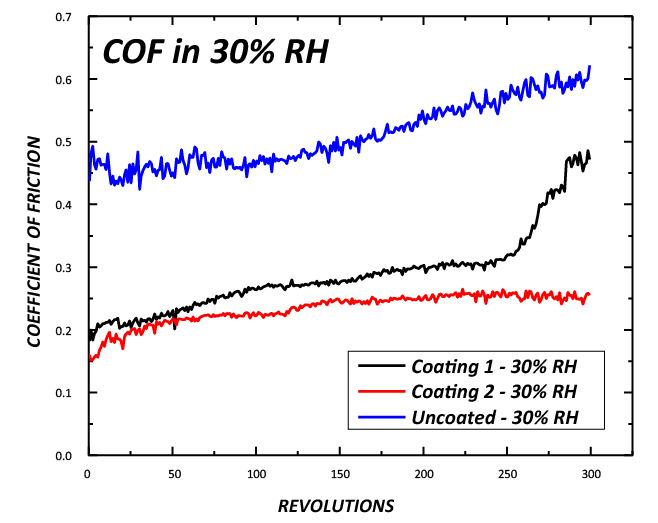
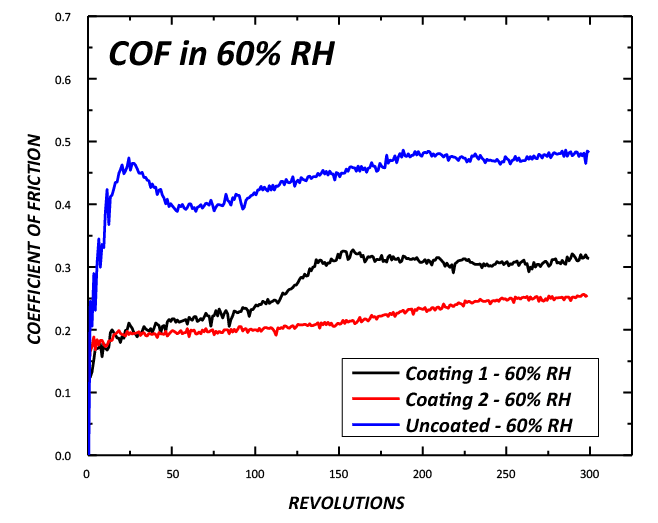
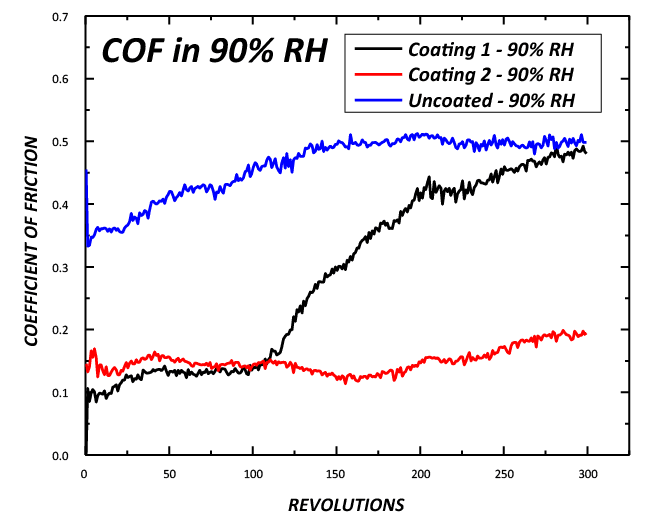
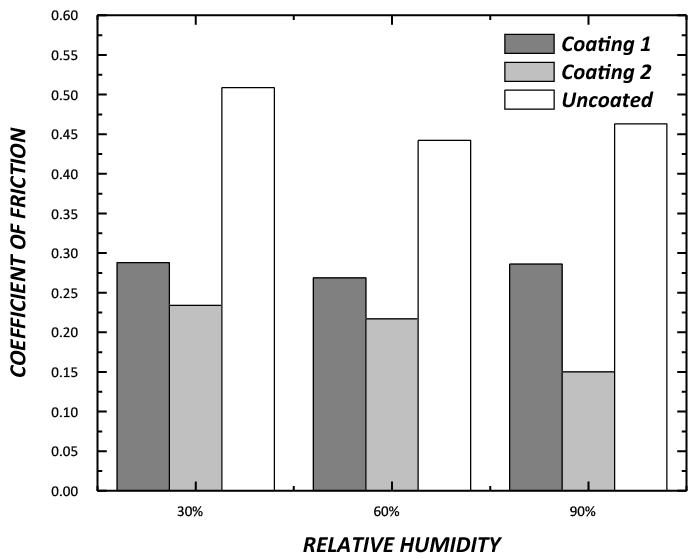
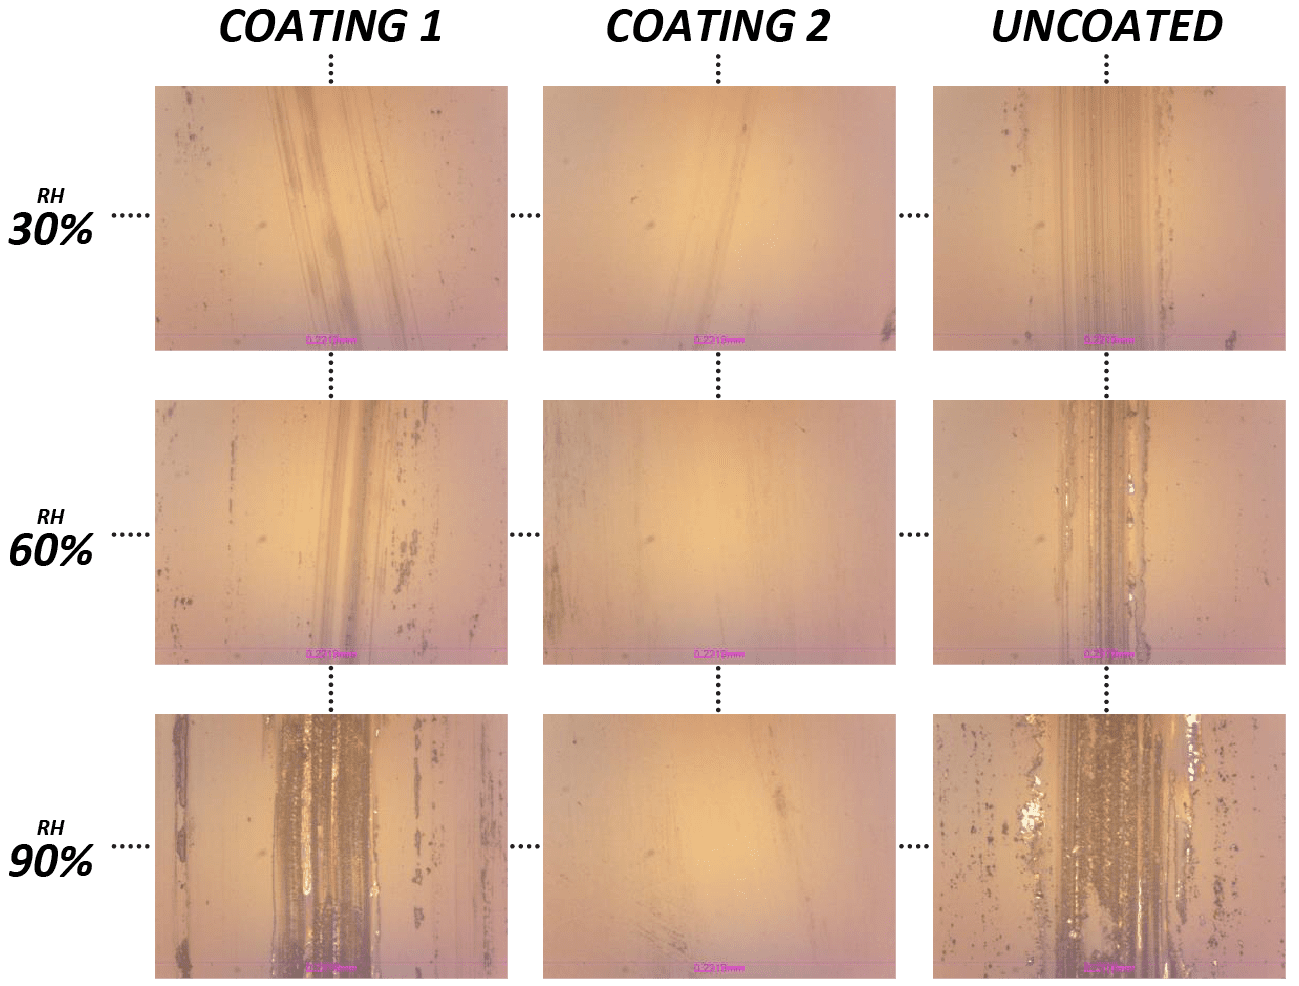
FIGURE 1 and the average COF is summarized in FIGURE 2. FIGURE 4 compares the wear tracks after the wear tests.


As shown in
FIGURE 1, the uncoated glass exhibits a high COF of ~0.45 once the sliding movement begins in the 30% RH, and it progressively increases to ~0.6 at the end of the 300-revolution wear test. In comparison, the
coated glass samples Coating 1 and Coating 2 show a low COF below 0.2 at the beginning of the test. The COF
of Coating 2 stabilizes at ~0.25 during the rest of the test, while Coating 1 exhibits a sharp increase of COF at
~250 revolutions and the COF reaches a value of ~0.5. When the wear tests are carried out in the 60% RH, the
uncoated glass still shows a higher COF of ~0.45 throughout the wear test. Coatings 1 and 2 exhibit the COF values of 0.27 and 0.22, respectively. In the 90% RH, the uncoated glass possesses a high COF of ~0.5 at the end of the wear test. Coatings 1 and 2 exhibit comparable COF of ~0.1 as the wear test starts. Coating 1 maintains a relatively stable COF of ~0.15. Coating 2, however, fails at ~ 100 revolutions, followed by a significant increase of COF to ~0.5 towards the end of the wear test.


The low friction of the self-clean glass coating is caused by its low surface energy. It creates a very high static
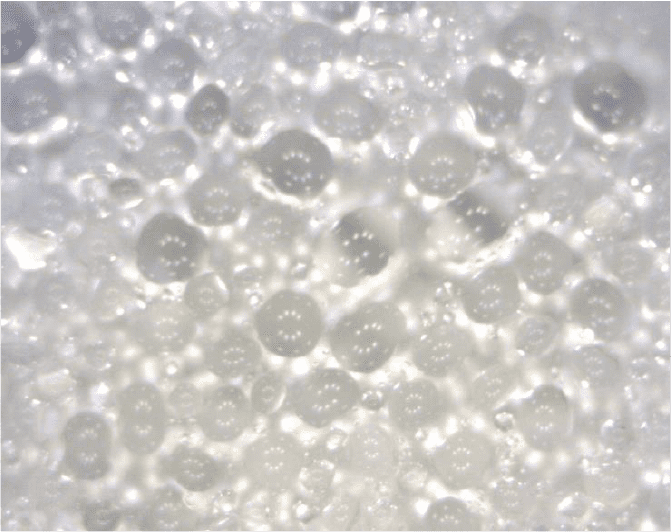
water contact angle and low roll-off angle. It leads to formation of small water droplets on the coating surface in the 90% RH as shown under the microscope in
FIGURE 3. It also results in decrease of the average COF from ~0.23 to ~0.15 for Coating 2 as the RH value increases from 30% to 90%.

FIGURE 1: Coefficient of friction during the pin-on-disk tests in different relative humidity.

FIGURE 2: Average COF during the pin-on-disk tests in different relative humidity.

FIGURE 3: Formation of small water droplets on the coated glass surface.

FIGURE 4 compares the wear tracks on the glass surface after the wear tests in different humidity. Coating 1 exhibits signs of mild wear after the wear tests in the RH of 30% and 60%. It possesses a large wear track after the test in the 90% RH, in agreement with the significant increase of COF during the wear test. Coating 2 shows nearly no sign of wear after the wear tests in both dry and wet environment, and it also exhibits constant low COF during the wear tests in different humidity. The combination of good tribological properties and low surface energy makes Coating 2 a good candidate for self-cleaning glass coating applications in harsh environments. In comparison, the uncoated glass shows larger wear tracks and higher COF in different humidity, demonstrating the necessity of self-cleaning coating technique.

FIGURE 4: Wear tracks after the pin-on-disk tests in different relative humidity (200x magnification).

CONCLUSION

NANOVEA T100 Tribometer is a superior tool for evaluation and quality control of self-cleaning glass coatings in different humidity. The capacity of in-situ COF measurement allows users to correlate different stages of wear process with the evolution of COF, which is critical in improving fundamental understanding of the wear mechanism and tribological characteristics of the glass coatings. Based on the comprehensive tribological analysis on the self-cleaning glass coatings tested in different humidity, we show that Coating 2 possesses a constant low COF and superior wear resistance in both dry and wet environments, making it a better candidate for self-cleaning glass coating applications exposed to different weathers.


NANOVEA Tribometers offer precise and repeatable wear and friction testing using ISO and ASTM compliant rotative and linear modes, with optional high temperature wear, lubrication and tribo-corrosion modules available in one pre-integrated system. Optional 3D non-contact profiler is available for high
resolution 3D imaging of wear track in addition to other surface measurements such as roughness. 

NOW, LET'S TALK ABOUT YOUR APPLICATION

Creep Deformation of Polymers using Nanoindentation

Creep Deformation of Polymers using Nanoindentation

Learn more


CREEP DEFORMATION

OF POLYMERS USING NANOINDENTATION

Prepared by

DUANJIE LI, PhD

INTRODUCTION

As viscoelastic materials, polymers often undergo a time-dependent deformation under a certain applied load, also known as creep. Creep becomes a critical factor when the polymeric parts are designed to be exposed to continuous stress, such as structural components, joins and fittings, and hydrostatic pressure vessels.

IMPORTANCE OF CREEP MEASUREMENT FOR POLYMERS

The inherent nature of viscoelasticity plays a vital role in the performance of polymers and directly influences their service reliability. The environmental conditions such as loading and temperature affect the creep behavior of the polymers. Creep failures often occur due to the lack of alertness of the time-dependent creep behavior of the polymer materials used under specific service conditions. As a result, it is important to develop a reliable and quantitative test of the viscoelastic mechanical behaviors of the polymers. The Nano module of the NANOVEA Mechanical Testers applies the load with a high-precision piezo and directly measures the evolution of force and displacement in situ. The combination of accuracy and repeatability makes it an ideal tool for creep measurement.

MEASUREMENT OBJECTIVE

In this application, we showcased that
the NANOVEA PB1000 Mechanical Tester
in Nanoindentation mode is an ideal tool
for studying viscoelastic mechanical properties
including hardness, Young’s modulus
and creep of polymeric materials.

NANOVEA

PB1000

TEST CONDITIONS

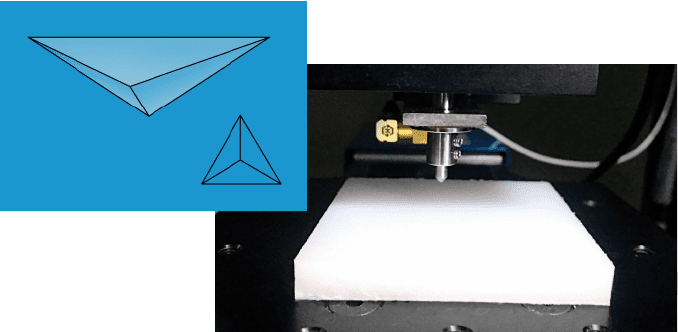
Eight different polymer samples were tested by nanoindentation technique using the NANOVEA PB1000 Mechanical Tester. As the load linearly increased from 0 to 40 mN, the depth progressively increased during the loading stage. The creep was then measured by the change of indentation depth at the maximum load of 40 mN for 30 s.

MAXIMUM LOAD 40 mN
LOADING RATE
80 mN/min
UNLOADING RATE 80 mN/min
CREEP TIME
30 s

INDENTER TYPE

Berkovich

Diamond

*setup of the nanoindentation test

RESULTS & DISCUSSION

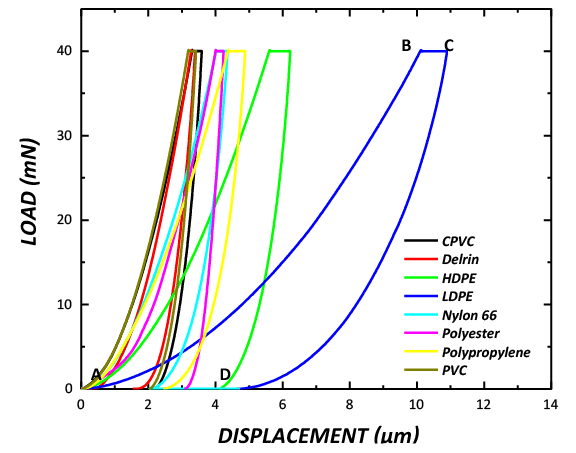
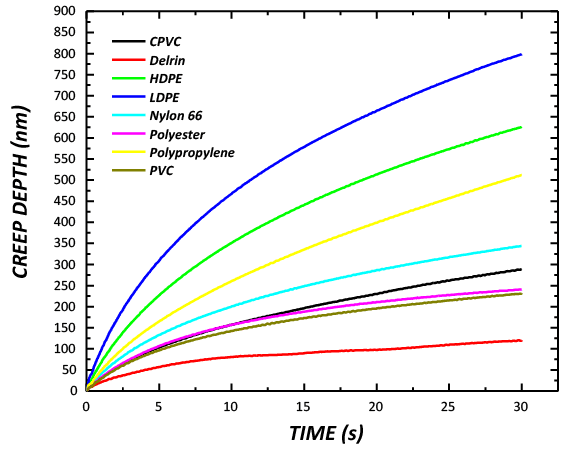
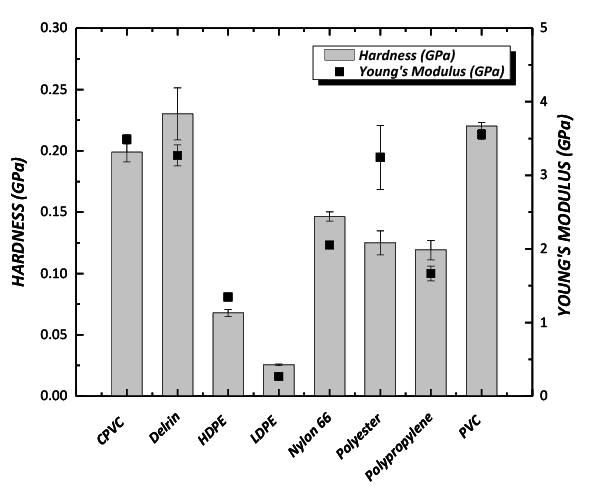
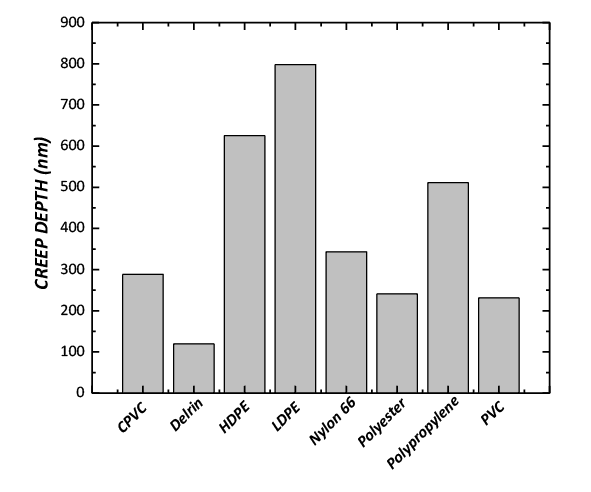
The load vs displacement plot of the nanoindentation tests on different polymer samples is shown in FIGURE 1 and the creep curves are compared in FIGURE 2. The hardness and Young’s modulus are summarized in  FIGURE 3, and the creep depth is shown in FIGURE 4. As an examples in FIGURE 1, the AB, BC and CD portions of the load-displacement curve for the nanoindentation measurement represent the loading, creep and unloading processes, respectively.

Delrin and PVC exhibit the highest hardness of 0.23 and 0.22 GPa, respectively, while LDPE possesses the lowest hardness of 0.026 GPa among the tested polymers. In general, the harder polymers show lower creep rates. The softest LDPE has the highest creep depth of 798 nm, compared to ~120 nm for Delrin.

The creep properties of the polymers are critical when they are used in structural parts. By precisely measuring the hardness and creep of the polymers, a better understanding of the time-dependent reliability of the polymers can be obtained. The creep, change of the displacement at a given load, can also be measured at different elevated temperatures and humidity using the NANOVEA PB1000 Mechanical Tester, providing an ideal tool to quantitatively and reliably measure the viscoelastic mechanical behaviors of polymers
in the simulated realistic application environment.

FIGURE 1: The load vs displacement plots
of different polymers.

FIGURE 2: Creeping at a maximum load of 40 mN for 30 s.

FIGURE 3: Hardness and Young’s modulus of the polymers.

FIGURE 4: Creep depth of the polymers.

CONCLUSION

In this study, we showcased that the NANOVEA PB1000
Mechanical Tester measures the mechanical properties of different polymers, including hardness, Young’s modulus and creep. Such mechanical properties are essential in selecting the proper polymer material for intended applications. Derlin and PVC exhibit the highest hardness of 0.23 and 0.22 GPa, respectively, while LDPE possesses the lowest hardness of 0.026 GPa among the tested polymers. In general, the harder polymers exhibit lower creep rates. The softest LDPE shows the highest creep depth of 798 nm, compared to ~120 nm for Derlin.

The NANOVEA Mechanical Testers provide unmatched multi-function Nano and Micro modules on a single platform. Both the Nano and Micro modules include scratch tester, hardness tester and wear tester modes, providing the wildest and most user-friendly range of testing available on a single system.

NOW, LET'S TALK ABOUT YOUR APPLICATION