Category: Profilometry | Step Height and Thickness
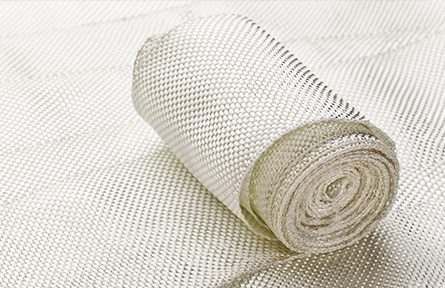
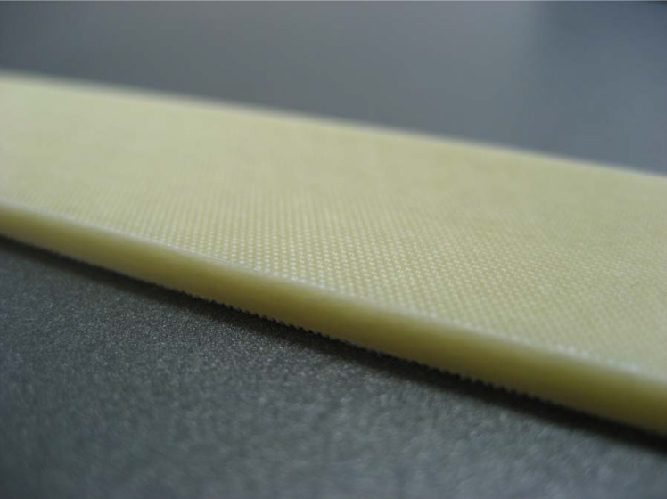
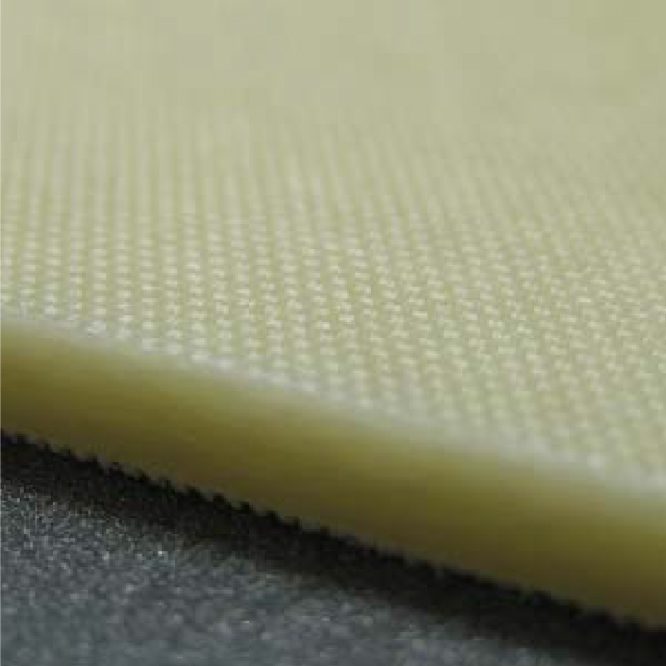
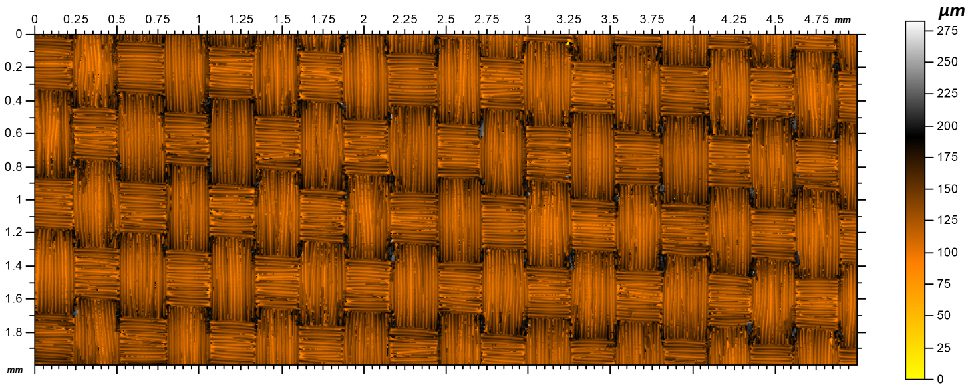
Fiberglass Surface Topography Using 3D Profilometry
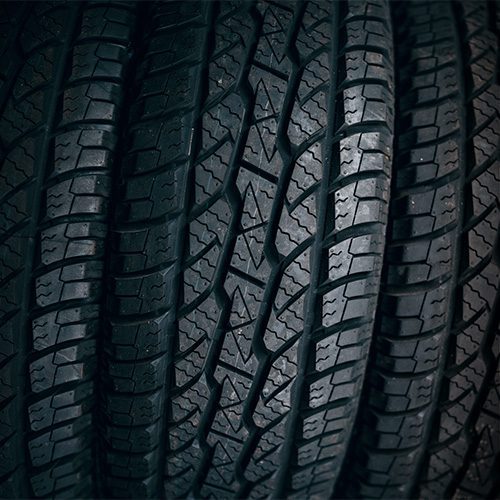
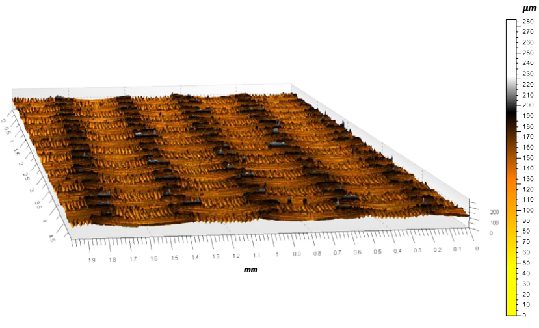
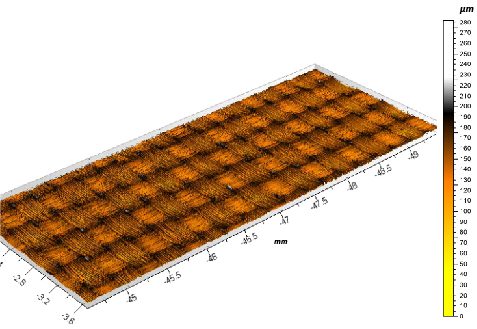
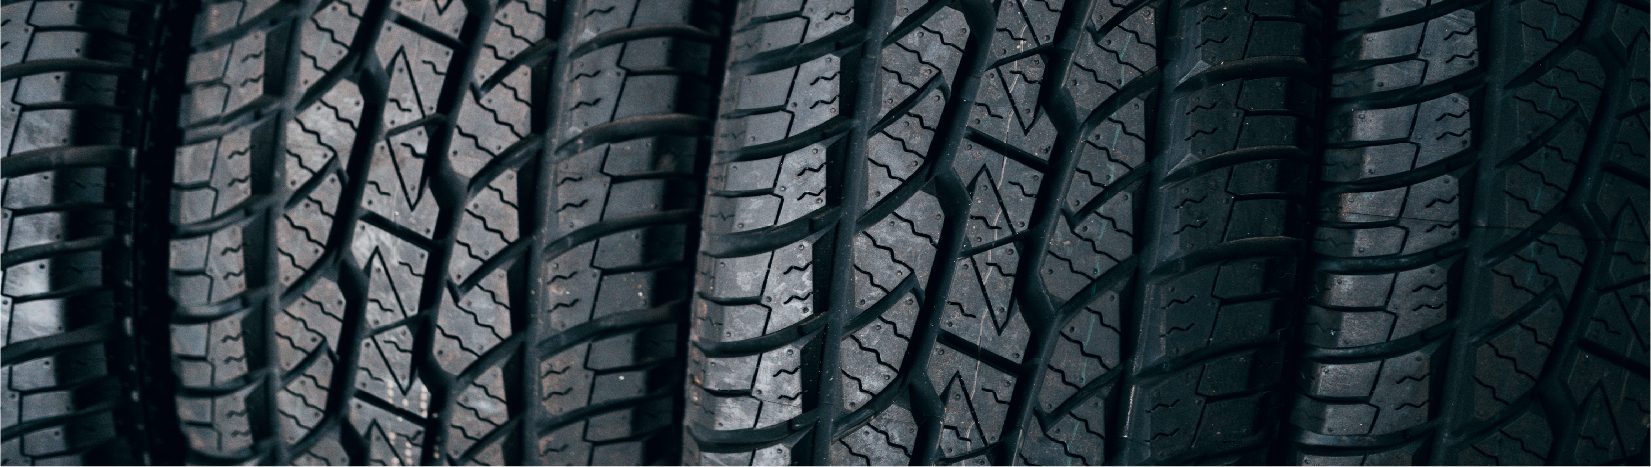
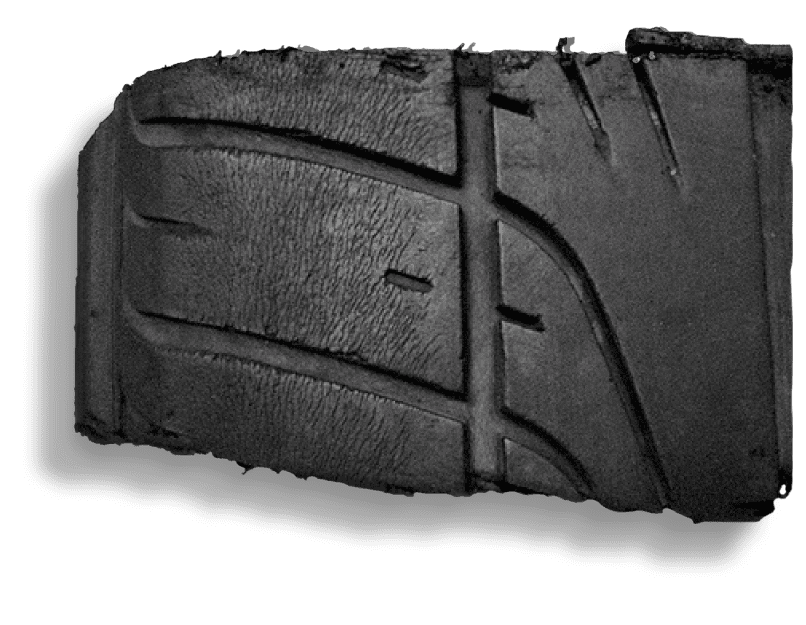
Tire Tread Depth & Rubber Surface Roughness Measurement | 3D Optical Profiler

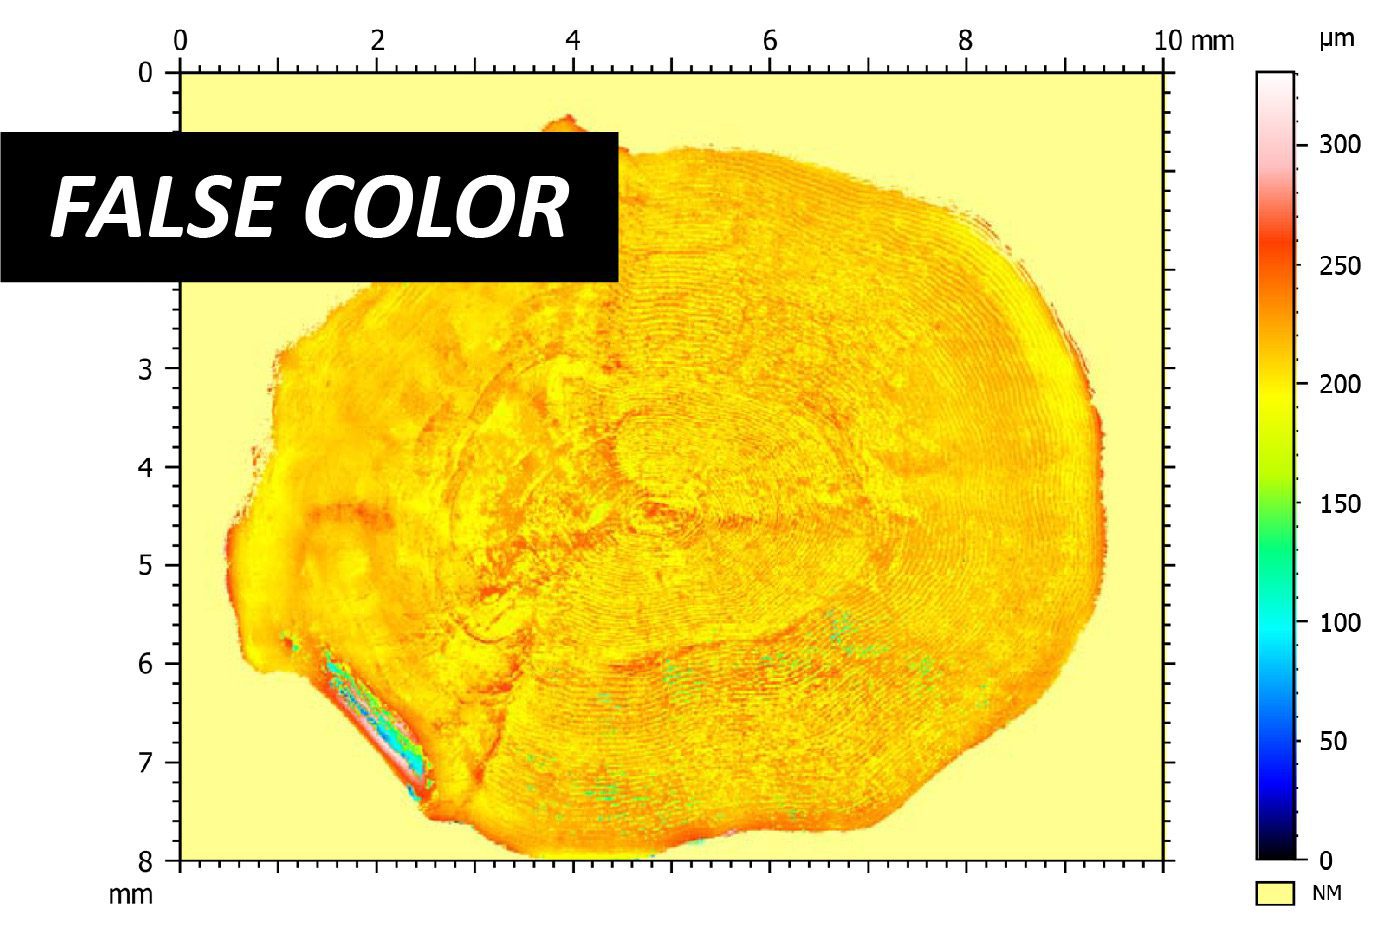
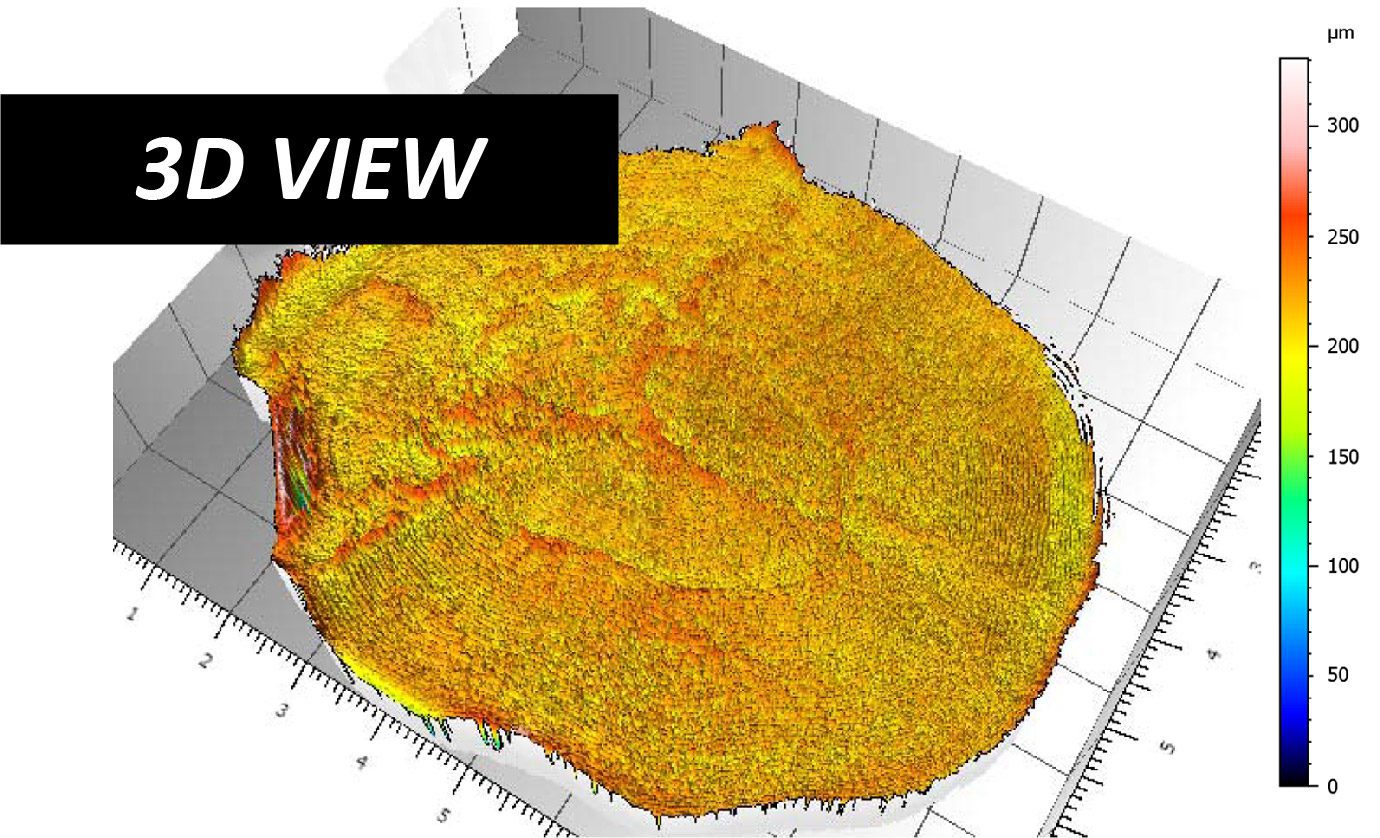
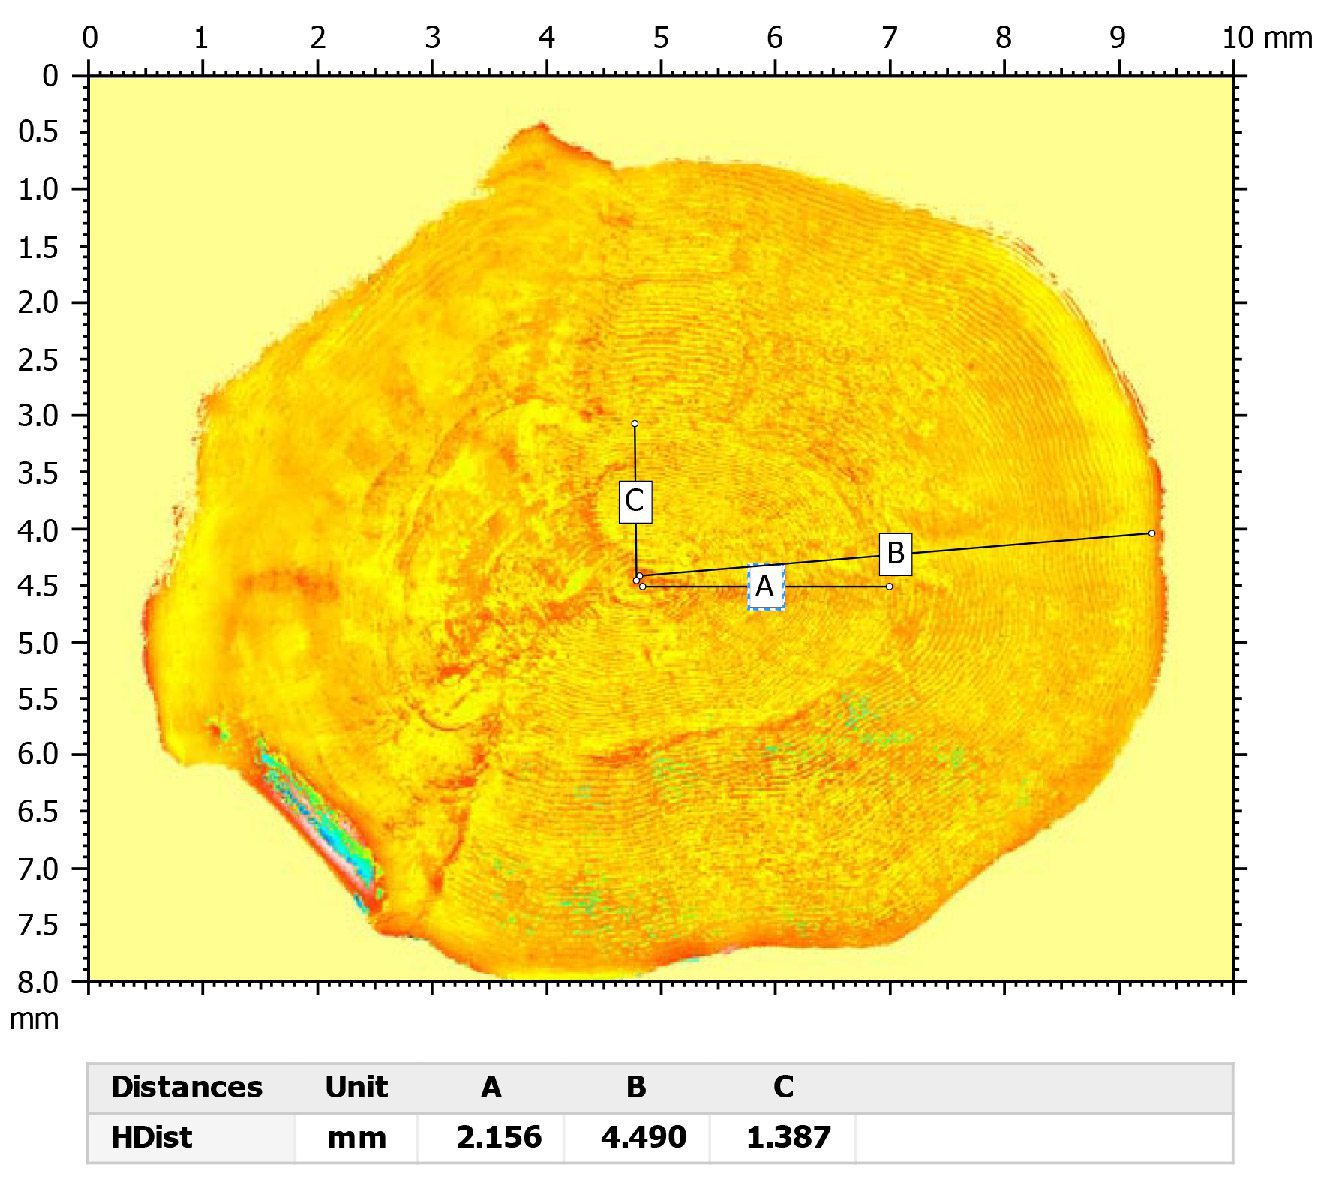
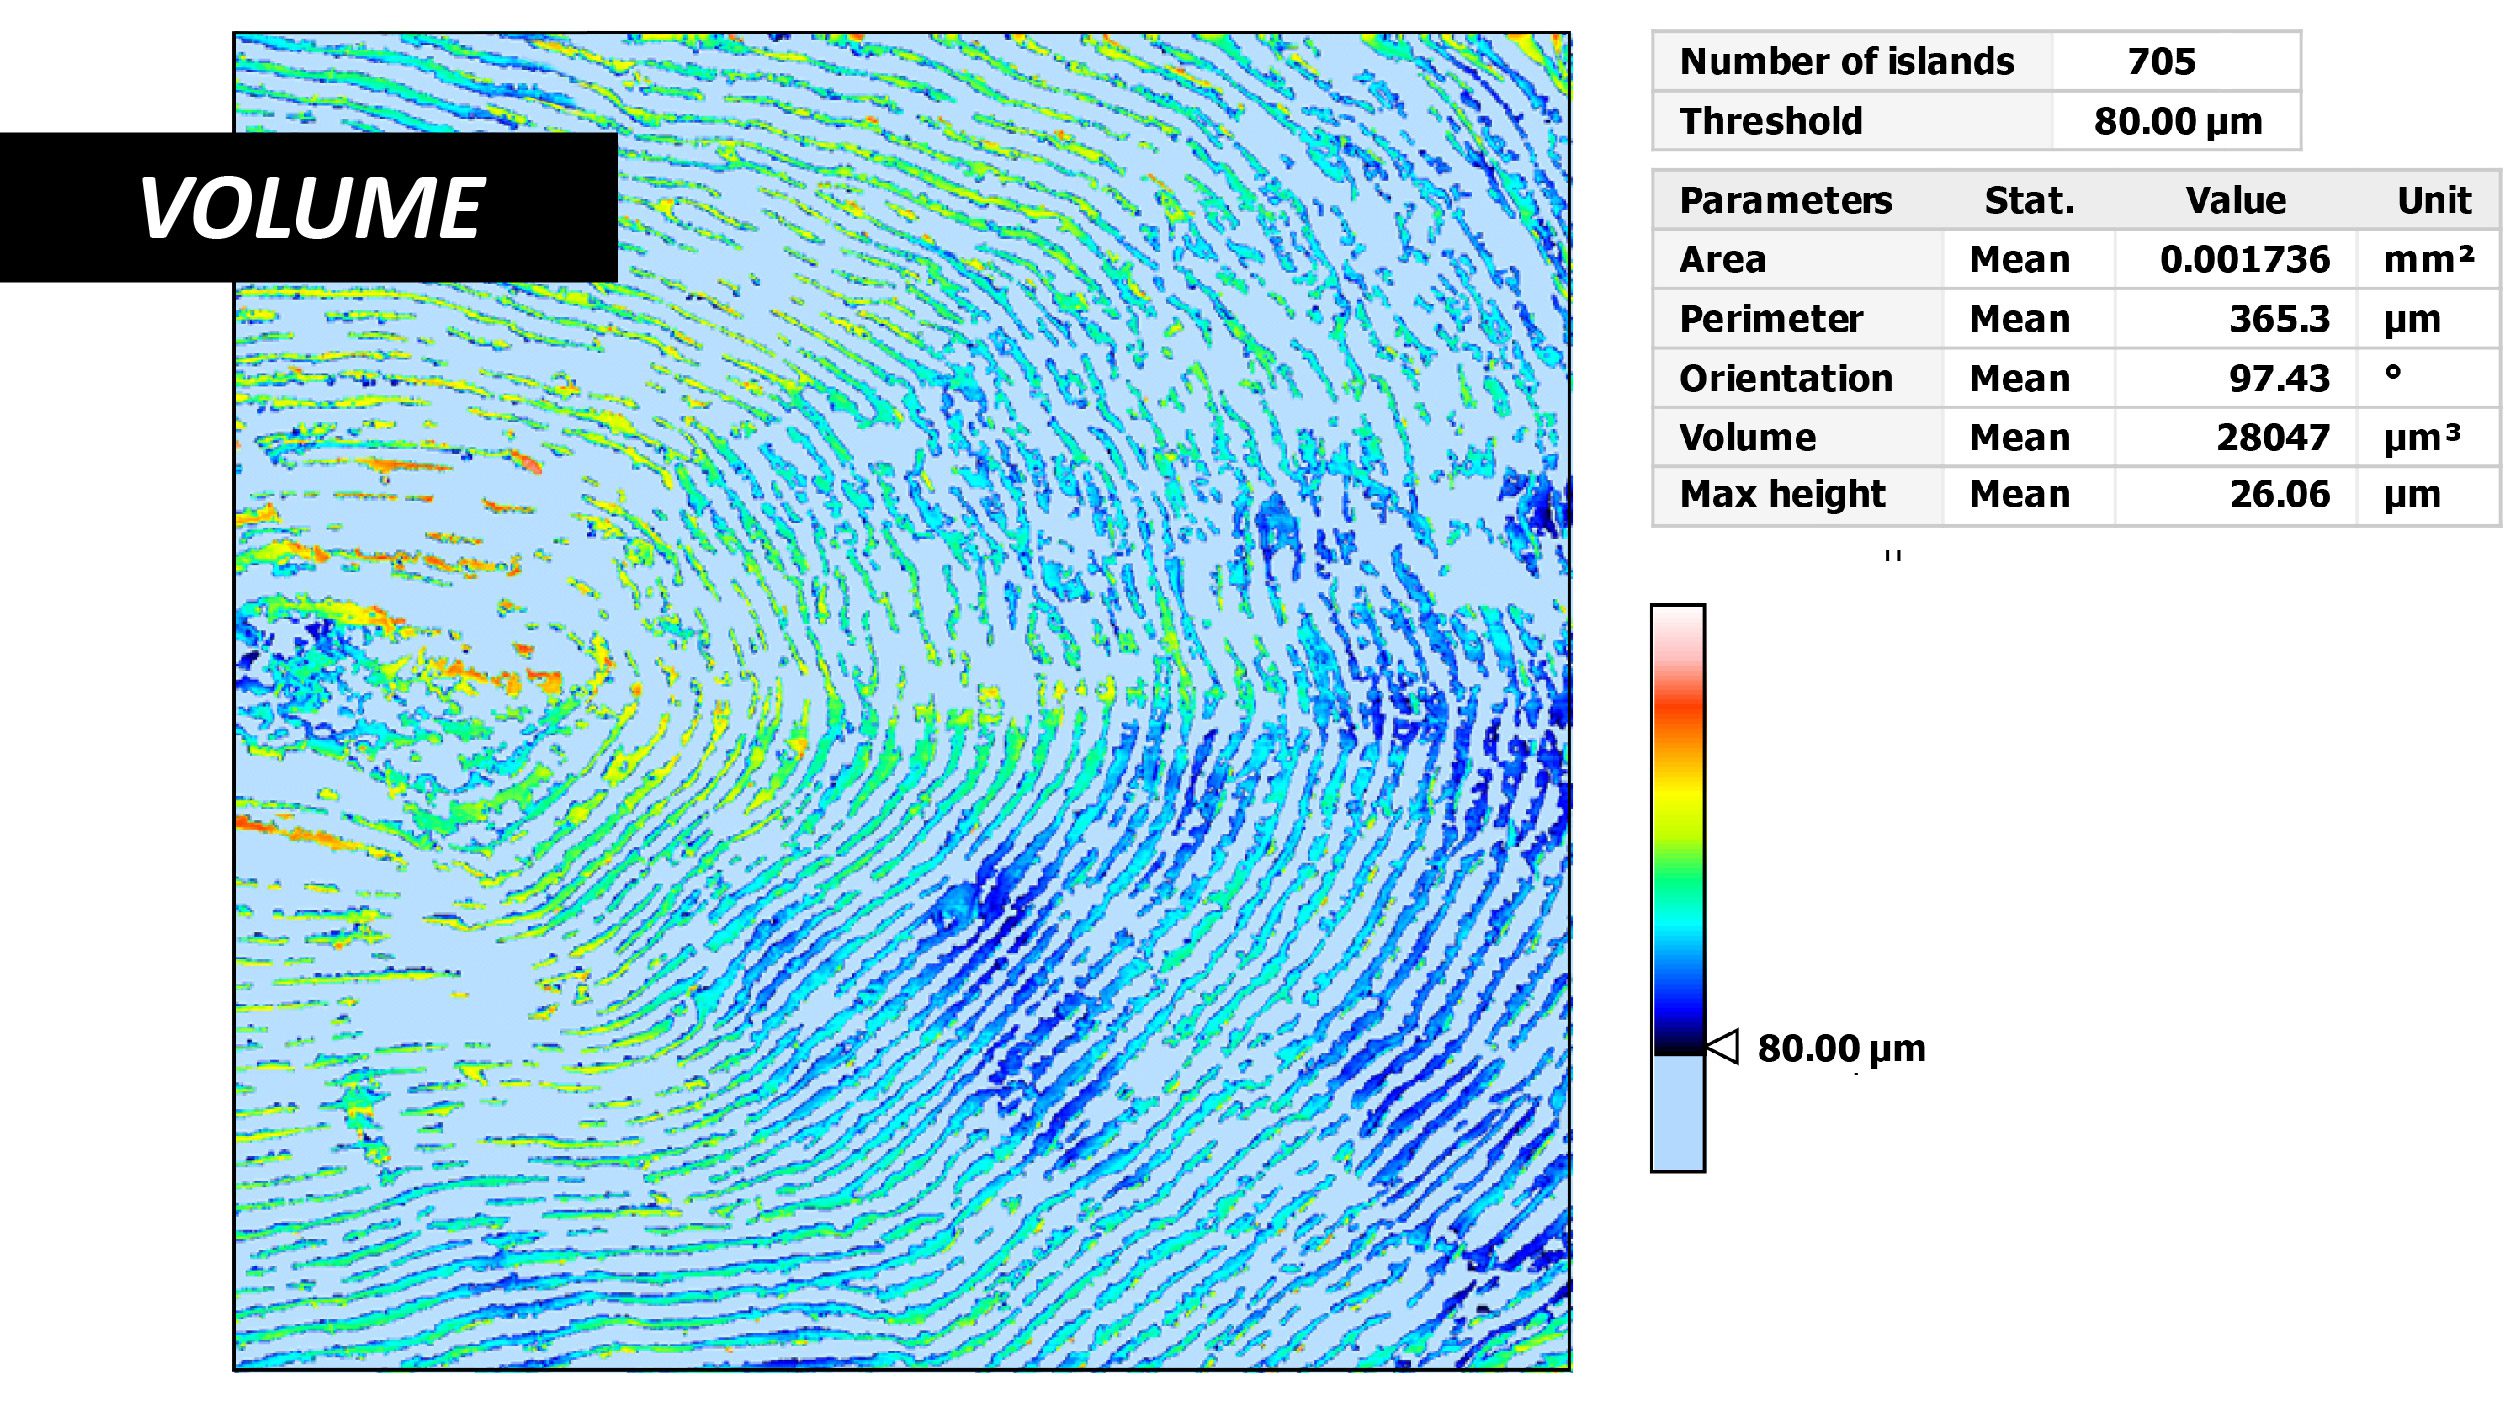
Fish Scale Surface Analysis Using 3D Optical Profiler
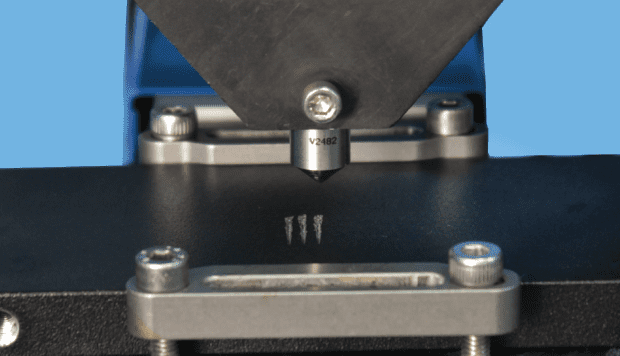
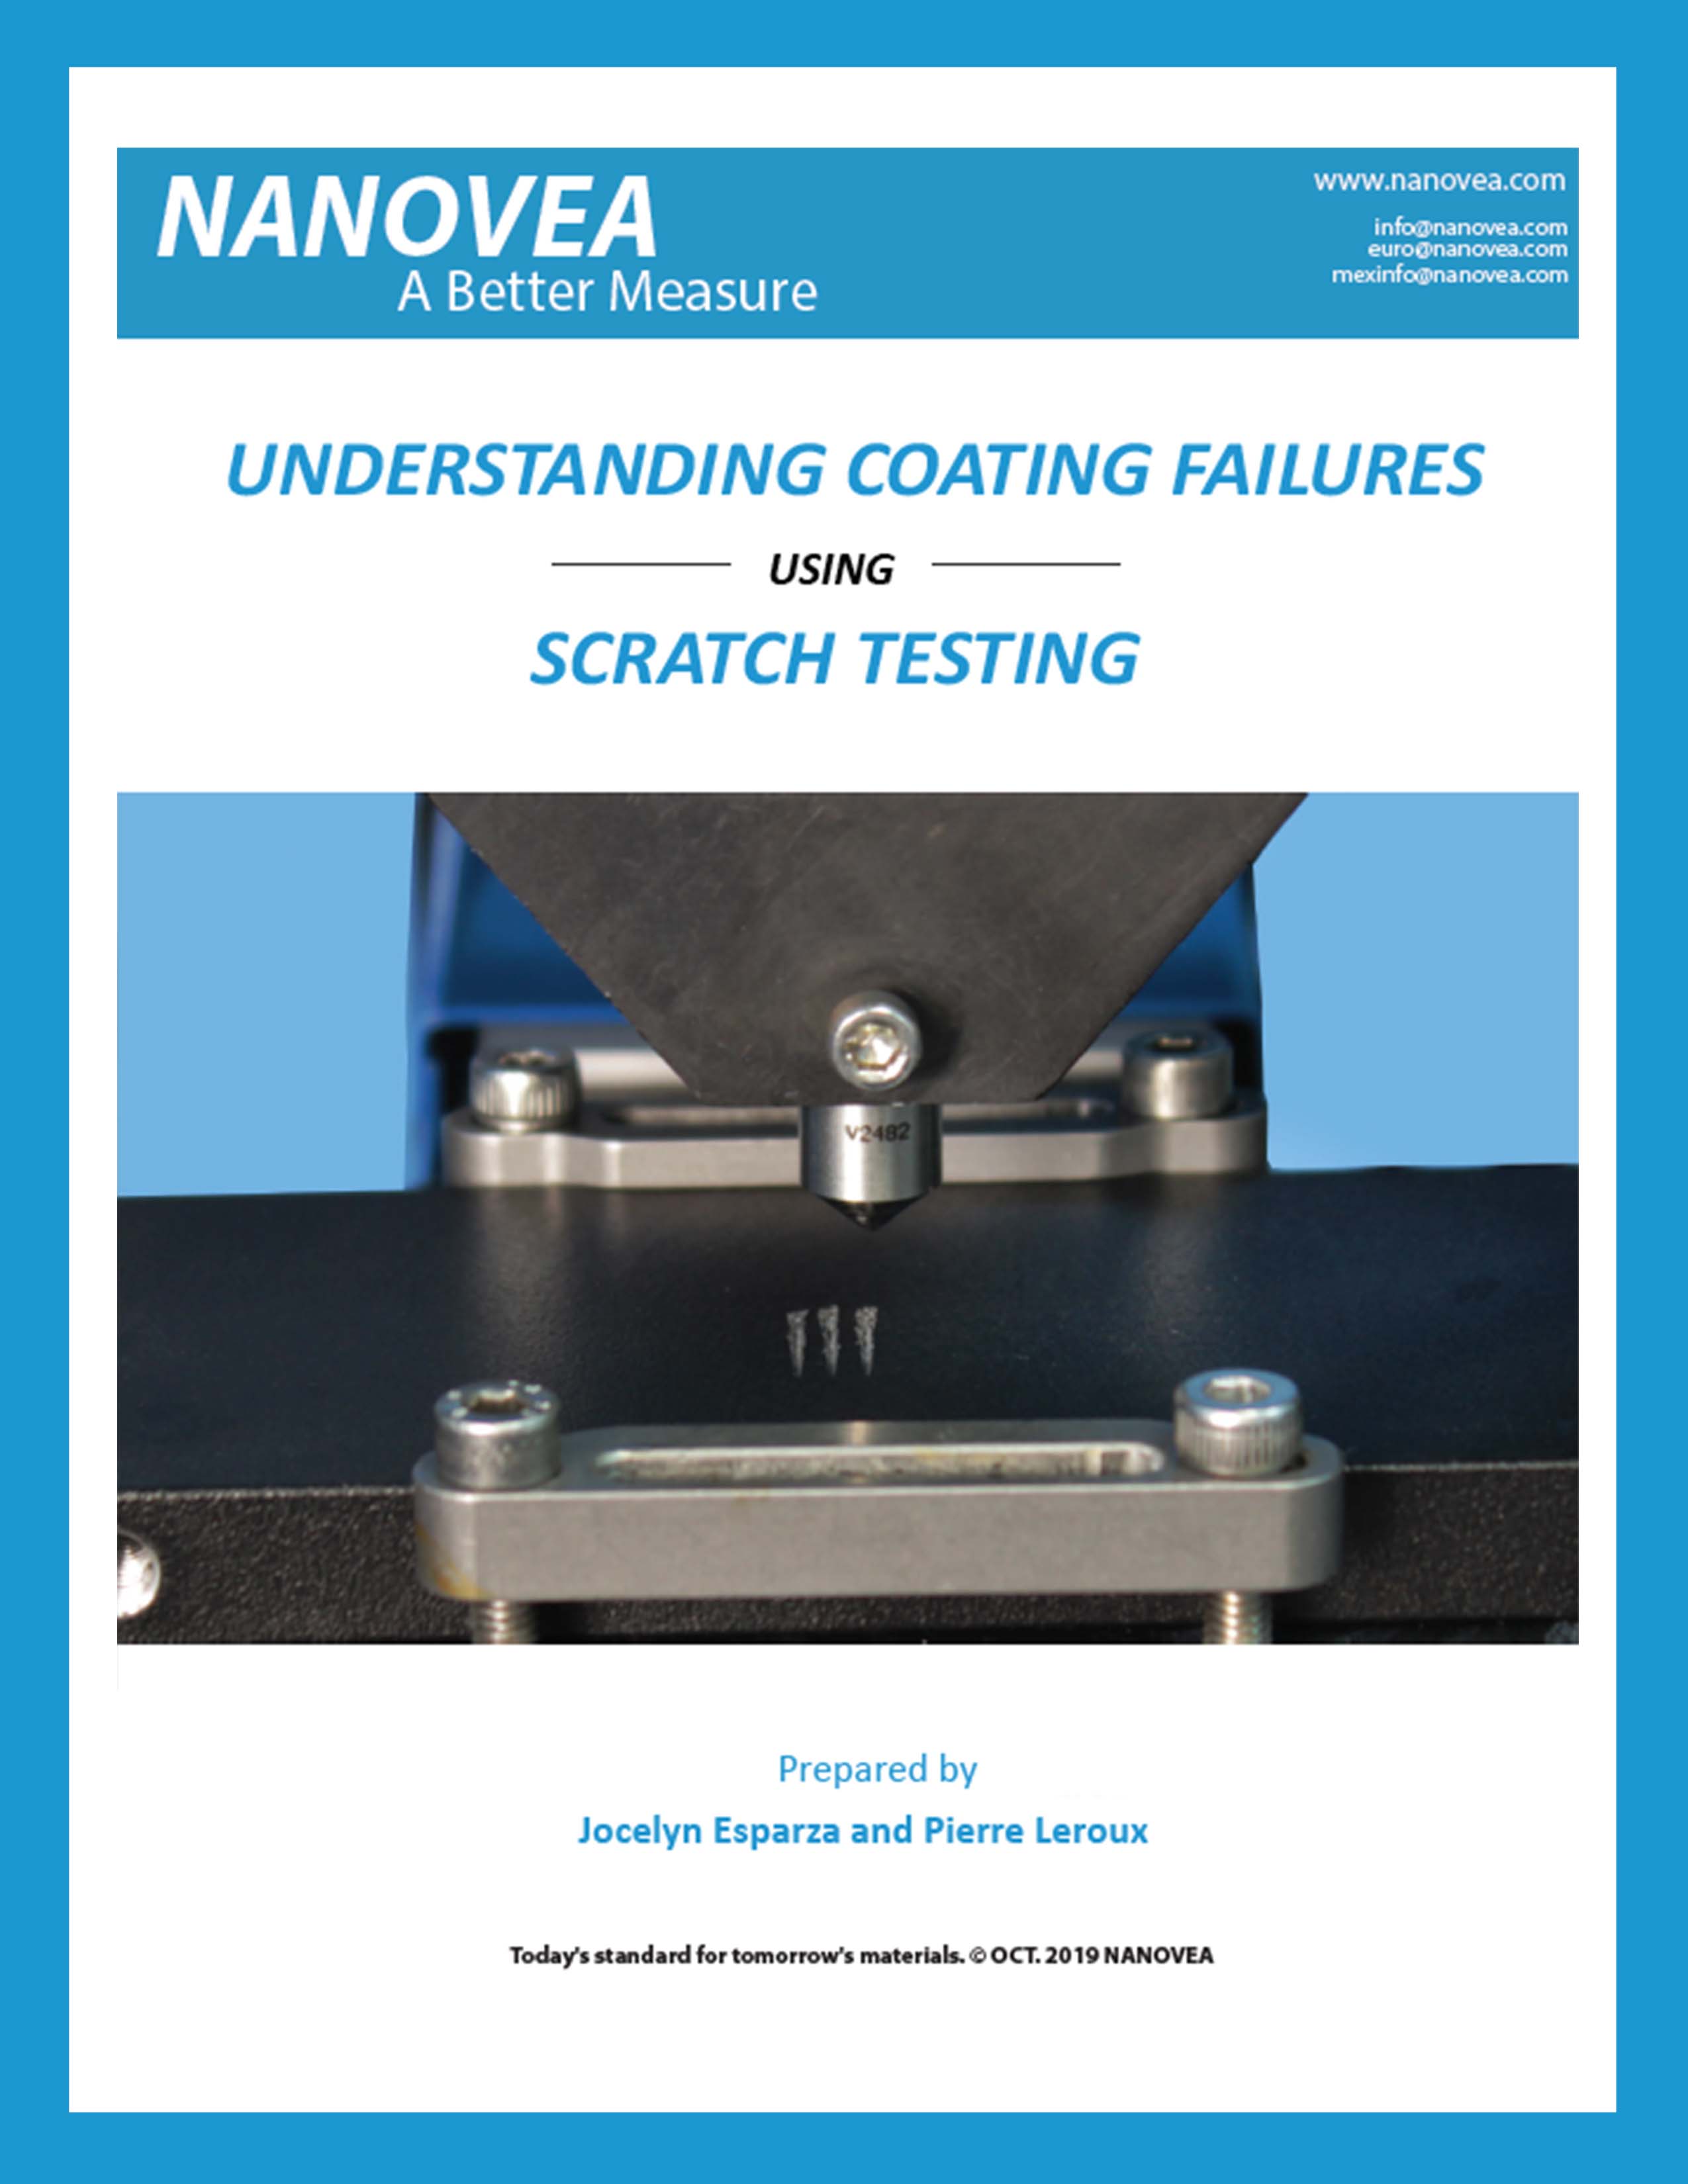
Understanding Coating Failures using Scratch Testing
Introduction:
Surface engineering of materials plays a significant role in a variety of functional applications, ranging from decorative appearance to protecting the substrates from wear, corrosion and other forms of attacks. An important and overriding factor that determines the quality and service lifetime of the coatings is their cohesive and adhesive strength.
Click here to read!

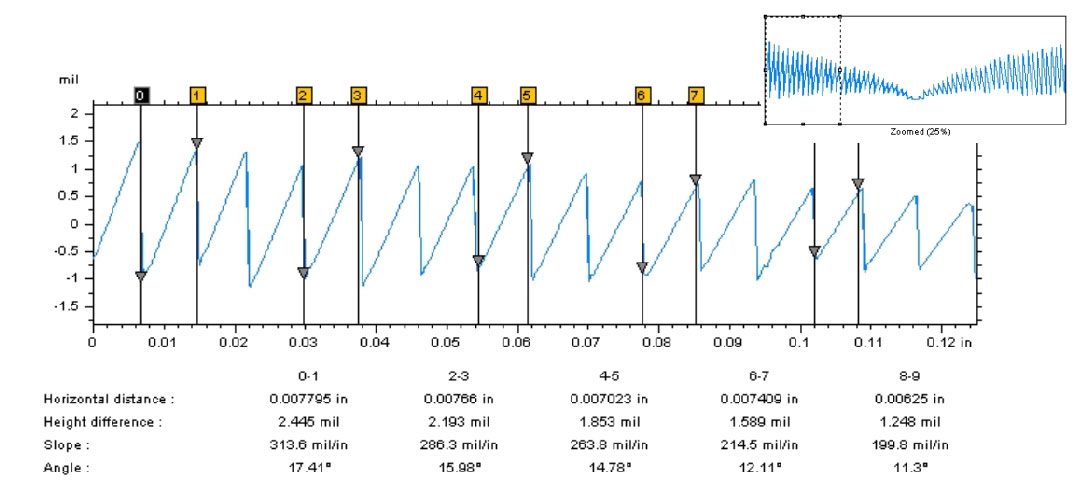
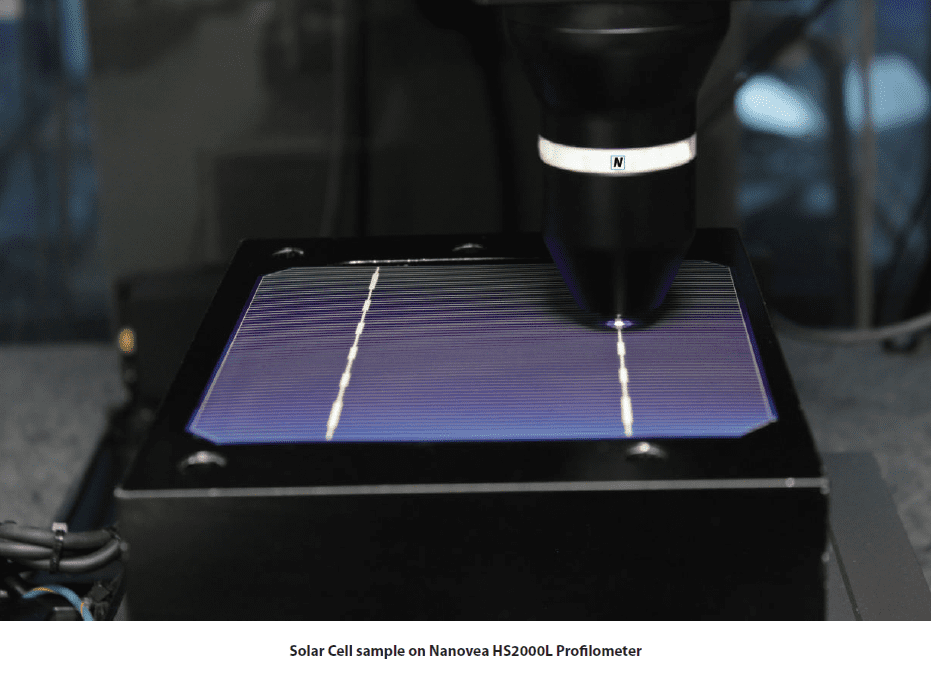
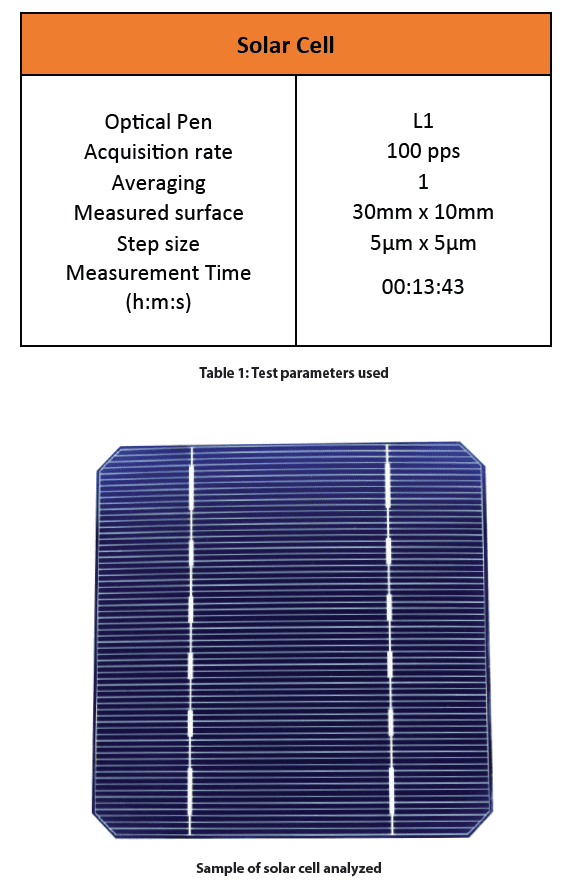
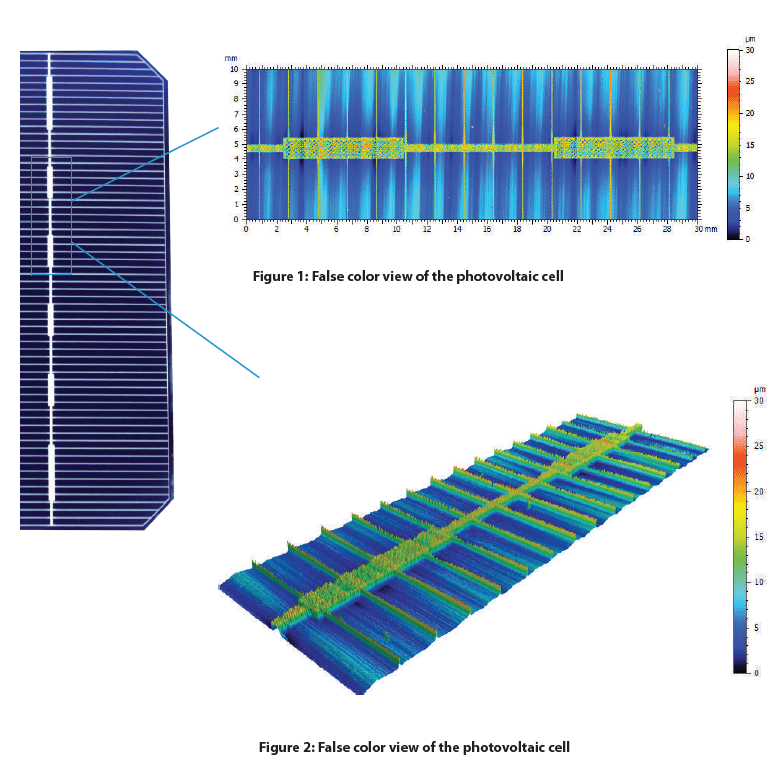
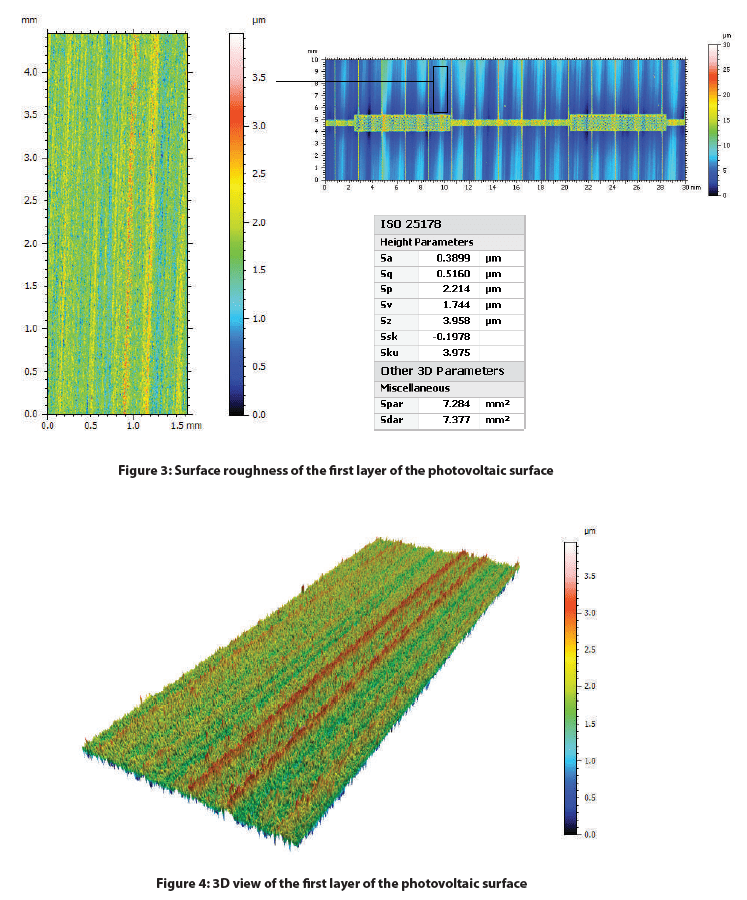
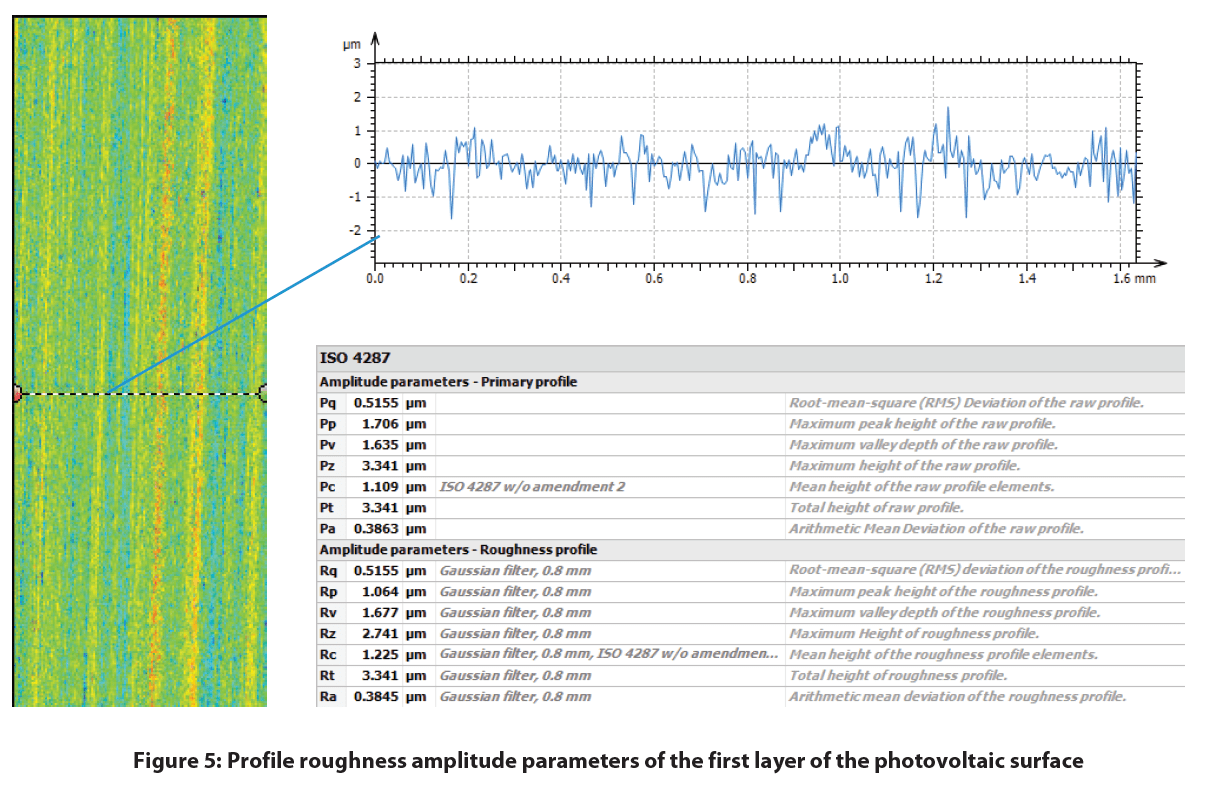
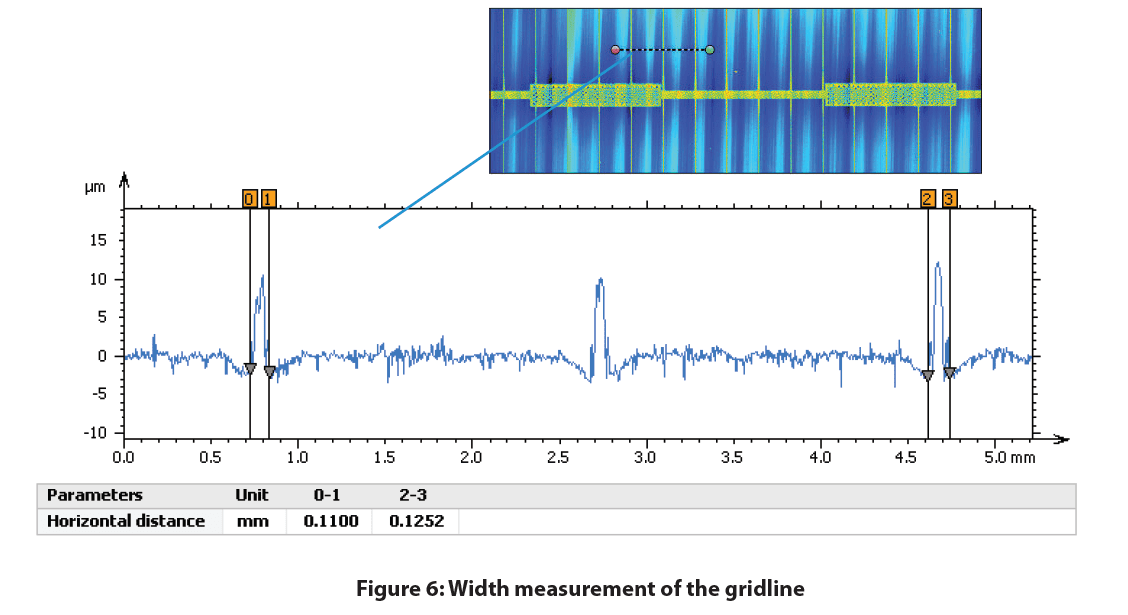
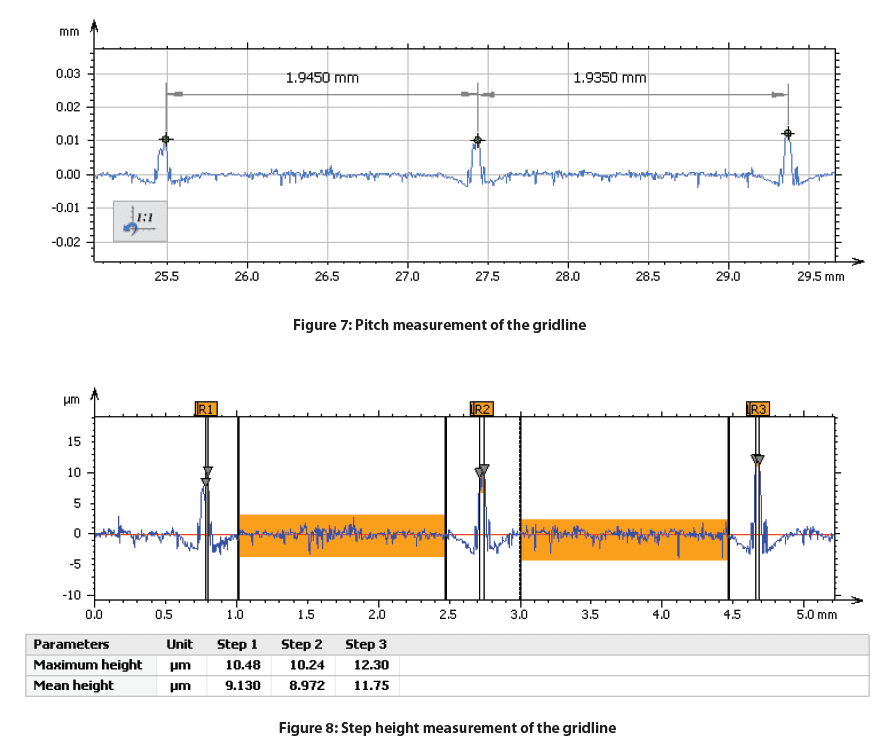
Surface Roughness and Features of a Solar Cell
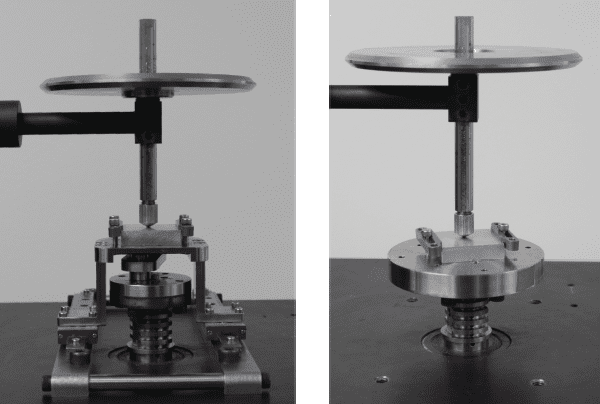
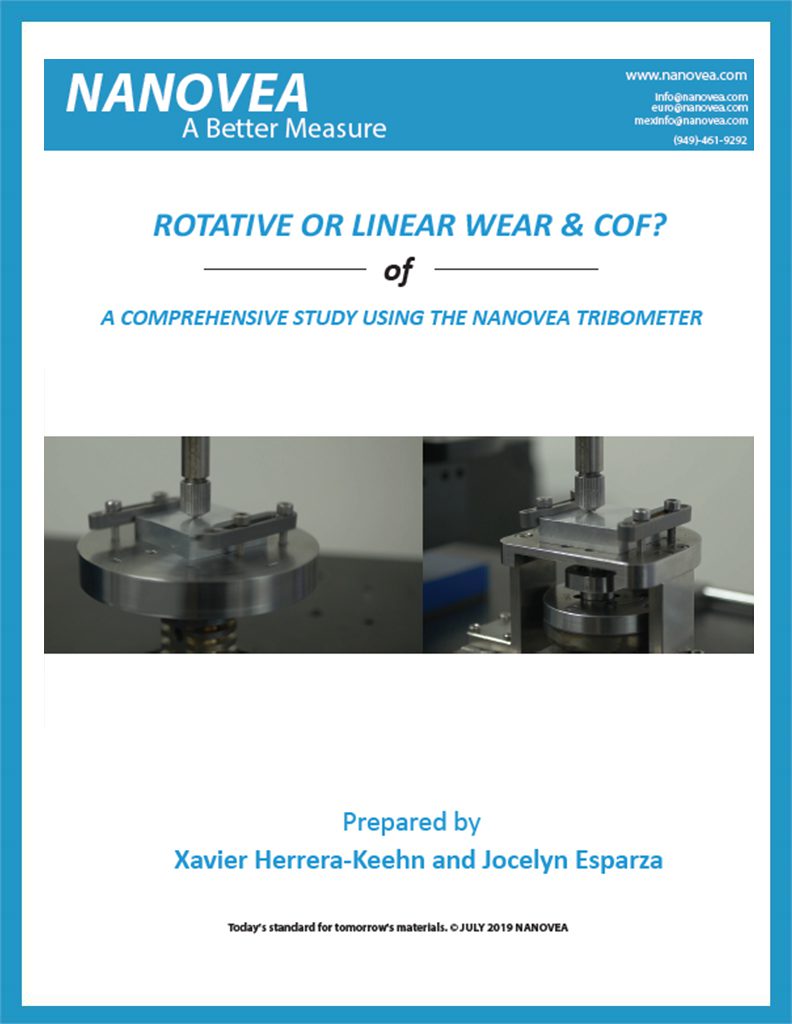
Rotative or Linear Wear & COF? (A Comprehensive Study Using the Nanovea Tribometer)
Wear is the process of removal and deformation of material on a surface as a result of the mechanical action of the opposite surface. It is influenced by a variety of factors, including unidirectional sliding, rolling, speed, temperature, and many others. The study of wear, tribology, spans many disciplines, from physics and chemistry to mechanical engineering and material science. The complex nature of wear requires isolated studies toward specific wear mechanisms or processes, such as adhesive wear, abrasive wear, surface fatigue, fretting wear, and erosive wear. However, “Industrial Wear” commonly involves multiple wear mechanisms occurring in synergy.
Linear reciprocating and Rotative (Pin on Disk) wear tests are two widely used ASTM-compliant setups for measuring sliding wear behaviors of materials. Since the wear rate value of any wear test method is often used to predict the relative ranking of material combinations, it is extremely important to confirm the repeatability of the wear rate measured using different test setups. This enables users to carefully consider the wear rate value reported in the literature, which is critical in understanding the tribological characteristics of materials.
Read More!
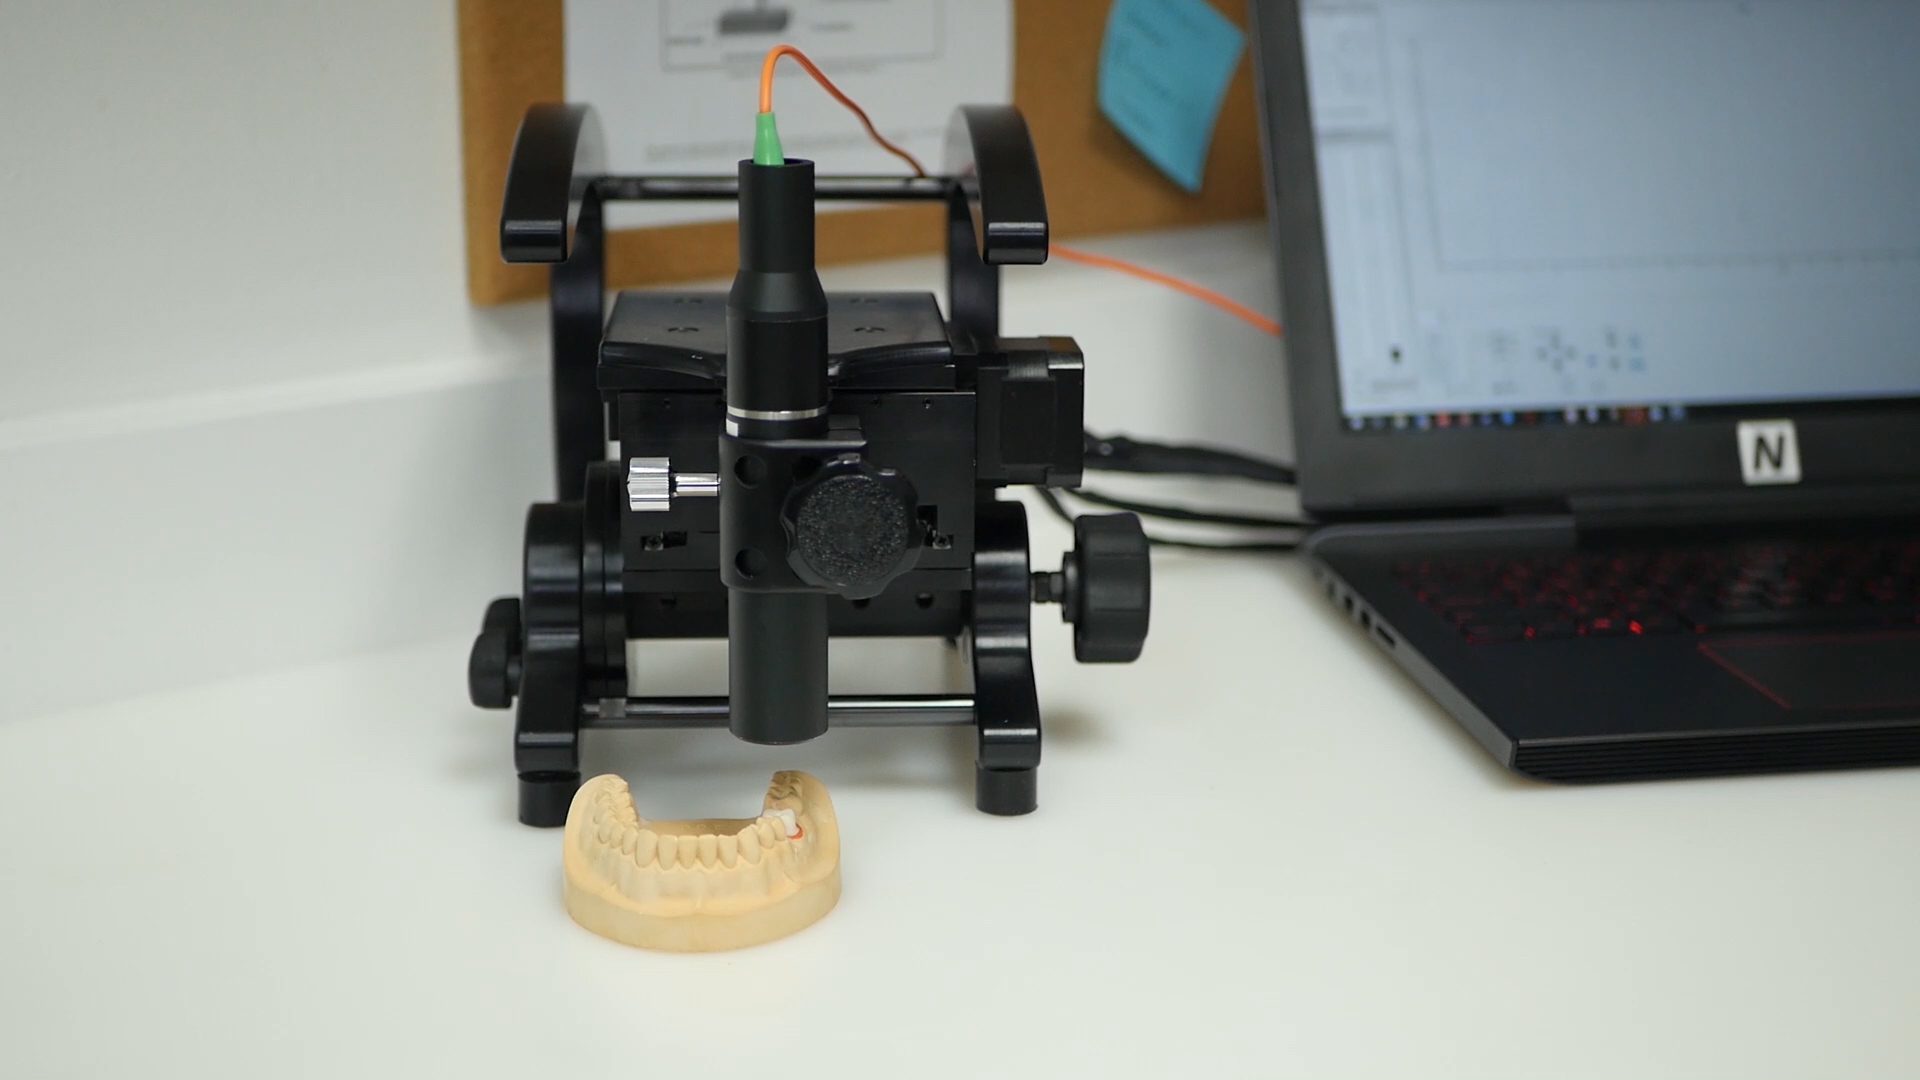
Portability and Flexibility of the Jr25 3D Non-contact Profilometer

500nm Glass Step Height: Extreme Accuracy with Non-Contact Profilometry
Surface characterization are current topics undergoing intense study. The surfaces of materials are important since they are the regions where physical and chemical interactions between the material and environment occur. Thus, being able to image the surface with high resolution has been desirable, since it allows scientists to visually observe the smallest surface details. Common surface imaging data includes topography, roughness, lateral dimensions, and vertical dimensions. Identifying the load bearing surface, spacing and step height of fabricated microstructures, and defects on the surface are some applications that can be obtained from surface imaging. All surface imaging techniques, however, are not created equal.
500nm Glass Step Height: Extreme Accuracy with Non-Contact Profilometry
Wafer Coating Thickness Measurement Using 3D Profilometry
Wafer Coating Thickness Measurement is critical. Silicon wafers are widely used in the making of integrated circuits and other micro devices used in a vast number of industries. A constant demand for thinner and smoother wafers and wafer coatings makes the Nanovea 3D non-contact Profilometer a great tool to quantify coating thickness and roughness of just about any surface. The measurements in this article were taken from a coated wafer sample in order to demonstrate the capabilities of our 3D Non-Contact Profilometer.
Wafer Coating Thickness Measurement Using 3D Profilometry