Monthly Archives: February 2021
Tire Tread Depth & Rubber Surface Roughness Measurement | 3D Optical Profiler
TIRE TREAD DEPTH & RUBBER SURFACE ROUGHNESS MEASUREMENT using 3D Optical Profiler
Prepared by
ANDREA HERRMANN
While tire tread depth is commonly measured with handheld gauges for consumer safety, industrial R&D and tire manufacturers require more advanced methods. This application note demonstrates how a 3D optical profilometer provides precise tire tread depth measurement, contour mapping, and rubber surface roughness analysis for high-accuracy studies.
INTRODUCTION
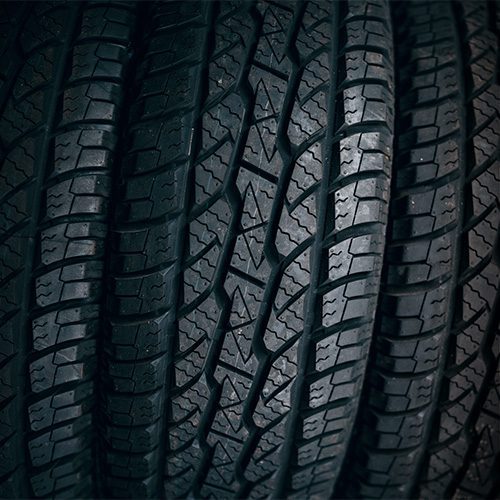
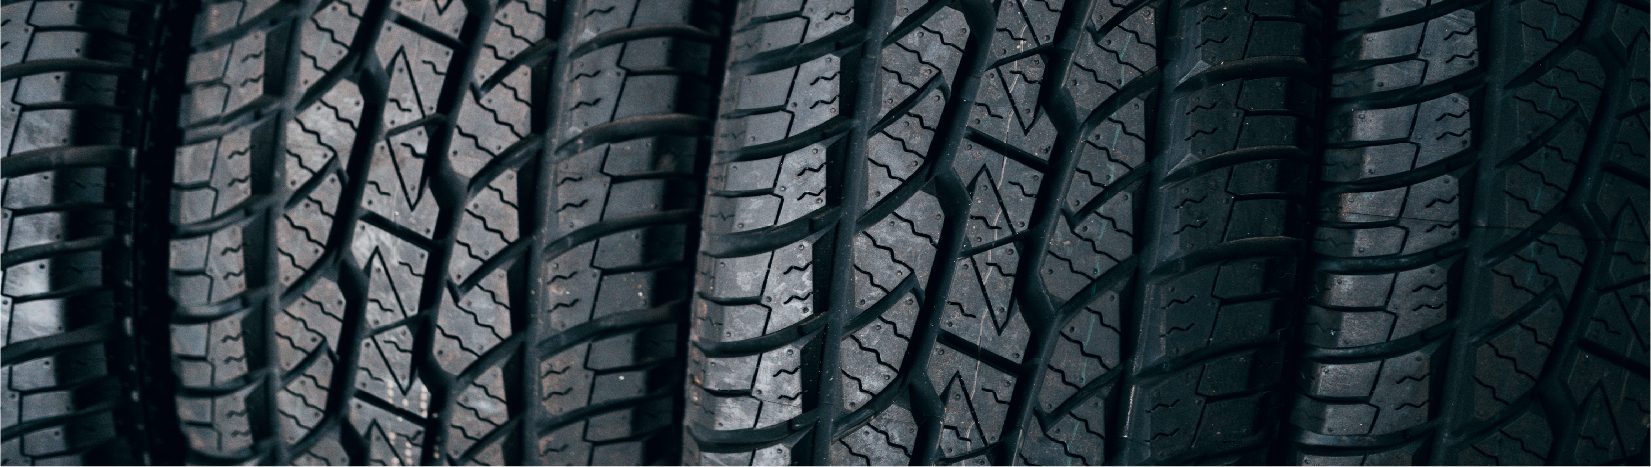
Like all materials, rubber’s coefficient of friction is related in part to its surface roughness. In vehicle tires, both tread depth and surface roughness directly affect traction, braking, and wear performance. In this study, the rubber surface and tread’s roughness and dimensions are analyzed using 3D non-contact profilometry.
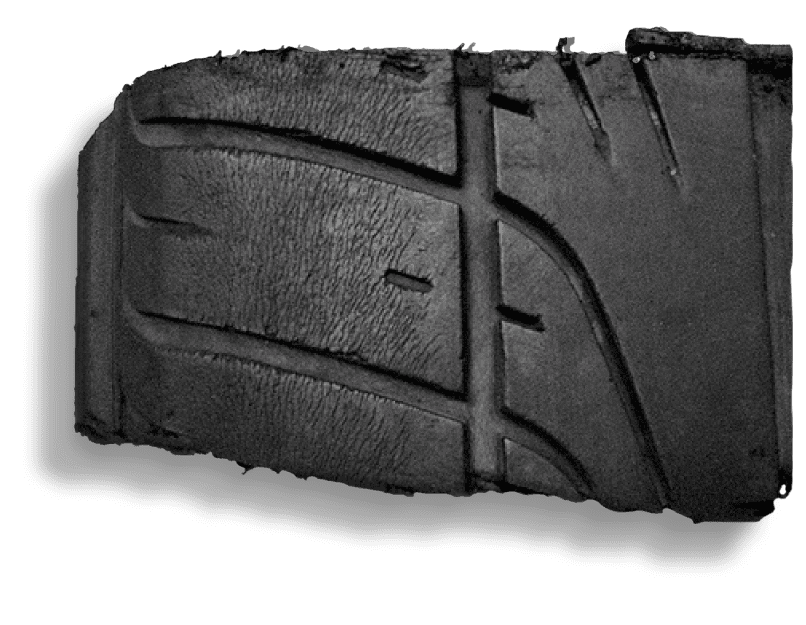
THE SAMPLE
IMPORTANCE OF 3D NON-CONTACT PROFILOMETRY FOR TIRE TREAD DEPTH MEASUREMENT
Unlike other techniques such as touch probes or interferometry, NANOVEA’s 3D Non-Contact Optical Profilers use axial chromatism to measure nearly any surface.
The Profiler system’s open staging allows for a wide variety of sample sizes and requires zero sample preparation. With a single scan, users can capture both overall tire tread depth and micro-level surface roughness, with zero influence from sample reflectivity or absorption. Plus, these profilers have the advanced ability to measure high surface angles without requiring software manipulation of results.
This versatility makes NANOVEA profilers ideal for both tire tread wear testing and advanced rubber material research.
MEASUREMENT OBJECTIVE
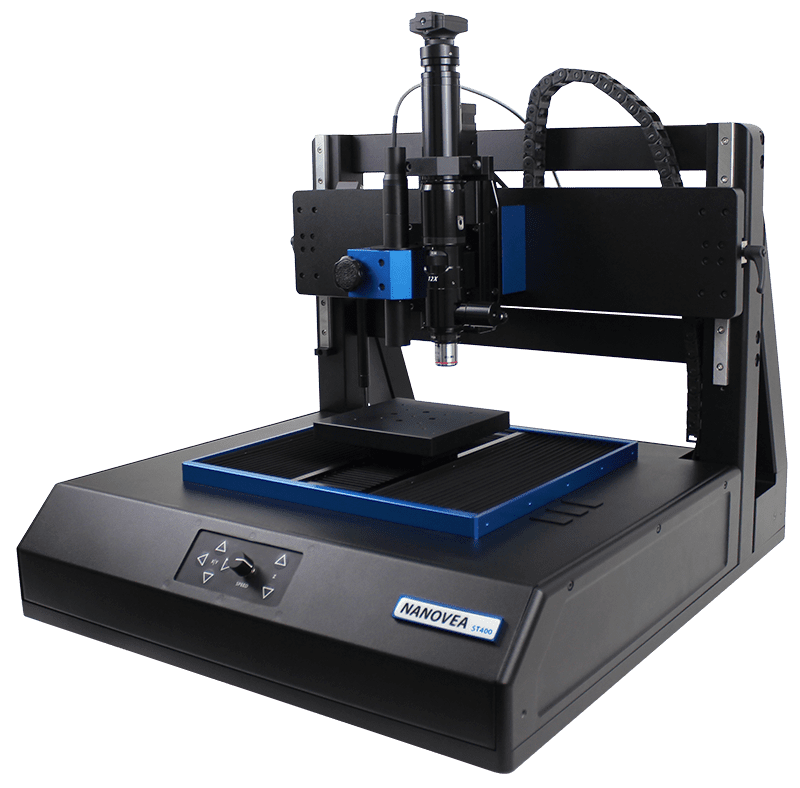
In this application, we showcase the NANOVEA ST400, a 3D Non-Contact Optical Profiler measuring tire tread depth, contour geometry, and rubber surface roughness. A sample surface area large enough to represent the entire tire surface was selected at random for this study. To quantify the rubber’s characteristics, we used the NANOVEA Ultra 3D analysis software to measure groove dimensions, tread depth, surface roughness, and developed vs. projected area.
NANOVEA ST400 Standard
Optical 3D Profilometer
ANALYSIS: TIRE TREAD
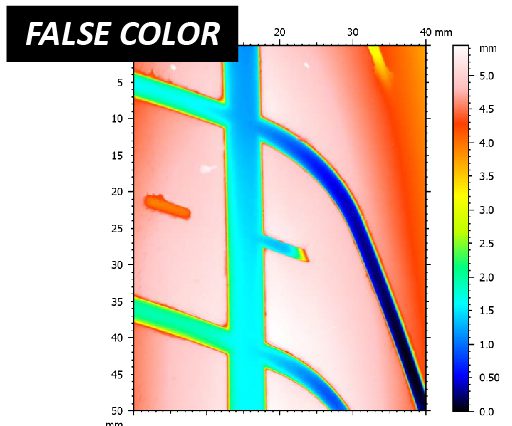
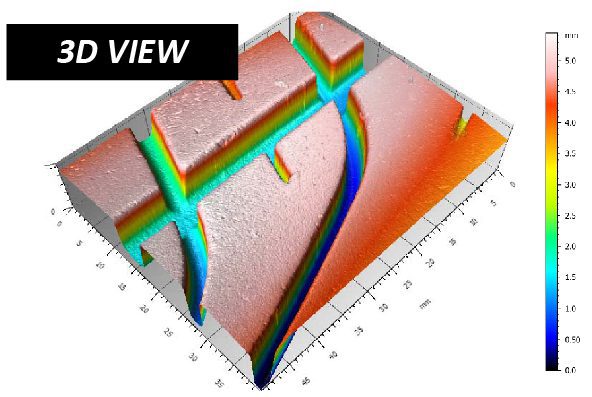
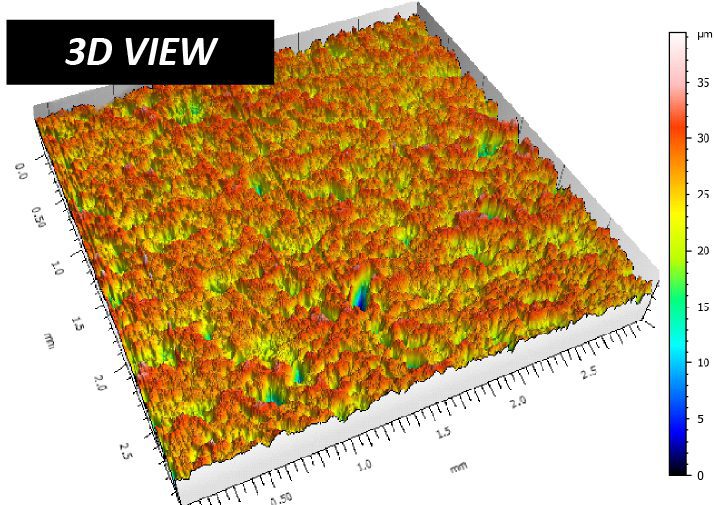
The 3D View and False Color View of the treads show the value of mapping 3D surface designs. This provides engineers with a straightforward tool to evaluate tread depth uniformity, groove design, and wear from multiple angles. The Advanced Contour Analysis and Step Height Analysis are both extremely powerful tools for measuring precise dimensions of sample shapes and design.
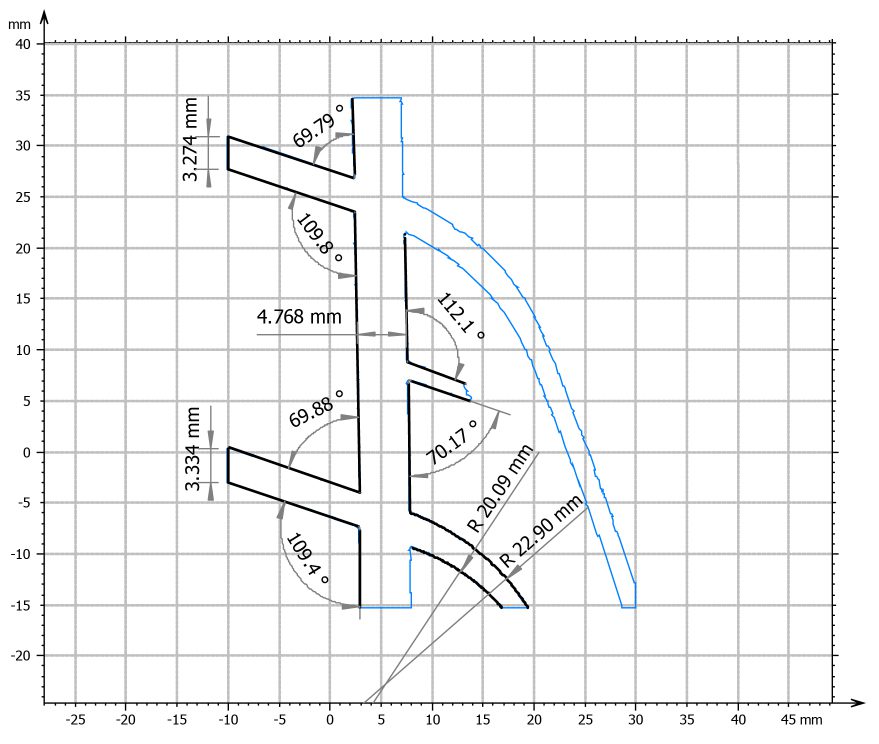
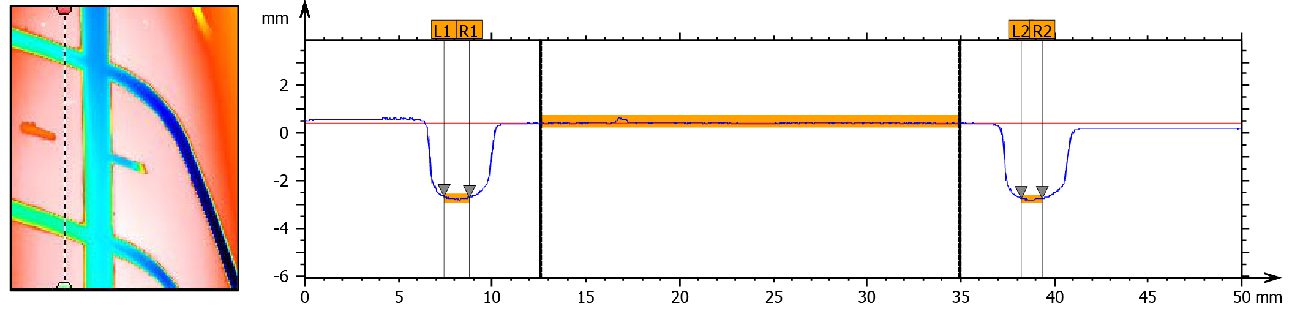
ADVANCED CONTOUR ANALYSIS
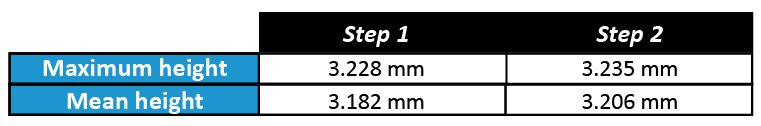
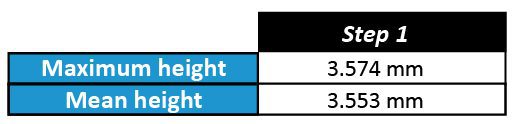
STEP HEIGHT ANALYSIS
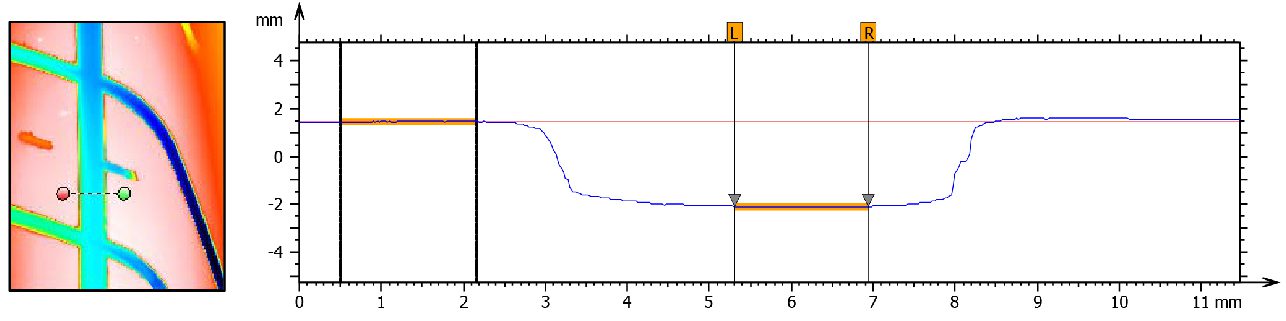
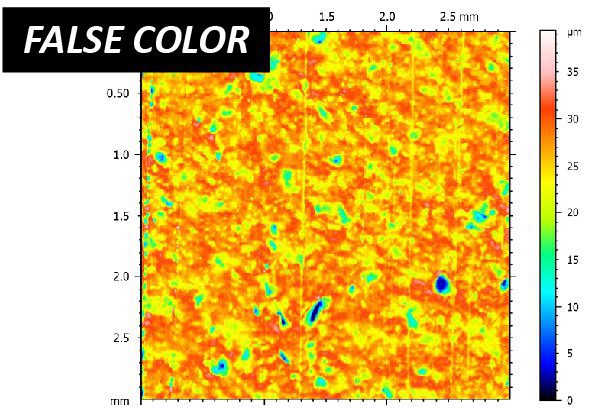
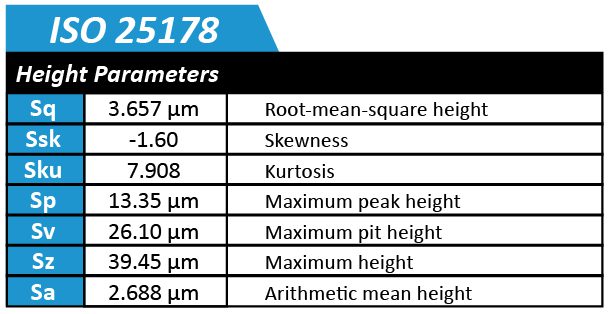
ANALYSIS: RUBBER SURFACE
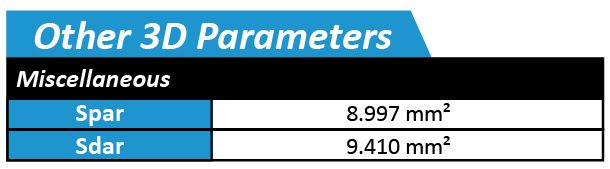
The rubber surface can be quantified in numerous ways using built-in software tools as shown in the following figures. It can be observed that the surface roughness is 2.688 μm, and the developed area vs. projected area is 9.410 mm² vs. 8.997 mm². These results demonstrate how rubber surface roughness affects traction and performance, enabling comparisons between different rubber formulations or varying levels of surface wear.
CONCLUSION
In this application, we have shown how the NANOVEA 3D Non-Contact Optical Profiler can precisely characterize tire tread depth, contour dimensions, and rubber surface roughness. The data shows a surface roughness of 2.69 µm and a developed area of 9.41 mm² with a projected area of 9 mm². Various dimensions and radii of the rubber treads were measured as well. This information can be used by tire manufacturers, automotive researchers, and materials engineers to compare tread designs, rubber formulations, or tires with varying degrees of wear. The data shown here represents only a portion of the calculations available in the Ultra 3D analysis software.
Categories
- Application Notes
- Block on Ring Tribology
- Corrosion Tribology
- Friction Testing | Coefficient of Friction
- High Temperature Mechanical Testing
- High Temperature Tribology
- Humidity and Gases Tribology
- Humidity Mechanical Testing
- Indentation | Creep and Relaxation
- Indentation | Fracture Toughness
- Indentation | Hardness and Elastic
- Indentation | Loss and Storage
- Indentation | Stress vs Strain
- Indentation | Yield Strength and Fatigue
- Laboratory Testing
- Linear Tribology
- Liquid Mechanical Testing
- Liquid Tribology
- Low Temperature Tribology
- Mechanical Testing
- Press Release
- Profilometry | Flatness and Warpage
- Profilometry | Geometry and Shape
- Profilometry | Roughness and Finish
- Profilometry | Step Height and Thickness
- Profilometry | Texture and Grain
- Profilometry | Volume and Area
- Profilometry Testing
- Ring on Ring Tribology
- Rotational Tribology
- Scratch Testing | Adhesive Failure
- Scratch Testing | Cohesive Failure
- Scratch Testing | Multi-Pass Wear
- Scratch Testing | Scratch Hardness
- Scratch Testing Tribology
- Tribology Testing
- Uncategorized
Archives
- June 2026
- May 2026
- March 2026
- November 2025
- September 2023
- August 2023
- June 2023
- May 2023
- July 2022
- May 2022
- April 2022
- January 2022
- December 2021
- November 2021
- October 2021
- September 2021
- August 2021
- July 2021
- June 2021
- May 2021
- March 2021
- February 2021
- December 2020
- November 2020
- October 2020
- September 2020
- July 2020
- May 2020
- April 2020
- March 2020
- February 2020
- January 2020
- November 2019
- October 2019
- September 2019
- August 2019
- July 2019
- June 2019
- May 2019
- April 2019
- March 2019
- January 2019
- December 2018
- November 2018
- October 2018
- September 2018
- July 2018
- June 2018
- April 2018
- March 2018
- February 2018
- November 2017
- October 2017
- September 2017
- August 2017
- June 2017
- May 2017
- March 2017
- February 2017
- January 2017
- November 2016
- October 2016
- August 2016
- July 2016
- June 2016
- May 2016
- April 2016
- March 2016
- February 2016
- January 2016
- December 2015
- November 2015
- October 2015
- September 2015
- August 2015
- July 2015
- June 2015
- May 2015
- April 2015
- March 2015
- February 2015
- January 2015
- November 2014
- October 2014
- September 2014
- August 2014
- July 2014
- June 2014
- May 2014
- April 2014
- March 2014
- February 2014
- January 2014
- December 2013
- November 2013
- October 2013
- September 2013
- August 2013
- July 2013
- June 2013
- May 2013
- April 2013
- March 2013
- February 2013
- January 2013
- December 2012
- November 2012
- October 2012
- September 2012
- August 2012
- July 2012
- June 2012
- May 2012
- April 2012
- March 2012
- February 2012
- January 2012
- December 2011
- November 2011
- October 2011
- September 2011
- August 2011
- July 2011
- June 2011
- May 2011
- November 2010
- January 2010
- April 2009
- March 2009
- January 2009
- December 2008
- October 2008
- August 2007
- July 2006
- March 2006
- January 2005
- April 2004


