USA/GLOBAL: +1-949-461-9292
EUROPE: +39-011-3052-794
CONTACT US

Processed Leather Surface Finish using 3D Profilometry

PROCESSED LEATHER

SURFACE FINISH USING 3D PROFILOMETRY

Prepared by

CRAIG LEISING

INTRODUCTION

Once the tanning process of a leather hide is complete the leather surface can undergo several finishing processes for a variety of looks and touch. These mechanical processes can include stretching, buffing, sanding, embossing, coating etc. Dependent upon the end use of the leather some may require a more precise, controlled and repeatable processing.

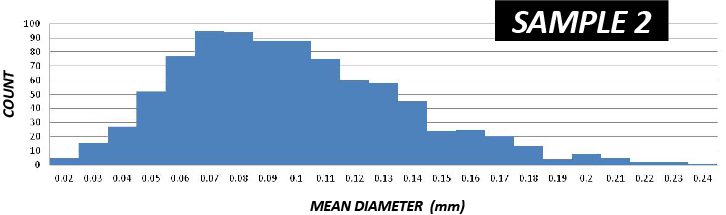
IMPORTANCE OF PROFILOMETRY INSPECTION FOR R&D AND QUALITY CONTROL

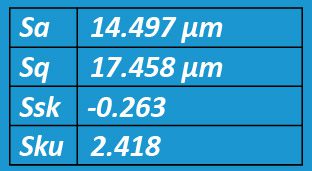
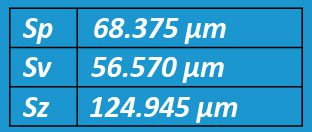
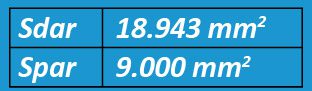
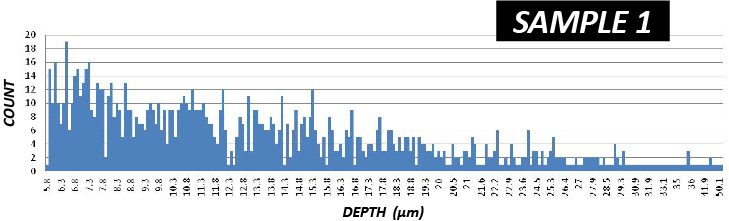
Due to the large variation and unreliability of visual inspection methods, tools that are capable of accurately quantifying micro and nano scales features can improve leather finishing processes. Understanding the surface finish of leather in a quantifiable sense can lead to improved data driven surface processing selection to achieve optimal finish results. NANOVEA 3D Non-Contact Profilometers utilize chromatic confocal technology to measure finished leather surfaces and offer the highest repeatability and accuracy in the market. Where other techniques fail to provide reliable data, due to probe contact, surface variation, angle, absorption or reflectivity, NANOVEA Profilometers succeed.

MEASUREMENT OBJECTIVE

In this application, the NANOVEA ST400 is used to measure and compare the surface finish of two different but closely processed leather samples. Several surface parameters are automatically calculated from the surface profile.

Here we will focus on surface roughness, dimple depth, dimple pitch and dimple diameter for comparative evaluation.

NANOVEA

ST400

RESULTS: SAMPLE 1

ISO 25178

HEIGHT PARAMETERS

OTHER 3D PARAMETERS

RESULTS: SAMPLE 2

ISO 25178

HEIGHT PARAMETERS

OTHER 3D PARAMETERS

DEPTH COMPARATIVE

Depth distribution for each sample.
A large number of deep dimples were observed in
SAMPLE 1.

PITCH COMPARATIVE

Pitch between dimples on SAMPLE 1 is slightly smaller
than
SAMPLE 2, but both have a similar distribution

 MEAN DIAMETER COMPARATIVE

Similar distributions of mean diameter of dimples,
with
SAMPLE 1 showing slightly smaller mean diameters on average.

CONCLUSION

In this application, we have shown how the NANOVEA ST400 3D Profilometer can precisely characterize the surface finish of processed leather. In this study, having the ability to measure surface roughness, dimple depth, dimple pitch and dimple diameter allowed us to quantify differences between the finish and quality of the two samples that may not be obvious by visual inspection.

Overall there were no visible difference in the appearance of the 3D scans between SAMPLE 1 and SAMPLE 2. However, in the statistical analysis there is a clear distinction between the two samples. SAMPLE 1 contains a higher quantity of dimples with smaller diameters, larger depths and smaller dimple-to-dimple pitch in comparison to SAMPLE 2.

Please note that additional studies are available. Special areas of interest could have been further analyzed with an integrated AFM or Microscope module. NANOVEA 3D Profilometer speeds range from 20 mm/s to 1 m/s for laboratory or research to meet the needs of high-speed inspection; can be built with custom sizing, speeds, scanning capabilities, Class 1 clean room compliance, indexing conveyor or for in-line or online integration.

NOW, LET'S TALK ABOUT YOUR APPLICATION