USA/GLOBAL: +1-949-461-9292
EUROPE: +39-011-3052-794
CONTACT US

Shot Peened Surface Analysis

SHOT PEENED SURFACE ANALYSIS

USING 3D NON-CONTACT PROFILOMETER

Prepared by

CRAIG LEISING

INTRODUCTION

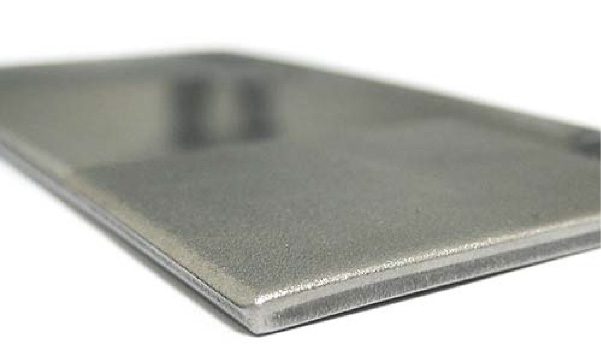
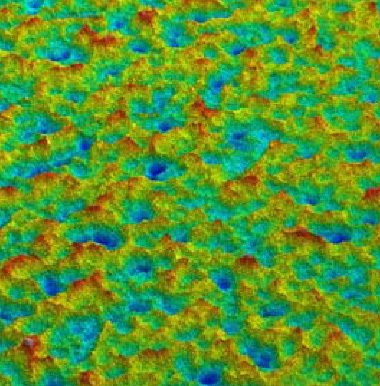
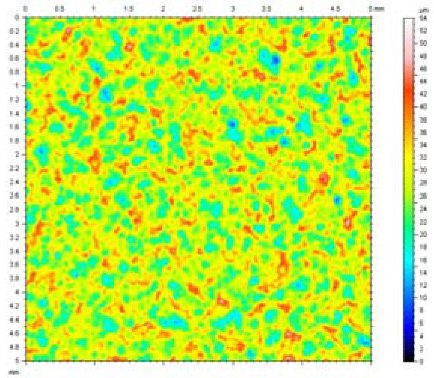
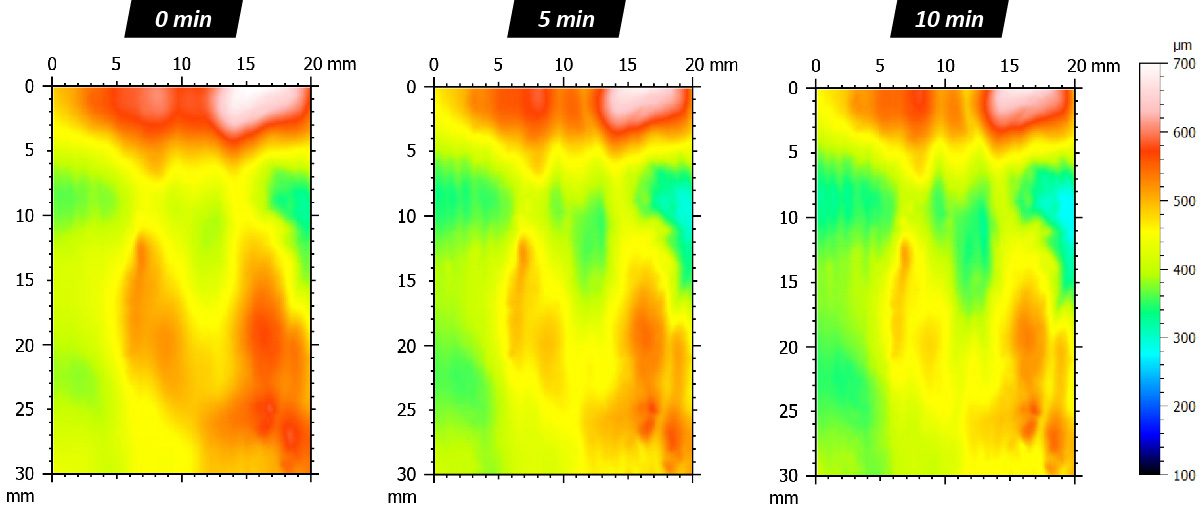
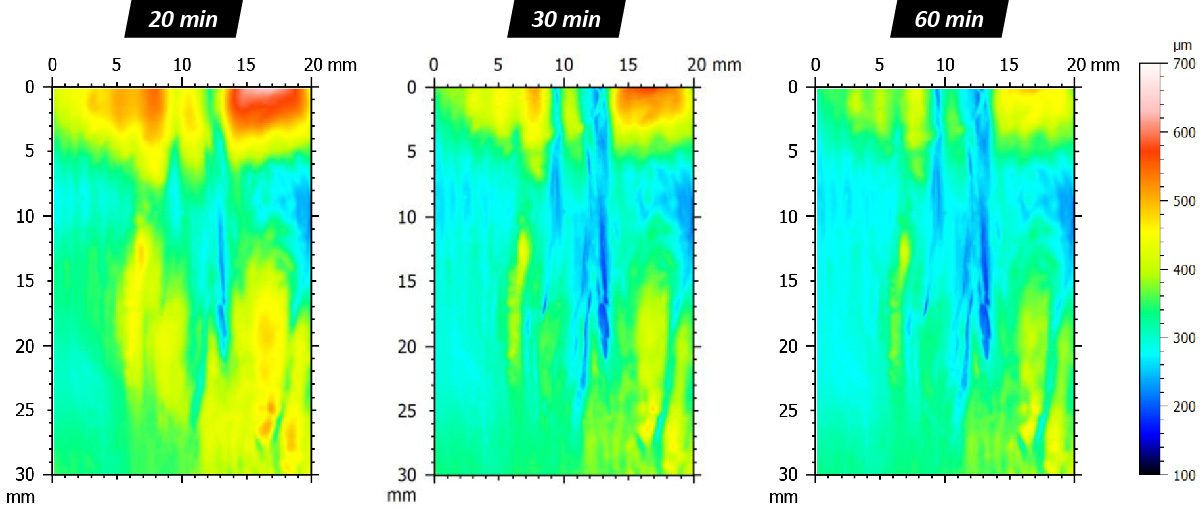
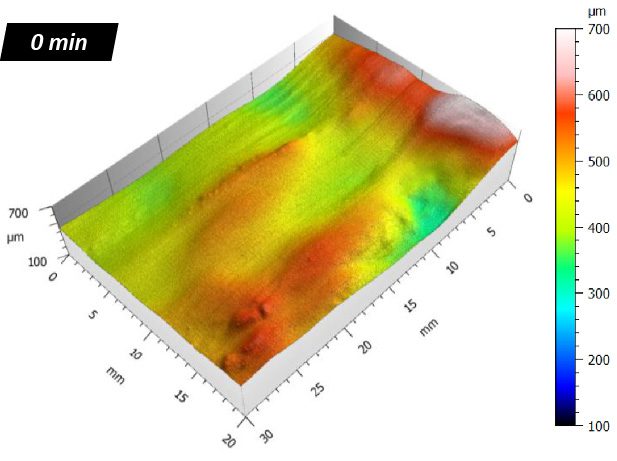
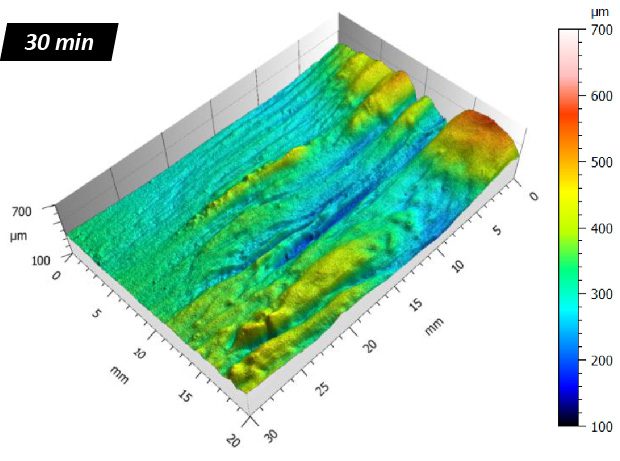
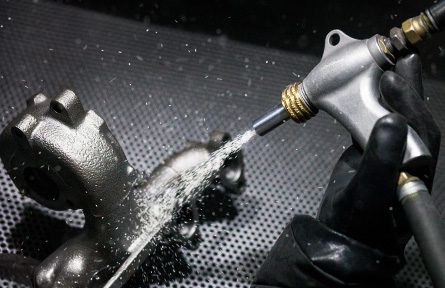
Shot peening is a process in which a substrate is bombarded with spherical metal, glass, or ceramic beads—commonly referred to as “shot”—at a force intended to induce plasticity on the surface. Analyzing the characteristics before and after peening provides crucial insights for enhancing process comprehension and control. The surface roughness and coverage area of dimples left by the shot are especially noteworthy aspects of interest.

Importance of 3D Non-Contact Profilometer for Shot-Peened Surface Analysis

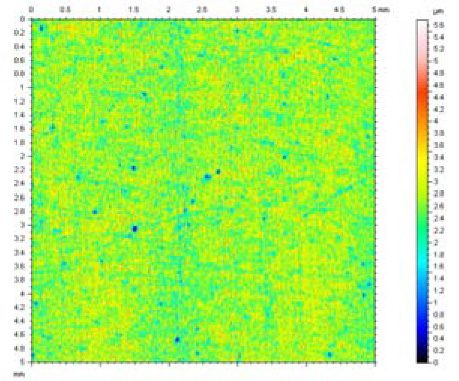
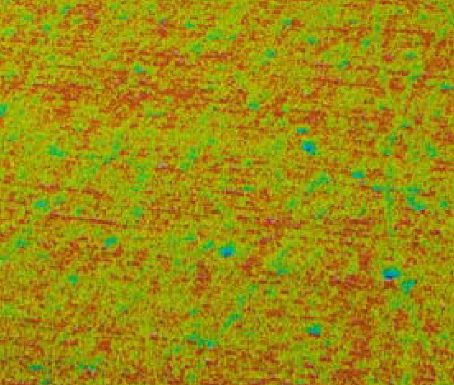
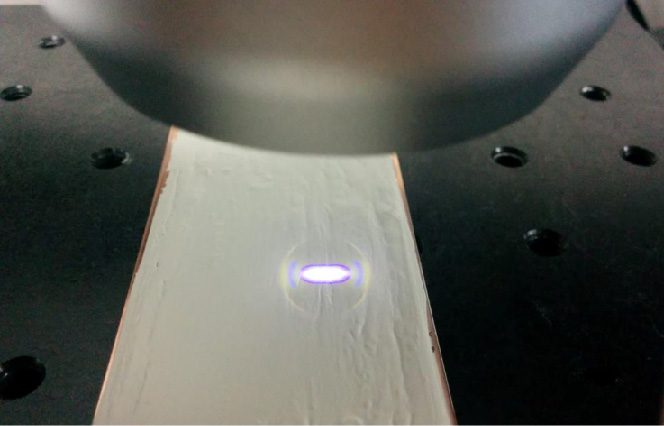
Unlike traditional contact profilometers, which have traditionally been used for shot-peened surface analysis, 3D non-contact measurement provides a complete 3D image to offer a more comprehensive understanding of coverage area and surface topography. Without 3D capabilities, an inspection will solely rely on 2D information, which is insufficient for characterizing a surface. Understanding the topography, coverage area, and roughness in 3D is the best approach for controlling or improving the peening process. NANOVEA’s 3D Non-Contact Profilometers utilize Chromatic Light technology with a unique capability to measure steep angles found on machined and peened surfaces. Additionally, when other techniques fail to provide reliable data due to probe contact, surface variation, angle, or reflectivity, NANOVEA Profilometers succeed.

MEASUREMENT OBJECTIVE

In this application, the NANOVEA ST400 Non-Contact Profilometer is used to measure raw material and two differently peened surfaces for a comparative review. There is an endless list of surface parameters that can be automatically calculated after the 3D surface scan. Here, we will review the 3D surface and select areas of interest for further analysis, including quantifying and investigating the roughness, dimples, and surface area.

NANOVEA

ST400

THE SAMPLE

RESULTS

STEEL SURFACE

ISO 25178 3D ROUGNESS PARAMETERS

SA 0.399 μm Average Roughness
Sq 0.516 μm RMS Roughness
Sz 5.686 μm Maximum Peak-to-Valley
Sp 2.976 μm Maximum Peak Height
Sv 2.711 μm Maximum Pit Depth
Sku 3.9344 Kurtosis
Ssk -0.0113 Skewness
Sal 0.0028 mm Auto-Correlation Length
Str 0.0613 Texture Aspect Ratio
Sdar 26.539 mm² Surface Area
Svk 0.589 μm Reduced Valley Depth
 

RESULTS

PEENED SURFACE 1

SURFACE COVERAGE
98.105%

ISO 25178 3D ROUGNESS PARAMETERS

Sa 4.102 μm Average Roughness
Sq 5.153 μm RMS Roughness
Sz 44.975 μm Maximum Peak-to-Valley
Sp 24.332 μm Maximum Peak Height
Sv 20.644 μm Maximum Pit Depth
Sku 3.0187 Kurtosis
Ssk 0.0625 Skewness
Sal 0.0976 mm Auto-Correlation Length
Str 0.9278 Texture Aspect Ratio
Sdar 29.451 mm² Surface Area
Svk 5.008 μm Reduced Valley Depth

RESULTS

PEENED SURFACE 2

SURFACE COVERAGE 97.366%

ISO 25178 3D ROUGNESS PARAMETERS

Sa 4.330 μm Average Roughness
Sq 5.455 μm RMS Roughness
Sz 54.013 μm Maximum Peak-to-Valley
Sp 25.908 μm Maximum Peak Height
Sv 28.105 μm Maximum Pit Depth
Sku 3.0642 Kurtosis
Ssk 0.1108 Skewness
Sal 0.1034 mm Auto-Correlation Length
Str 0.9733 Texture Aspect Ratio
Sdar 29.623 mm² Surface Area
Svk 5.167 μm Reduced Valley Depth

CONCLUSION

In this shot-peened surface analysis application, we have demonstrated how the NANOVEA ST400 3D Non-Contact Profiler precisely characterizes both the topography and nanometer details of a peened surface. It is evident that both Surface 1 and Surface 2 have a significant impact on all the parameters reported here when compared to the raw material. A simple visual examination of the images reveals the differences between the surfaces. This is further confirmed by observing the coverage area and the listed parameters. In comparison to Surface 2, Surface 1 exhibits a lower average roughness (Sa), shallower dents (Sv), and reduced surface area (Sdar), but a slightly higher coverage area.

From these 3D surface measurements, areas of interest can be readily identified and subjected to a comprehensive array of measurements, including Roughness, Finish, Texture, Shape, Topography, Flatness, Warpage, Planarity, Volume, Step-Height, and others. A 2D cross-section can quickly be chosen for detailed analysis. This information allows for a comprehensive investigation of peened surfaces, utilizing a complete range of surface measurement resources. Specific areas of interest could be further examined with an integrated AFM module. NANOVEA 3D Profilometers offer speeds of up to 200 mm/s. They can be customized in terms of size, speeds, scanning capabilities, and can even comply with Class 1 Clean Room standards. Options like Indexing Conveyor and integration for Inline or Online usage are also available.

A special thanks to Mr. Hayden at IMF for supplying the sample shown in this note. Industrial Metal Finishing Inc. | indmetfin.com

Paint Surface Morphology

PAINT SURFACE MORPHOLOGY

AUTOMATED REAL-TIME EVOLUTION MONITORING
USING NANOVEA 3D PROFILOMETER

Prepared by

DUANJIE LI, PhD

INTRODUCTION

Protective and decorative properties of paint play a significant role in a variety of industries, including automotive, marine, military, and construction. To achieve desired properties, such as corrosion resistance, UV protection, and abrasion resistance, paint formulas and architectures are carefully analyzed, modified, and optimized.

IMPORTANCE OF 3D NON-CONTACT PROFILOMETER FOR DRYING PAINT SURFACE MORPHOLOGY ANALYSIS

Paint is usually applied in liquid form and undergoes a drying process, which involves the evaporation of solvents and the transformation of the liquid paint into a solid film. During the drying process, the paint surface progressively changes its shape and texture. Different surface finishes and textures can be developed by using additives to modify the surface tension and flow properties of the paint. However, in cases of a poorly formulated paint recipe or improper surface treatment, undesired paint surface failures may occur.

Accurate in situ monitoring of the paint surface morphology during the drying period can provide direct insight into the drying mechanism. Moreover, real-time evolution of surface morphologies is very useful information in various applications, such as 3D printing. The NANOVEA 3D Non-Contact Profilometers measure the paint surface morphology of materials without touching the sample, avoiding any shape alteration that may be caused by contact technologies such as a sliding stylus.

MEASUREMENT OBJECTIVE

In this application, the NANOVEA ST500 Non-Contact Profilometer, equipped with a high-speed line optical sensor, is used to monitor the paint surface morphology during its 1-hour drying period. We showcase the NANOVEA Non-Contact Profilometer’s capability in providing automated real-time 3D profile measurement of materials with continuous shape change.

NANOVEA

ST500

RESULTS & DISCUSSION

The paint was applied on the surface of a metal sheet, followed immediately by automated measurements of the morphology evolution of the drying paint in situ using the NANOVEA ST500 Non-Contact Profilometer equipped with a high-speed line sensor. A macro had been programmed to automatically measure and record the 3D surface morphology at specific time intervals: 0, 5, 10, 20, 30, 40, 50, and 60 min. This automated scanning procedure enables users to perform scanning tasks automatically by running set procedures in sequence, significantly reducing effort, time, and possible user errors compared to manual testing or repeated scans. This automation proves to be extremely useful for long-term measurements involving multiple scans at different time intervals.

The optical line sensor generates a bright line consisting of 192 points, as shown in FIGURE 1. These 192 light points scan the sample surface simultaneously, significantly increasing the scanning speed. This ensures that each 3D scan is completed quickly to avoid substantial surface changes during each individual scan.

FIGURE 1: Optical line sensor scanning the surface of the drying paint.

The false color view, 3D view, and 2D profile of the drying paint topography at representative times are shown in FIGURE 2, FIGURE 3, and FIGURE 4, respectively. The false color in the images facilitates the detection of features that are not readily discernible. Different colors represent height variations across different areas of the sample surface. The 3D view provides an ideal tool for users to observe the paint surface from different angles. During the first 30 minutes of the test, the false colors on the paint surface gradually change from warmer tones to cooler ones, indicating a progressive decrease in height over time in this period. This process slows down, as shown by the mild color change when comparing the paint at 30 and 60 minutes.

The average sample height and roughness Sa values as a function of the paint drying time are plotted in FIGURE 5. The full roughness analysis of the paint after 0, 30, and 60 min drying time are listed in TABLE 1. It can be observed that the average height of the paint surface rapidly decreases from 471 to 329 µm in the first 30 min of drying time. The surface texture develops at the same time as the solvent vaporizes, leading to an increased roughness Sa value from 7.19 to 22.6 µm. The paint drying process slows down thereafter, resulting in a gradual decrease of the sample height and Sa value to 317 µm and 19.6 µm, respectively, at 60 min.

This study highlights the capabilities of the NANOVEA 3D Non-Contact Profilometer in monitoring the 3D surface changes of the drying paint in real-time, providing valuable insights into the paint drying process. By measuring the surface morphology without touching the sample, the profilometer avoids introducing shape alterations to the undried paint, which can occur with contact technologies like sliding stylus. This non-contact approach ensures accurate and reliable analysis of drying paint surface morphology.

FIGURE 2: Evolution of the drying paint surface morphology at different times.

FIGURE 3: 3D view of the paint surface evolution at different drying times.

FIGURE 4: 2D profile across the paint sample after different drying times.

FIGURE 5: Evolution of the average sample height and roughness value Sa as a function of the paint drying time.

ISO 25178

Drying time (min) 0 5 10 20 30 40 50 60
Sq (µm) 7.91 9.4 10.8 20.9 22.6 20.6 19.9 19.6
Sku 26.3 19.8 14.6 11.9 10.5 9.87 9.83 9.82
Sp (µm) 97.4 105 108 116 125 118 114 112
Sv (µm) 127 70.2 116 164 168 138 130 128
Sz (µm) 224 175 224 280 294 256 244 241
Sa (µm) 4.4 5.44 6.42 12.2 13.3 12.2 11.9 11.8

Sq – Root-mean-square height | Sku – Kurtosis | Sp – Maximum peak height | Sv – Maximum pit height | Sz – Maximum height | Sv – Arithmetic mean height

TABLE 1: Paint roughness at different drying times.

CONCLUSION

In this application, we have showcased the capabilities of the NANOVEA ST500 3D Non-Contact Profilometer in monitoring the evolution of paint surface morphology during the drying process. The high-speed optical line sensor, generating a line with 192 light spots that scan the sample surface simultaneously, has made the study time-efficient while ensuring unmatched accuracy.

The macro function of the acquisition software allows for programming automated measurements of the 3D surface morphology in situ, making it particularly useful for long-term measurement involving multiple scans at specific target time intervals. It significantly reduces the time, effort, and potential for user errors. The progressive changes in surface morphology are continuously monitored and recorded in real-time as the paint dries, providing valuable insights into the paint drying mechanism.

The data shown here represents only a fraction of the calculations available in the analysis software. NANOVEA Profilometers are capable of measuring virtually any surface, whether it’s transparent, dark, reflective, or opaque.


NOW, LET'S TALK ABOUT YOUR APPLICATION