USA/GLOBAL: +1-949-461-9292
EUROPE: +39-011-3052-794
CONTACT US

Category: Friction Testing | Coefficient of Friction


Industrial Coatings Scratch and Wear Evaluation

INDUSTRIAL COATING

SCRATCH AND WEAR EVALUATION USING A TRIBOMETER

Prepared by

DUANJIE LI, PhD & ANDREA HERRMANN

INTRODUCTION

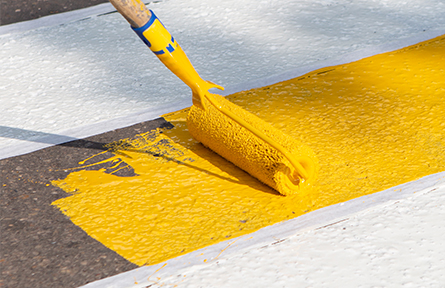
Acrylic urethane paint is a type of fast-dry protective coating widely used in a variety of industrial applications, such as floor paint, auto paint, and others. When used as floor paint, it can serve areas with heavy foot and rubber-wheel traffic, such as walkways, curbs and parking lots.

IMPORTANCE OF SCRATCH AND WEAR TESTING FOR QUALITY CONTROL

Traditionally, Taber abrasion tests were carried out to evaluate the wear resistance of acrylic urethane floor paint according to the ASTM D4060 standard. However, as mentioned in the standard, “For some materials, abrasion tests utilizing the Taber Abraser may be subject to variation due to changes in the abrasive characteristics of the wheel during testing.”1 This may result in poor reproducibility of test results and create difficulty in comparing values reported from different laboratories. Moreover, in Taber abrasion tests, abrasion resistance is calculated as loss in weight at a specified number of abrasion cycles. However, acrylic urethane floor paints have a recommended dry film thickness of 37.5-50 μm2.

The aggressive abrasion process by Taber Abraser can quickly wear through the acrylic urethane coating and create mass loss to the substrate leading to substantial errors in the calculation of the paint weight loss. The implant of abrasive particles in the paint during the abrasion test also contributes to errors. Therefore, a well-controlled quantifiable and reliable measurement is crucial to ensure reproducible wear evaluation of the paint. In addition, the scratch test allows users to detect premature adhesive/cohesive failures in real-life applications.

MEASUREMENT OBJECTIVE

In this study, we showcase that NANOVEA Tribometers and Mechanical Testers are ideal for evaluation and quality control of industrial coatings.

The wear process of acrylic urethane floor paints with different topcoats is simulated in a controlled and monitored manner using the NANOVEA Tribometer. Micro scratch testing is used to measure the load required to cause cohesive or adhesive failure to the paint.

NANOVEA T100

The Compact Pneumatic Tribometer

NANOVEA PB1000

The Large Platform Mechanical Tester

TEST PROCEDURE

This study evaluates four commercially available water-based acrylic floor coatings that have the same primer (basecoat) and different topcoats of the same formula with a small alternation in the additive blends for the purpose of enhancing durability. These four coatings are identified as Samples A, B, C and D.

WEAR TEST

The NANOVEA Tribometer was applied to evaluate the tribological behavior, e.g. coefficient of friction, COF, and wear resistance. A SS440 ball tip (6 mm dia., Grade 100) was applied against the tested paints. The COF was recorded in situ. The wear rate, K, was evaluated using the formula K=V/(F×s)=A/(F×n), where V is the worn volume, F is the normal load, s is the sliding distance, A is the cross-sectional area of the wear track, and n is the number of revolution. Surface roughness and wear track profiles were evaluated by the NANOVEA Optical Profilometer, and the wear track morphology was examined using optical microscope.

WEAR TEST PARAMETERS

NORMAL FORCE

20 N

SPEED

15 m/min

DURATION OF TEST

100, 150, 300 & 800 cycles

SCRATCH TEST

The NANOVEA Mechanical Tester equipped with a Rockwell C diamond stylus (200 μm radius) was used to perform progressive load scratch tests on the paint samples using the Micro Scratch Tester Mode. Two final loads were used: 5 N final load for investigating paint delamination from the primer, and 35 N for investigating primer delamination from the metal substrates. Three tests were repeated at the same testing conditions on each sample to ensure reproducibility of the results.

Panoramic images of the whole scratch lengths were automatically generated and their critical failure locations were correlated with the applied loads by the system software. This software feature facilitates users to perform analysis on the scratch tracks any time, rather than having to determine the critical load under the microscope immediately after the scratch tests.

SCRATCH TEST PARAMETERS

LOAD TYPEProgressive
INITIAL LOAD0.01 mN
FINAL LOAD5 N / 35 N
LOADING RATE10 / 70 N/min
SCRATCH LENGTH3 mm
SCRATCHING SPEED, dx/dt6.0 mm/min
INDENTER GEOMETRY120º cone
INDENTER MATERIAL (tip)Diamond
INDENTER TIP RADIUS200 μm

WEAR TEST RESULTS

Four pin-on-disk wear tests at different number of revolutions (100, 150, 300 and 800 cycles) were performed on each sample in order to monitor the evolution of wear. The surface morphology of the samples were measured with a NANOVEA 3D Non-Contact Profiler to quantify the surface roughness prior to conducting wear testing. All samples had a comparable surface roughness of approximately 1 μm as displayed in FIGURE 1. The COF was recorded in situ during the wear tests as shown in FIGURE 2. FIGURE 4 presents the evolution of wear tracks after 100, 150, 300 and 800 cycles, and FIGURE 3 summarized the average wear rate of different samples at different stages of the wear process.


Compared with a COF value of ~0.07 for the other three samples, Sample A exhibits a much higher COF of ~0.15 at the beginning, which gradually increases and gets stable at ~0.3 after 300 wear cycles. Such a high COF accelerates the wear process and creates a substantial amount of paint debris as indicated in FIGURE 4 – the topcoat of Sample A has started to be removed in the first 100 revolutions. As shown in FIGURE 3, Sample A exhibits the highest wear rate of ~5 μm2/N in the first 300 cycles, which slightly decreases to ~3.5 μm2/N due to the better wear resistance of the metal substrate. The topcoat of Sample C starts to fail after 150 wear cycles as shown in FIGURE 4, which is also indicated by the increase of COF in FIGURE 2.


In comparison, Sample B and Sample D show enhanced tribological properties. Sample B maintains a low COF throughout the whole test – the COF slightly increases from~0.05 to ~0.1. Such a lubricating effect substantially enhances its wear resistance – the topcoat still provides superior protection to the primer underneath after 800 wear cycles. The lowest average wear rate of only ~0.77 μm2/N is measured for Sample B at 800 cycles. The topcoat of Sample D starts to delaminate after 375 cycles, as reflected by the abrupt increase of COF in FIGURE 2. The average wear rate of Sample D is ~1.1 μm2/N at 800 cycles.


Compared to the conventional Taber abrasion measurements, NANOVEA Tribometer provides well-controlled quantifiable and reliable wear assessments that ensure reproducible evaluations and quality control of commercial floor/auto paints. Moreover, the capacity of in situ COF measurements allow users to correlate the different stages of a wear process with the evolution of COF, which is critical in improving fundamental understanding of the wear mechanism and tribological characteristics of various paint coatings.

FIGURE 1: 3D morphology and roughness of the paint samples.

FIGURE 2: COF during pin-on-disk tests.

FIGURE 3: Evolution of wear rate of different paints.

FIGURE 4: Evolution of wear tracks during the pin-on-disk tests.

WEAR TEST RESULTS

FIGURE 5 shows the plot of normal force, frictional force and true depth as a function of scratch length for Sample A as an example. An optional acoustic emission module can be installed to provide more information. As the normal load linearly increases, the indentation tip gradually sinks into the tested sample as reflected by the progressive increase of true depth. The variation in the slopes of frictional force and true depth curves can be used as one of the implications that coating failures start to occur.

FIGURE 5: Normal force, frictional force and true depth as a function of scratch length for scratch test of Sample A with a maximum load of 5 N.

FIGURE 6 and FIGURE 7 show the full scratches of all four paint samples tested with a maximum load of 5 N and 35 N, respectively. Sample D required a higher load of 50 N to delaminate the primer. Scratch tests at 5 N final load (FIGURE 6) evaluate the cohesive/adhesive failure of the top paint, while the ones at 35 N (FIGURE 7) assess the delamination of the primer. The arrows in the micrographs indicate the point at which the top coating or the primer start to be completely removed from the primer or the substrate. The load at this point, so called Critical Load, Lc, is used to compare the cohesive or adhesive properties of the paint as summarized in Table 1.


It is evident that the paint Sample D has the best interfacial adhesion – exhibiting the highest Lc values of 4.04 N at paint delamination and 36.61 N at primer delamination. Sample B shows the second best scratch resistance. From the scratch analysis, we show that optimization of the paint formula is critical to the mechanical behaviors, or more specifically, scratch resistance and adhesion property of acrylic floor paints.

Table 1: Summary of critical loads.

FIGURE 6: Micrographs of full scratch with 5 N maximum load.

FIGURE 7: Micrographs of full scratch with 35 N maximum load.

CONCLUSION

Compared to the conventional Taber abrasion measurements, the NANOVEA Mechanical Tester and Tribometer are superior tools for evaluation and quality control of commercial floor and automotive coatings. The NANOVEA Mechanical Tester in Scratch mode can detect adhesion/cohesion problems in a coating system. The NANOVEA Tribometer provides well-controlled quantifiable and repeatable tribological analysis on wear resistance and coefficient of friction of the paints.


Based on the comprehensive tribological and mechanical analyses on the water based acrylic floor coatings tested in this study, we show that Sample B possesses the lowest COF and wear rate and the second best scratch resistance, while Sample D exhibits the best scratch resistance and second best wear resistance. This assessment allows us to evaluate and select the best candidate targeting the needs in different application environments.


The Nano and Micro modules of the NANOVEA Mechanical Tester all include ISO and ASTM compliant indentation, scratch and wear tester modes, providing the widest range of testing available for paint evaluation on a single module. The NANOVEA Tribometer offers precise and repeatable wear and friction testing using ISO and ASTM compliant rotative and linear modes, with optional high temperature wear, lubrication and tribo-corrosion modules available in one pre-integrated system. NANOVEA’s unmatched range is an ideal solution for determining the full range of mechanical/tribological properties of thin or thick, soft or hard coatings, films and substrates, including hardness, Young’s modulus, fracture toughness, adhesion, wear resistance and many others. Optional NANOVEA Non-Contact Optical Profilers are available for high resolution 3D imaging of scratchs and wear tracks in addition to other surface measurements such as roughness.

NOW, LET'S TALK ABOUT YOUR APPLICATION

Titanium Nitride Coating Scratch Test

TITANIUM NITRIDE COATING SCRATCH TEST

QUALITY CONTROL INSPECTION

Prepared by

DUANJIE LI, PhD

INTRODUCTION

The combination of high hardness, excellent wear resistance, corrosion resistance and inertness makes titanium nitride (TiN) an ideal protective coating for metal components in various industries. For example, the edge retention and corrosion resistance of a TiN coating can substantially increase the work efficiency and extend the service life of machine tooling such as razor blades, metal cutters, injection molds and saws. Its high hardness, inertness and non-toxicity make TiN a great candidate for applications in medical devices including implants and surgical instruments.

IMPORTANCE OF TiN COATING SCRATCH TESTING

Residual stress in protective PVD/CVD coatings plays a critical role in the performance and mechanical integrity of the coated component. The residual stress derives from several major sources, including growth stress, thermal gradients, geometric constraints and service stress¹. The thermal expansion mismatch between the coating and the substrate created during coating deposition at elevated temperatures leads to high thermal residual stress. Moreover, TiN coated tools are often used under very high concentrated stresses, e.g. drill bits and bearings. It is critical to developing a reliable quality control process to quantitatively inspect the cohesive and adhesive strength of protective functional coatings.

[1] V. Teixeira, Vacuum 64 (2002) 393–399.

MEASUREMENT OBJECTIVE

In this study, we showcase that the NANOVEA Mechanical Testers in Scratch Mode are ideal for assessing the cohesive/adhesive strength of protective TiN coatings in a controlled and quantitative manner.

NANOVEA

PB1000

TEST CONDITIONS

The NANOVEA PB1000 Mechanical Tester was used to perform coating scratch tests on three TiN coatings using the same test parameters as summarized below:

LOADING MODE: Progressive Linear

INITIAL LOAD

0.02 N

FINAL LOAD

10 N

LOADING RATE

20 N/min

SCRATCH LENGTH

5 mm

INDENTER TYPE

Sphero-Conical

Diamond, 20 μm radius

RESULTS & DISCUSSION

FIGURE 1 shows the recorded evolution of penetration depth, coefficient of friction (COF) and acoustic emission during the test. The full micro scratch tracks on the TiN samples are shown in FIGURE 2. The failure behaviors at different critical loads are displayed in FIGURE 3, where critical load Lc1 is defined as the load at which the first sign of cohesive crack occurs in the scratch track, Lc2 is the load after which repeated spallation failures take place, and Lc3 is the load at which the coating is completely removed from the substrate. The critical load (Lc) values for the TiN coatings are summarized in FIGURE 4.

The evolution of penetration depth, COF and acoustic emission provides insight into the mechanism of the coating failure at different stages, which are represented by the critical loads in this study. It can be observed that Sample A and Sample B exhibit comparable behavior during the scratch test. The stylus progressively penetrates into the sample to a depth of ~0.06 mm and the COF gradually increases to ~0.3 as the normal load increases linearly at the beginning of the coating scratch test. When the Lc1 of ~3.3 N is reached, the first sign of chipping failure occurs. This is also reflected in the first large spikes in the plot of penetration depth, COF and acoustic emission. As the load continues to increase to Lc2 of ~3.8 N, further fluctuation of the penetration depth, COF and acoustic emission takes place. We can observe continuous spallation failure present on both sides of the scratch track. At the Lc3, the coating completely delaminates from the metal substrate under the high pressure applied by the stylus, leaving the substrate exposed and unprotected.

In comparison, Sample C exhibits lower critical loads at different stages of the coating scratch tests, which is also reflected in the evolution of penetration depth, coefficient of friction (COF) and acoustic emission during the coating scratch test. Sample C possesses an adhesion interlayer with lower hardness and higher stress at the interface between the top TiN coating and the metal substrate compared to Sample A and Sample B.

This study demonstrates the importance of proper substrate support and coating architecture to the quality of the coating system. A stronger interlayer can better resist deformation under a high external load and concentration stress, and thus enhance the cohesive and adhesive strength of the coating/substrate system.

FIGURE 1: Evolution of penetration depth, COF and acoustic emission of the TiN samples.

FIGURE 2: Full scratch track of the TiN coatings after the tests.

FIGURE 3: TiN coating failures under different critical loads, Lc.

FIGURE 4: Summary of critical load (Lc) values for the TiN coatings.

CONCLUSION

In this study, we showcased that the NANOVEA PB1000 Mechanical Tester performs reliable and accurate scratch tests on TiN-coated samples in a controlled and closely monitored manner. Scratch measurements allow users to quickly identify the critical load at which typical cohesive and adhesive coating failures occur. Our instruments are superior quality control tools that can quantitatively inspect and compare the intrinsic quality of a coating and the interfacial integrity of a coating/substrate system. A coating with a proper interlayer can resist large deformation under a high external load and concentration stress, and enhance the cohesive and adhesive strength of a coating/substrate system.

The Nano and Micro modules of a NANOVEA Mechanical Tester all include ISO and ASTM compliant indentation, scratch and wear tester modes, providing the widest and most user-friendly range of testing available in a single system. NANOVEA’s unmatched range is an ideal solution for determining the full range of mechanical properties of thin or thick, soft or hard coatings, films and substrates, including hardness, Young’s modulus, fracture toughness, adhesion, wear-resistance and many others.

NOW, LET'S TALK ABOUT YOUR APPLICATION

Friction Evaluation at Extreme Low Speeds


Importance of Friction Evaluation at Low Speeds

Friction is the force that resists the relative motion of solid surfaces sliding against each other. When the relative motion of these two contact surfaces takes place, the friction at the interface converts the kinetic energy into heat. Such a process can also lead to wear of the material and thus performance degradation of the parts in use.
With a large stretch ratio, high resilience, as well as great waterproof properties and wear resistance, rubber is extensively applied in a variety of applications and products in which friction plays an important role, such as automobile tires, windshield wiper blades. shoe soles and many others. Depending on the nature and requirement of these applications, either high or low friction against different material is desired. As a consequence, a controlled and reliable measurement of friction of rubber against various surfaces becomes critical.


Measurement Objective

The coefficient of friction (COF) of rubber against different materials is measured in a controlled and monitored manner using the Nanovea Tribometer. In this study, we would like to showcase the capacity of Nanovea Tribometer for measuring the COF of different materials at extremely low speeds.


Results and Discussion

The coefficient of friction (COF) of rubber balls (6 mm dia., RubberMill) on three materials (Stainless steel SS 316, Cu 110 and optional Acrylic) was evaluated by Nanovea Tribometer. The tested metal samples were mechanically polished to a mirror-like surface finish before the measurement. The slight deformation of the rubber ball under the applied normal load created an area contact, which also helps to reduce the impact of asperities or inhomogeneity of sample surface finish to the COF measurements. The test parameters are summarized in Table 1.


The COF of a rubber ball against different materials at four different speeds is shown in Figure. 2, and the average COFs calculated automatically by the software are summarized and compared in Figure 3. It is interesting that the metal samples (SS 316 and Cu 110) exhibit significantly increased COFs as the rotational speed increases from a very low value of 0.01 rpm to 5 rpm -the COF value of the rubber/SS 316 couple increases from 0.29 to 0.8, and from 0.65 to 1.1 for the rubber/Cu 110 couple. This finding is in agreement with the results reported from several laboratories. As proposed by Grosch4 the friction of rubber is mainly determined by two mechanisms: (1) the adhesion between rubber and the other material, and (2) the energy losses due to the deformation of the rubber caused by surface asperities. Schallamach5 observed waves of detachment of rubber from the counter material across the interface between soft rubber spheres and a hard surface. The force for rubber to peel from the substrate surface and rate of waves of detachment can explain the different friction at different speeds during the test.

In comparison, the rubber/acrylic material couple exhibits high COF at different rotational speeds. The COF value slightly increases from ~ 1.02 to ~ 1.09 as the rotational speed increases from 0.01 rpm to 5 rpm. Such high COF is possibly attributed to stronger local chemical bonding at the contact face formed during the tests.


Conclusion


In this study, we show that at extremely low speeds, the rubber exhibits a peculiar frictional behavior – its friction against a hard surface increases with the increased speed of the relative movement. Rubber shows different friction when it slides on different materials. Nanovea Tribometer can evaluate the frictional properties of materials in a controlled and monitored manner at different speeds, allowing users to improve fundamental understanding of the friction mechanism of the materials and select the best material couple for targeted tribological engineering applications.

Nanovea Tribometer offers precise and repeatable wear and friction testing using ISO and ASTM compliant rotative and linear modes, with optional high-temperature wear, lubrication and tribo-corrosion modules available in one pre-integrated system. It is capable of controlling the rotational stage at extremely low speeds down to 0.01 rpm and monitor the evolution of friction in situ. Nanovea’s unmatched range is an ideal solution for determining the full range of tribological properties of thin or thick, soft or hard coatings, films, and substrates.

NOW, LET'S TALK ABOUT YOUR APPLICATION

Mechanical Properties of Silicon Carbide Wafer Coatings

Understanding the mechanical properties of silicon carbide wafer coatings is critical. The fabrication process for microelectronic devices can have over 300 different processing steps and can take anywhere from six to eight weeks. During this process, the wafer substrate must be able to withstand the extreme conditions of manufacturing, since a failure at any step would result in the loss of time and money. The testing of hardness, adhesion/scratch resistance and COF/wear rate of the wafer must meet certain requirements in order to survive the conditions imposed during the manufacturing and application process to insure a failure will not occur.

Mechanical Properties of Silicon Carbide Wafer Coatings

Self Cleaning Glass Coating Friction Measurement

Self cleaning glass coating possesses a low surface energy that repels both water and oils. Such a coating creates an easy-clean and non-stick glass surface that protects it against grime, dirt and staining.  The easy-clean coating substantially cuts the water and energy usage on glass cleaning. It does not require harsh and toxic chemical detergents, making it an eco-friendly choice for a wide variety of residential and commercial applications, such as mirrors, shower glasses, windows and windshields.

Self Cleaning Glass Coating Friction Measurement

Scratch Hardness Measurement Using Tribometer

In this study, the Nanovea Tribometer is used to measure the scratch hardness of different metals. The
capacity of performing scratch hardness measurement with high precision and reproducibility makes
Nanovea Tribometer a more complete system for tribological and mechanical evaluations.

Scratch Hardness Measurement Using Tribometer

Bio-Tribology of Endocardial Leads in Hanks’ Solution

In this study, we simulated and compared the nan friction and wear behaviors of endocardial pacing leads made of different materials, in Hanks Solution, using the Nanovea Mechanical and Tribometer, respectively.

Nano-Micro Bio-Tribology of Endocardial Leads in Hanks’ Solution