Category: Indentation | Fracture Toughness

Microparticles: Compression Strength and Micro Indentation
INTRODUCTION
Compression strength has become vital to quality control measurement in developing and improving new and existing microparticles and micro features (pillars and spheres) seen today. Microparticles have various shapes, sizes and can be developed from ceramics, glass, polymers, and metals. Uses include drug delivery, food flavor enhancement, concrete formulations among many others. Controlling the mechanical properties of microparticles or microfeatures are critical for their success and requires the ability to quantitatively characterize their mechanical integrity
IMPORTANCE OF DEPTH VERSUS LOAD COMPRESSION STRENGTH
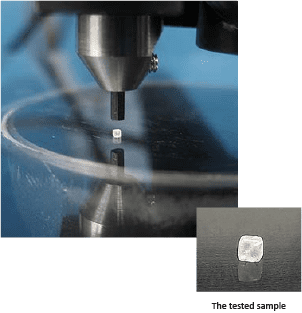
Standard compressive measurement instruments are not capable of low loads and fail to provide adequate depth data for microparticles. By using Nano or Microindentation, the compression strength of nano or microparticles (soft or hard) can be accurately and precisely measured.
TEST CONDITIONS
maximum force
30 N
loading rate
60 N/min
unloading rate
60 N/min
indenter type
Flat Punch
Steel | 1mm Diameter
Load vs depth curves
Results & Discussion
Height, failure force and strength for Particle 1 and Particle 2
Particle failure was determined to be the point where the initial slope of the force vs. depth curve began to noticeably decrease.This behavior shows the material has reached a yield point and is no longer able to resist the compressive forces being applied. Once the yield point is surpassed, the indentation depth begins to exponentially increase for the duration of the loading period. These behaviors can be seen in Load vs Depth Curves for both samples.
CONCLUSION
In conclusion, we have shown how the NANOVEA Mechanical Tester in micro indentation mode is a great tool for compression strength testing of microparticles. Although the particles tested are made of the same material, it is suspected that the different failure points measured in this study were likely due to pre-existent micro cracks in the particles and varying particle sizes. It should be noted that for brittle materials, acoustic emission sensors are available to measure the beginning of crack propagation during a test.
The NANOVEA Mechanical Tester offers depth displacement resolutions down to the sub nanometer level,
making it a great tool for the study of very fragile micro particles or features as well. For soft and fragile
materials, loads down to 0.1mN are possible with our nano indentation module
NOW, LET'S TALK ABOUT YOUR APPLICATION

Improve Mining Procedures With Microindendation
MICROINDENTATION RESEARCH AND QUALITY CONTROL
Rock mechanics is the study of the mechanical behavior of rock masses and is applied in mining, drilling, reservoir production, and civil construction industries. Advanced instrumentation with precise measurement of mechanical properties allows for part and procedure improvement within these industries. Successful quality control procedures are ensured by understanding rock mechanics at the micro scale.
MEASUREMENT OBJECTIVE
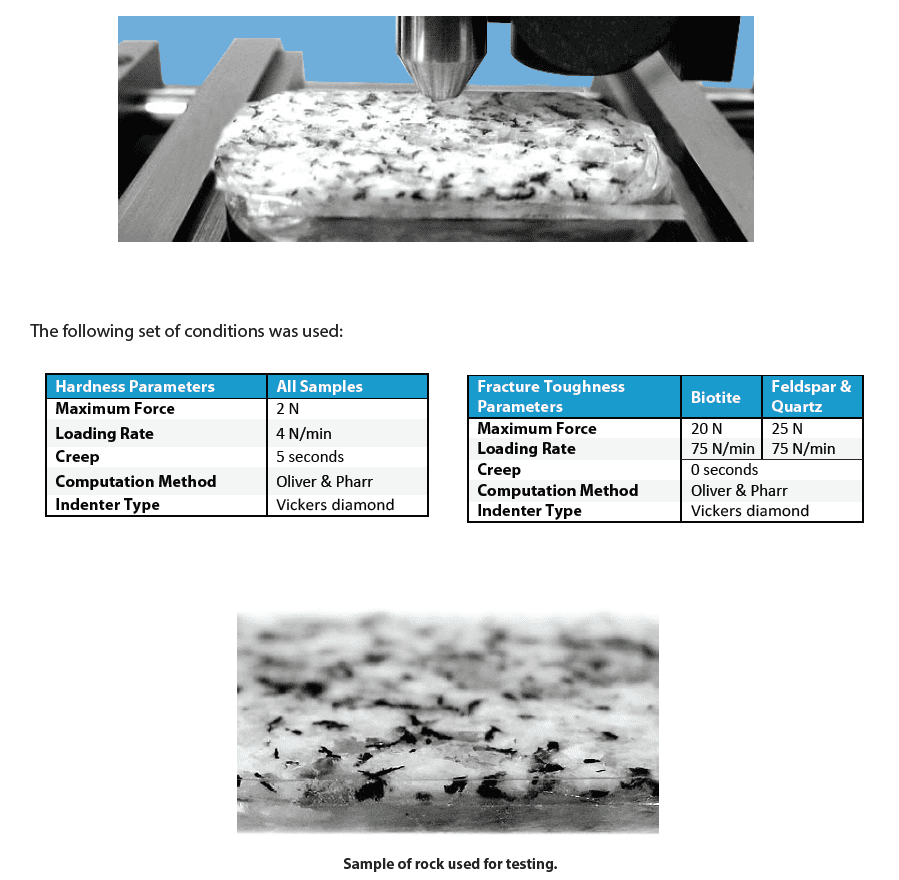
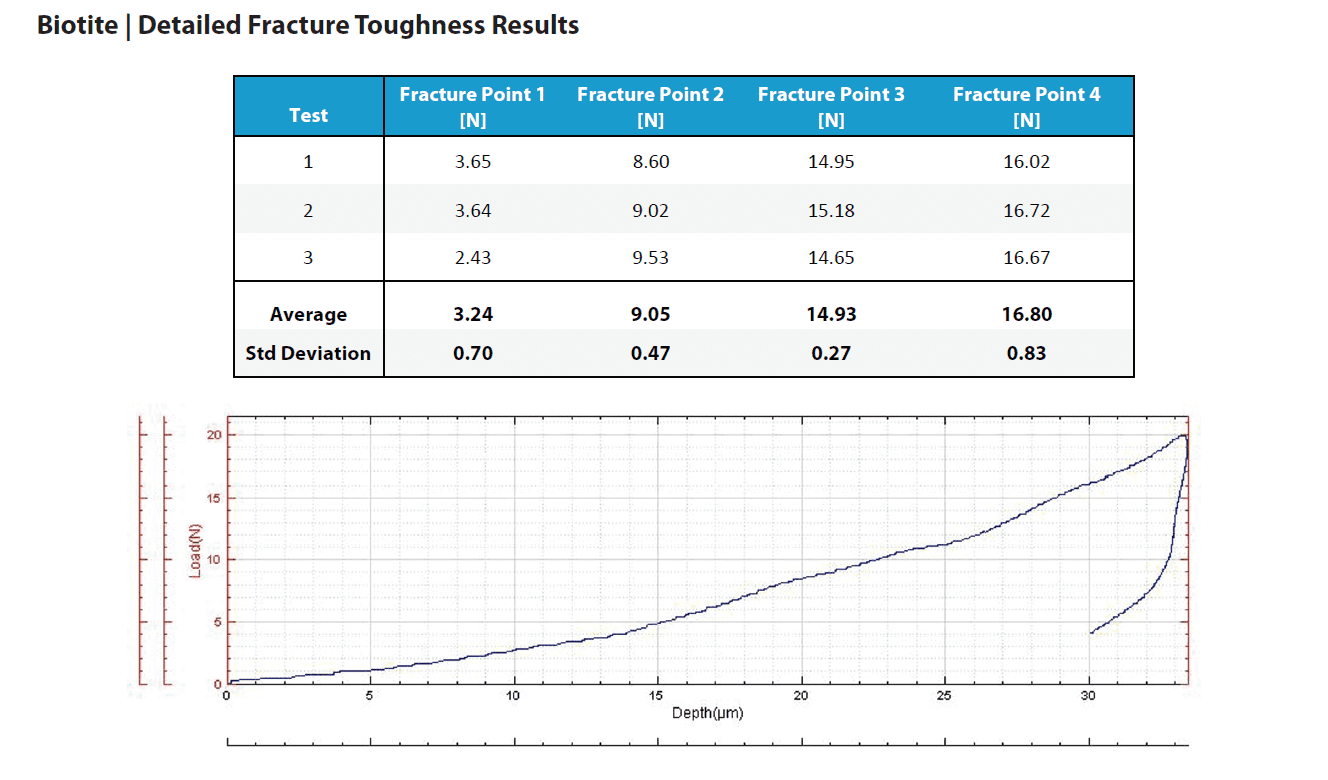
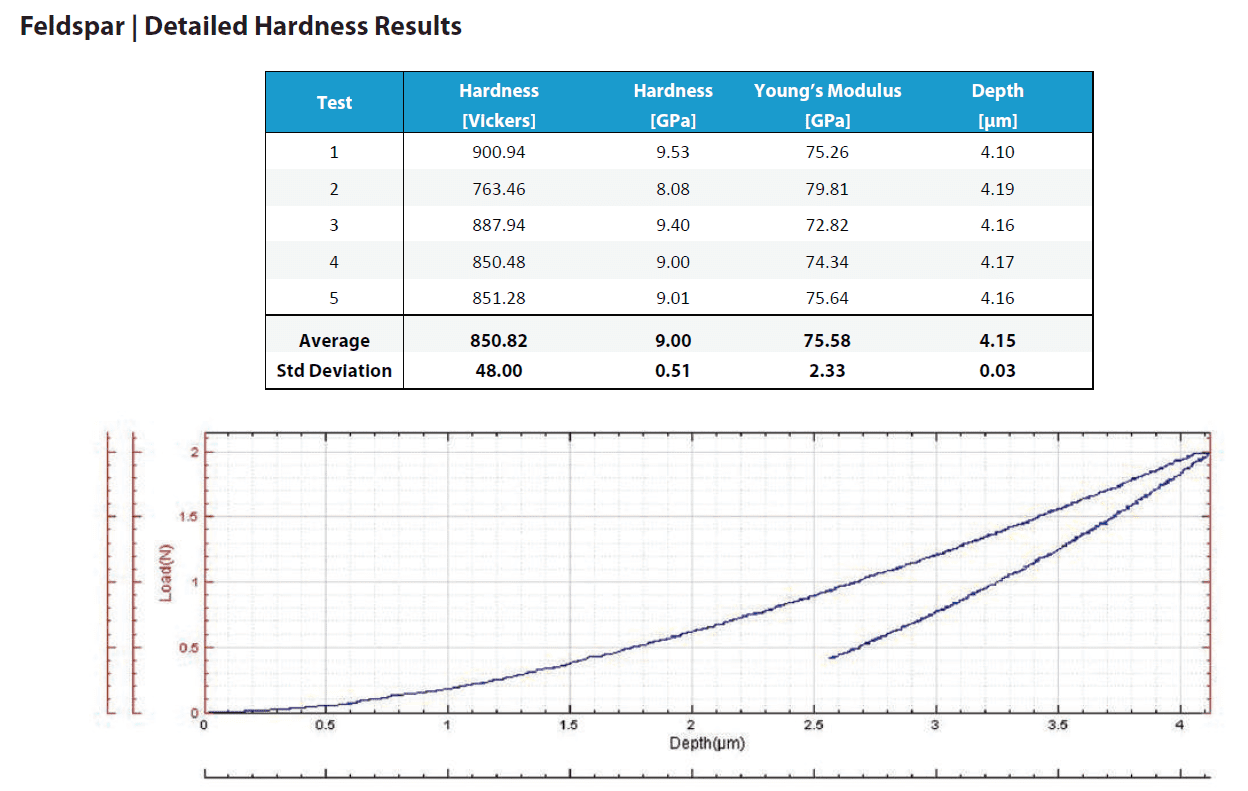
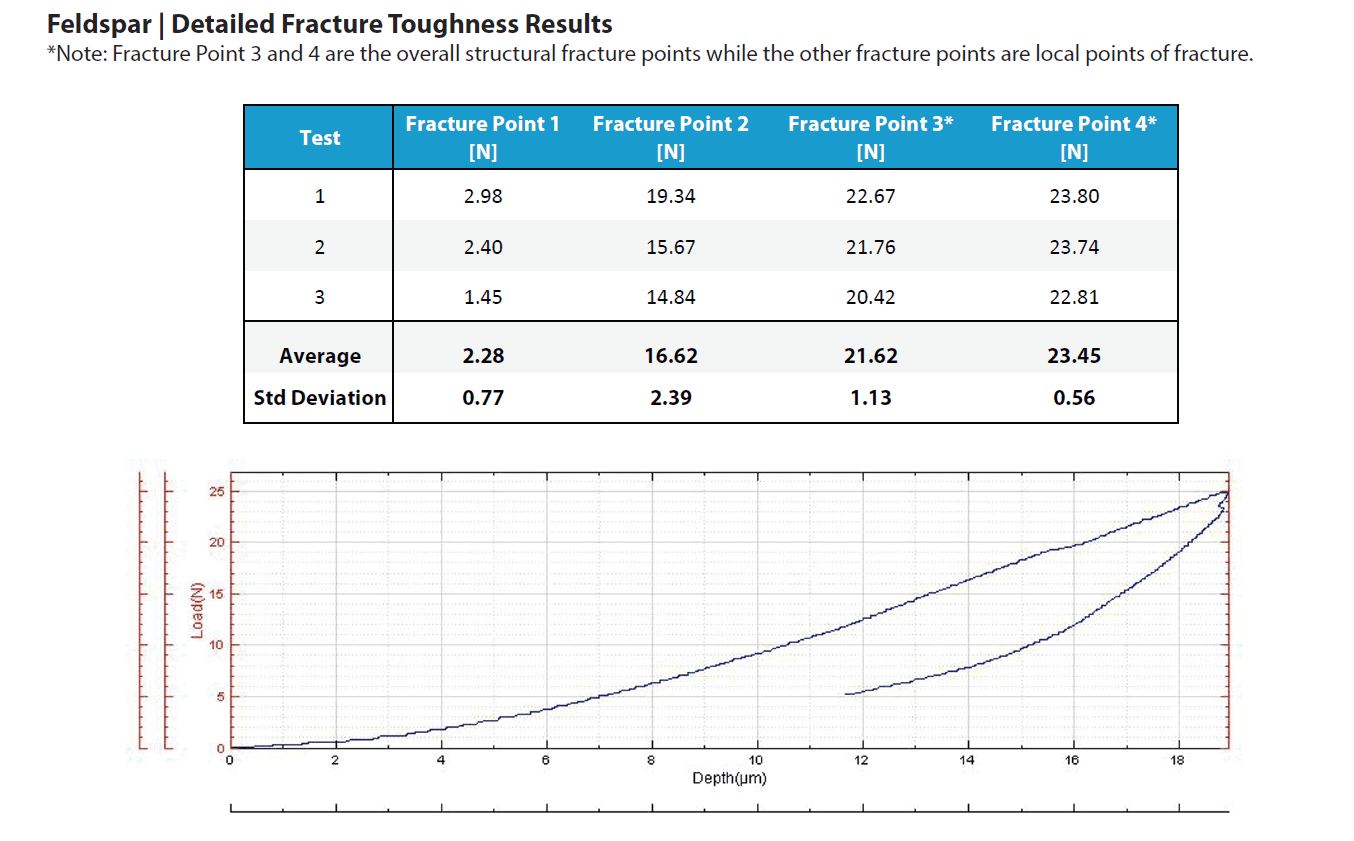
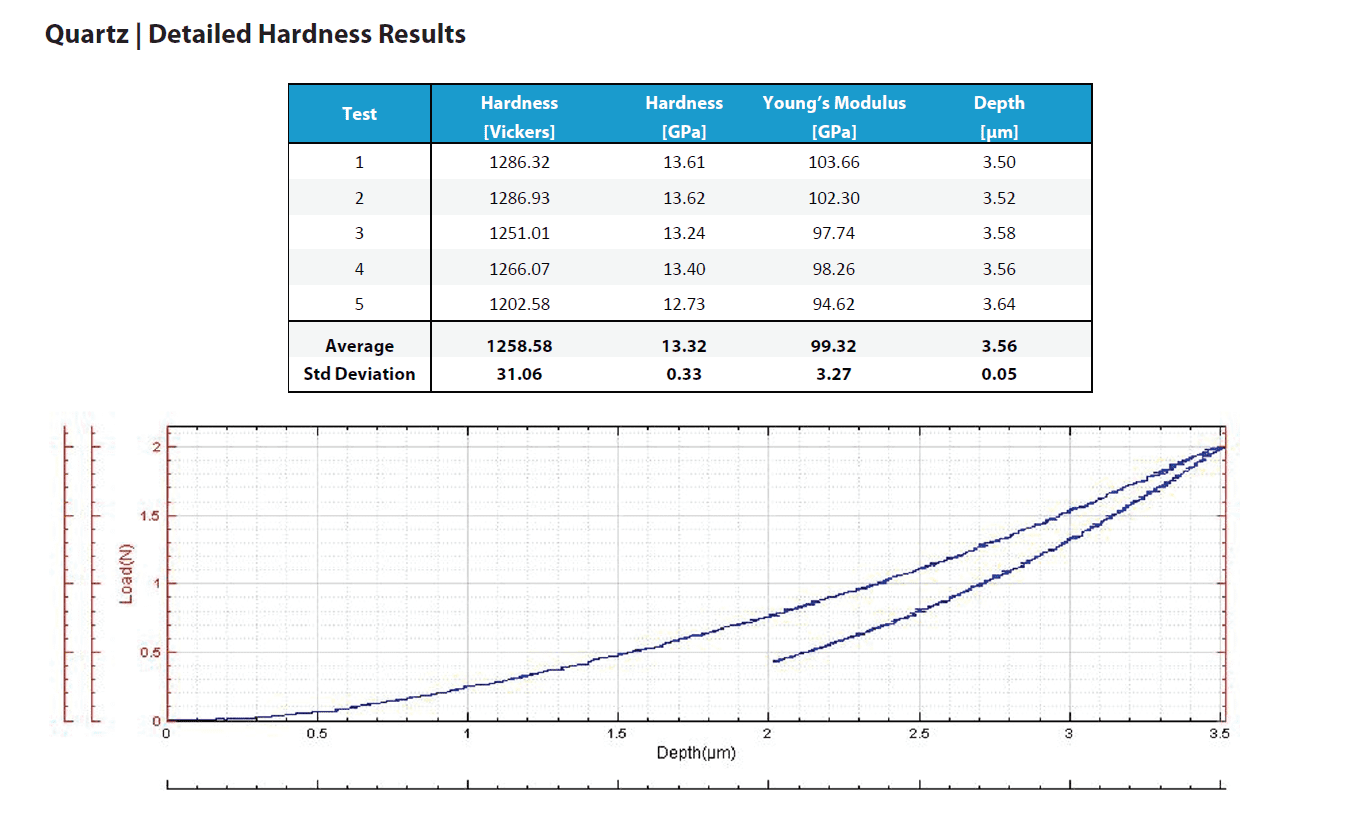
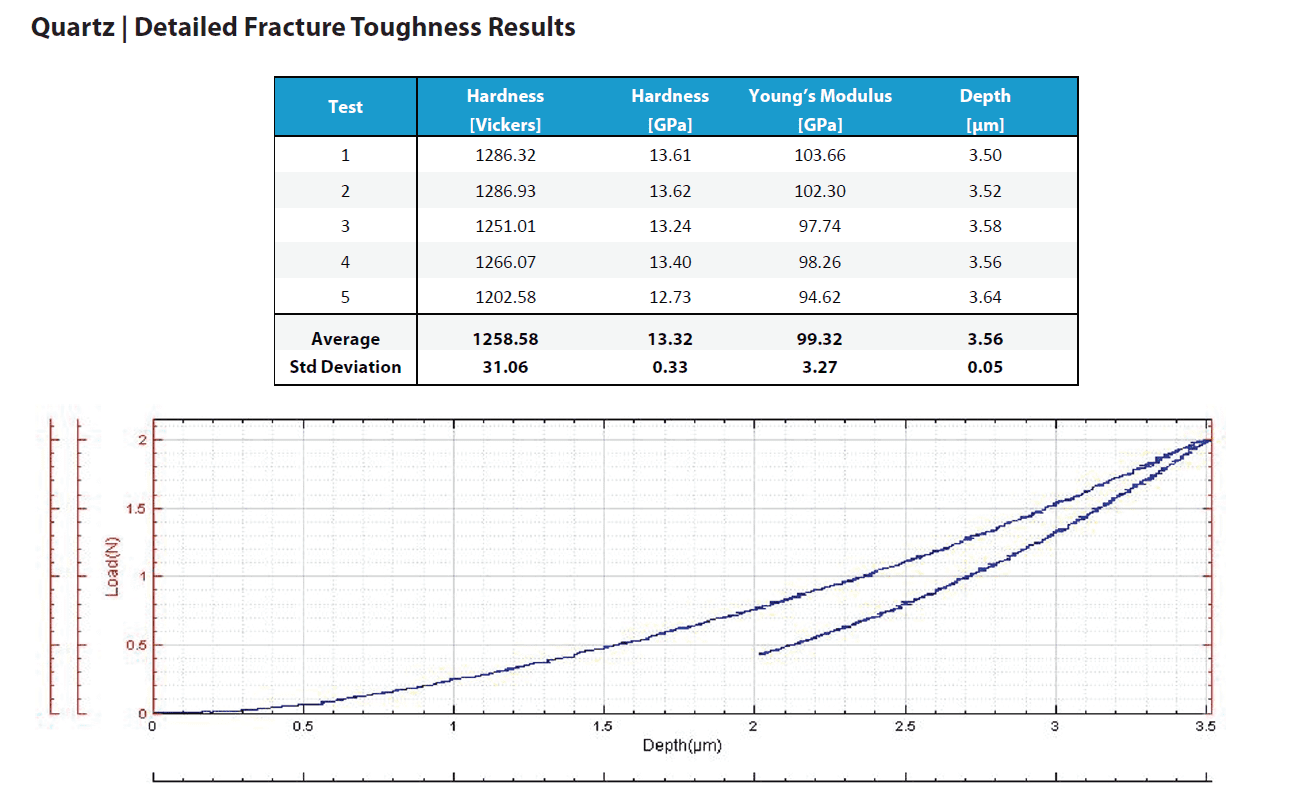
In this application the Nanovea mechanical tester measures the Vickers hardness (Hv), Young’s modulus, and fracture toughness of a mineral rock sample. The rock is made up of biotite, feldspar and quartz which form the standard granite composite. Each is tested separately.
RESULTS AND DISCUSSION
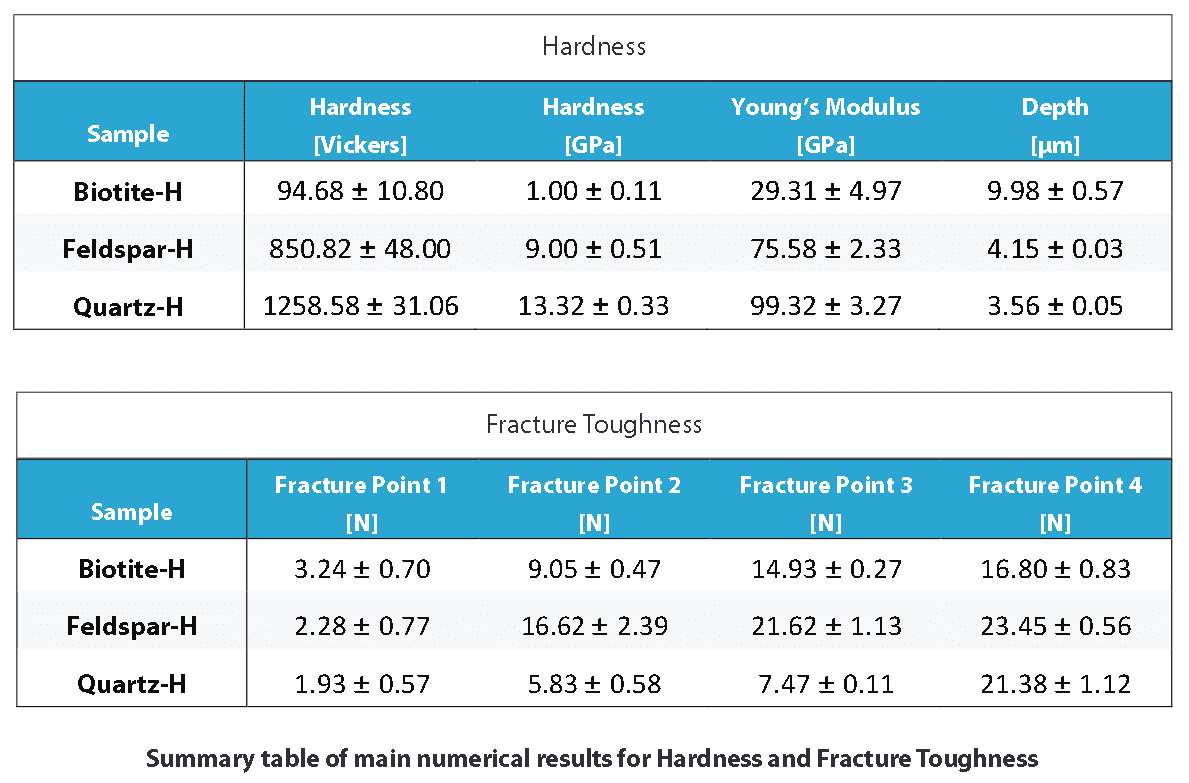
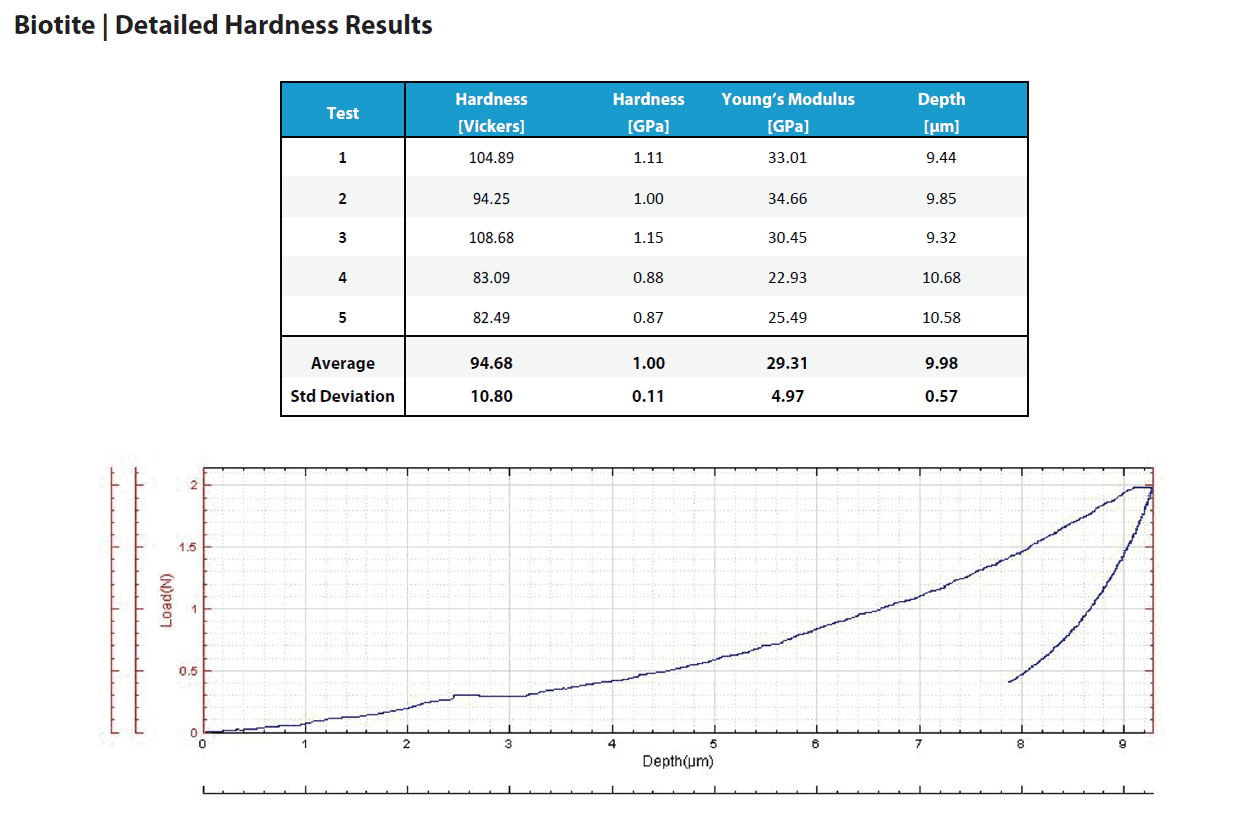
This section includes a summary table that compares the main numerical results for the different samples, followed by the full result listings, including each indentation performed, accompanied by micrographs of the indentation, when available. These full results present the measured values of Hardness and Young’s modulus as the penetration depth (Δd) with their averages and standard deviations. It should be considered that large variation in the results can occur in the case that the surface roughness is in the same size range as the indentation.
Summary table of main numerical results for Hardness and Fracture Toughness
CONCLUSION
The Nanovea mechanical tester demonstrates reproducibility and precise indentation results on the hard surface of mineral rock. Hardness and Young’s modulus of each material forming the granite was measured directly from depth versus load curves. The rough surface meant testing at higher loads that may have caused micro cracking. Micro cracking would explain some of the variations seen in measurements. Cracks were not perceivable through standard microscopy observation because of a rough sample surface. Therefore, it is not possible to calculate traditional fracture toughness numbers that requires cracks length measurements. Instead, we used the system to detect initiation of cracks through the dislocations in the depth versus load curves while increasing loads.
Fracture threshold loads were reported at loads where failures occurred. Unlike traditional fracture toughness tests that simply measure crack length, a load is obtained at which threshold fracture starts. Additionally, the controlled and closely monitored environment allows the measurement of hardness to use as a quantitative value for comparing a variety of samples.
NOW, LET'S TALK ABOUT YOUR APPLICATION

Scratch Resistance of Cellphone Screen Protectors
Importance of Testing Screen Protectors
Although phone screens are designed to resist shattering and scratching, they are still susceptible to damage. Daily phone usage causes them to wear and tear, e.g. accumulate scratches and cracks. Since repairing these screens can be expensive, screen protectors are an affordable damage prevention item commonly purchased and used to increase a screen’s durability.
Using the Nanovea PB1000 Mechanical Tester’s Macro Module in conjunction with the acoustic emissions (AE) sensor, we can clearly identify critical loads at which screen protectors show failure due to scratch1 testing to create a comparative study between two types of screen protectors.
Two common types of screen protector materials are TPU (thermoplastic polyurethane) and tempered glass. Of the two, tempered glass is considered the best as it provides better impact and scratch protection. However, it is also the most expensive. TPU screen protectors on the other hand, are less expensive and a popular choice for consumers who prefer plastic screen protectors. Since screen protectors are designed to absorb scratches and impacts and are usually made of materials with brittle properties, controlled scratch testing paired with in-situ AE detection is an optimal test setup for determining the loads at which cohesive failures (e.g. cracking, chipping and fracture) and/or adhesive failures (e.g. delamination and spallation) occur.
Measurement Objective
In this study, three scratch tests were performed on two different commercial screen protectors using Nanovea’s PB1000 Mechanical Tester’s Macro Module. By using an acoustic emissions sensor and optical microscope, the critical loads at which each screen protector showed failure(s) were identified.
Test Procedure and Procedures
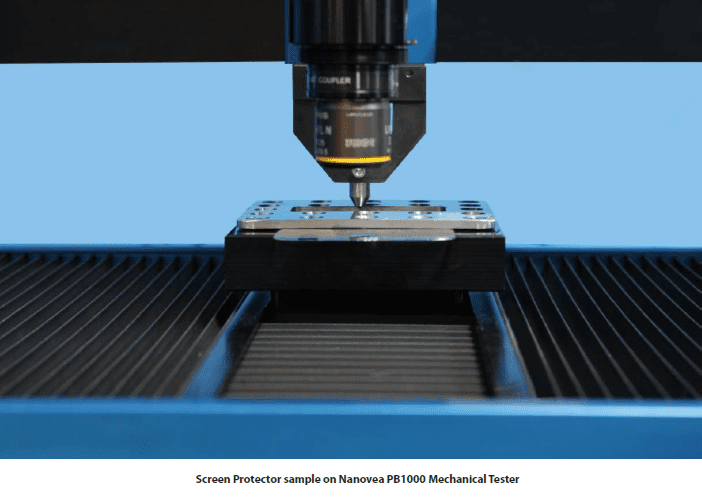
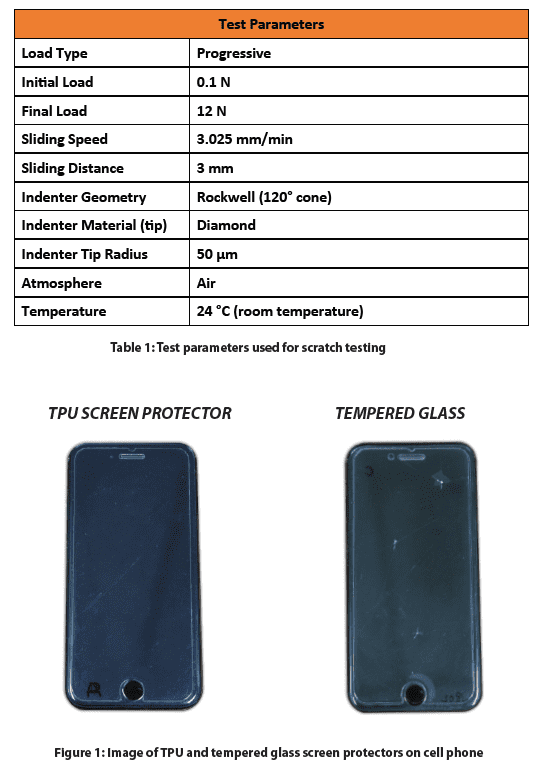
The Nanovea PB1000 Mechanical Tester was used to test two screen protectors applied onto a phone screen and clamped down to a friction sensor table. The test parameters for all scratches are tabulated in Table 1 below.
Results and Discussion
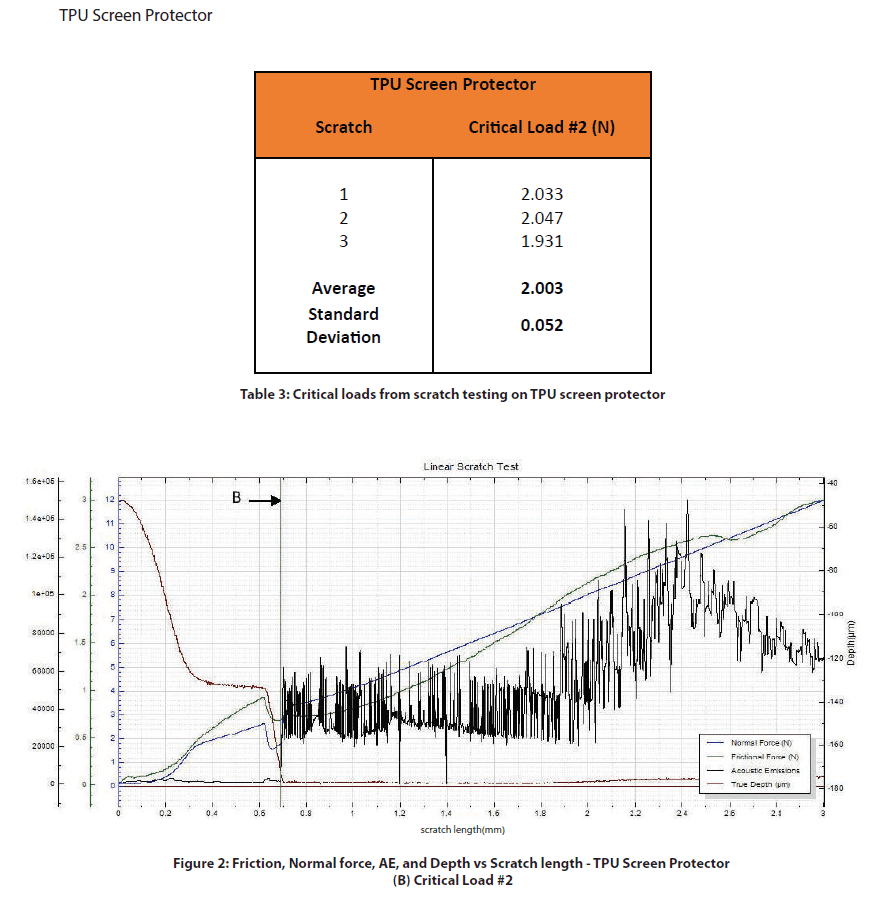
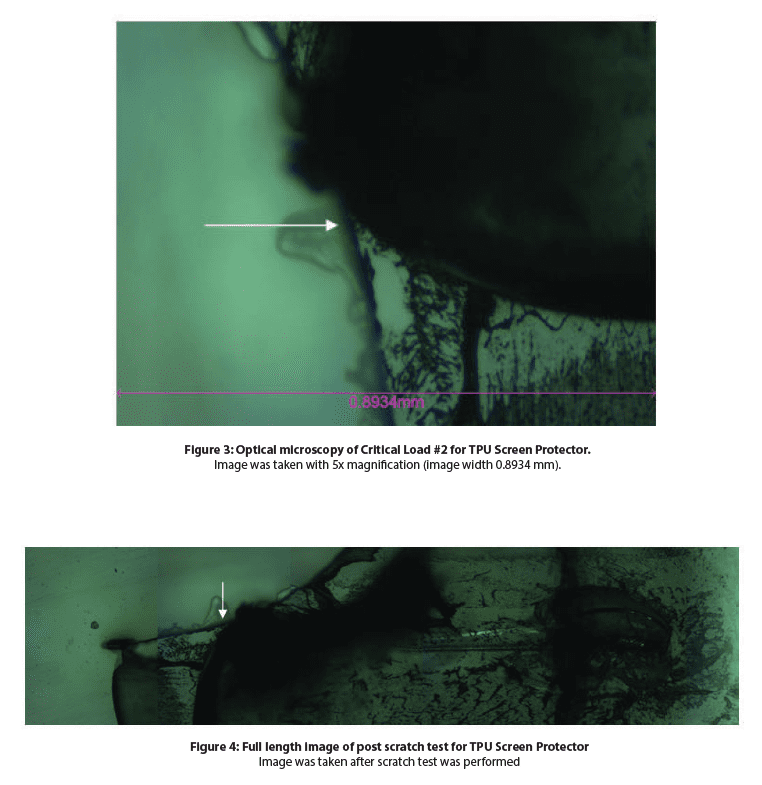
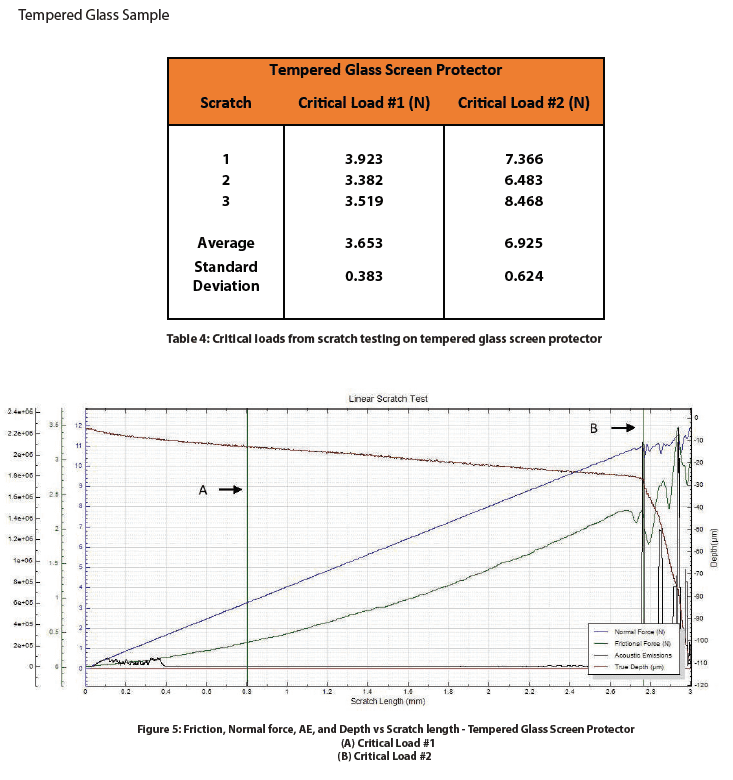
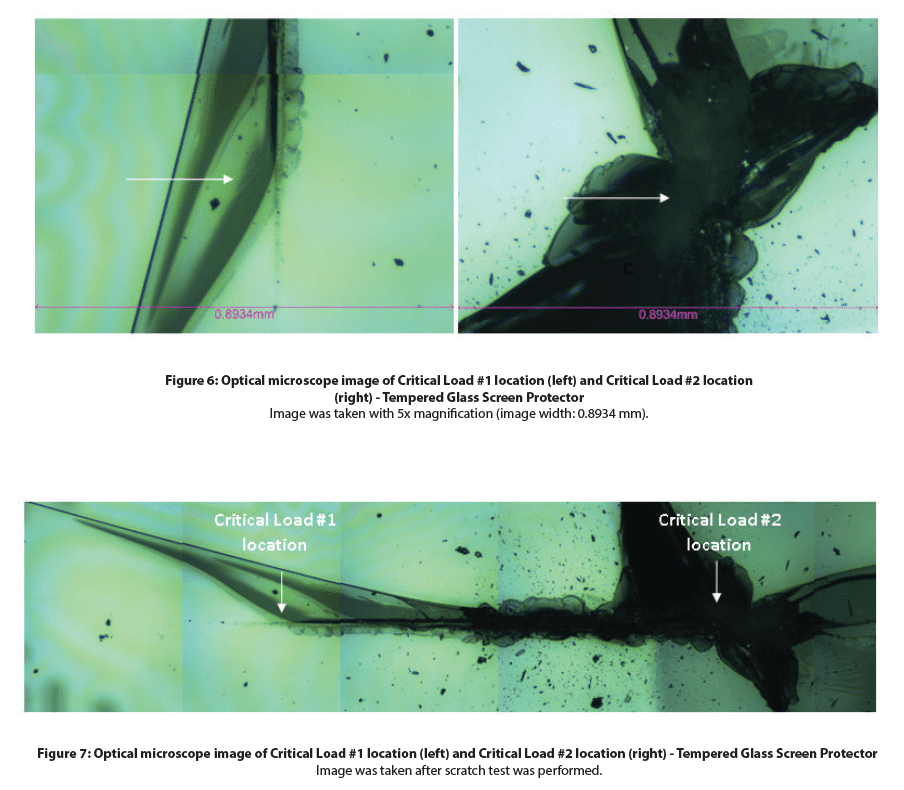
Because the screen protectors were made of a different material, they each exhibited varying types of failures. Only one critical failure was observed for the TPU screen protector whereas the tempered glass screen protector exhibited two. The results for each sample are shown in Table 2 below. Critical load #1 is defined as the load at which the screen protectors started to show signs of cohesive failure under the microscope. Critical load #2 is defined by the first peak change seen in the acoustic emissions graph data.
For the TPU screen protector, Critical load #2 correlates to the location along with the scratch where the protector began to visibly peel off the phone screen. A scratch appeared on the surface of the phone screen once Critical load #2 was surpassed for the remainder of the scratch tests. For the Tempered Glass screen protector, Critical load #1 correlates to the location where radial fractures began to appear. Critical load #2 happens towards the end of the scratch at higher loads. The acoustic emission is a larger magnitude than the TPU screen protector, however, no damage was done to the phone screen. In both cases, Critical load #2 corresponded to a large change in depth, indicating the indenter had pierced through the screen protector.
Conclusion

In this study we showcase the Nanovea PB1000 Mechanical Tester’s ability to perform controlled and repeat-able scratch tests and simultaneously use acoustic emission detection to accurately identify the loads at which adhesive and cohesive failure occur in screen protectors made of TPU and tempered glass. The experimental data presented in this document supports the initial assumption that Tempered Glass performs the best for scratch prevention on phone screens.
The Nanovea Mechanical Tester offers accurate and repeatable indentation, scratch, and wear measurement capabilities using ISO and ASTM compliant Nano and Micro modules. The Mechanical Tester is a complete system, making it the ideal solution for determining the full range of mechanical properties of thin or thick, soft or hard coatings, films, and substrates.
NOW, LET'S TALK ABOUT YOUR APPLICATION
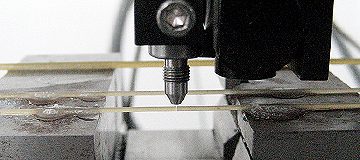
3 Point Bend Test Using Microindentation
In this application, the Nanovea Mechanical Tester, in Microindentation mode, is used to measure the flexural strength (using 3 Point Bend) of various sized rod samples (pasta) to show a range of data. 2 different diameters were chosen to demonstrate both elastic and brittle characteristics. Using a flat tip indenter to apply a point load, we determine stiffness (Young’s Modulus) and identify the critical loads at which the sample will fracture.
Categories
- Application Notes
- Block on Ring Tribology
- Corrosion Tribology
- Friction Testing | Coefficient of Friction
- High Temperature Mechanical Testing
- High Temperature Tribology
- Humidity and Gases Tribology
- Humidity Mechanical Testing
- Indentation | Creep and Relaxation
- Indentation | Fracture Toughness
- Indentation | Hardness and Elastic
- Indentation | Loss and Storage
- Indentation | Stress vs Strain
- Indentation | Yield Strength and Fatigue
- Laboratory Testing
- Linear Tribology
- Liquid Mechanical Testing
- Liquid Tribology
- Low Temperature Tribology
- Mechanical Testing
- Press Release
- Profilometry | Flatness and Warpage
- Profilometry | Geometry and Shape
- Profilometry | Roughness and Finish
- Profilometry | Step Height and Thickness
- Profilometry | Texture and Grain
- Profilometry | Volume and Area
- Profilometry Testing
- Ring on Ring Tribology
- Rotational Tribology
- Scratch Testing | Adhesive Failure
- Scratch Testing | Cohesive Failure
- Scratch Testing | Multi-Pass Wear
- Scratch Testing | Scratch Hardness
- Scratch Testing Tribology
- Tradeshow
- Tribology Testing
- Uncategorized
Archives
- September 2023
- August 2023
- June 2023
- May 2023
- July 2022
- May 2022
- April 2022
- January 2022
- December 2021
- November 2021
- October 2021
- September 2021
- August 2021
- July 2021
- June 2021
- May 2021
- March 2021
- February 2021
- December 2020
- November 2020
- October 2020
- September 2020
- July 2020
- May 2020
- April 2020
- March 2020
- February 2020
- January 2020
- November 2019
- October 2019
- September 2019
- August 2019
- July 2019
- June 2019
- May 2019
- April 2019
- March 2019
- January 2019
- December 2018
- November 2018
- October 2018
- September 2018
- July 2018
- June 2018
- May 2018
- April 2018
- March 2018
- February 2018
- November 2017
- October 2017
- September 2017
- August 2017
- June 2017
- May 2017
- April 2017
- March 2017
- February 2017
- January 2017
- November 2016
- October 2016
- August 2016
- July 2016
- June 2016
- May 2016
- April 2016
- March 2016
- February 2016
- January 2016
- December 2015
- November 2015
- October 2015
- September 2015
- August 2015
- July 2015
- June 2015
- May 2015
- April 2015
- March 2015
- February 2015
- January 2015
- November 2014
- October 2014
- September 2014
- August 2014
- July 2014
- June 2014
- May 2014
- April 2014
- March 2014
- February 2014
- January 2014
- December 2013
- November 2013
- October 2013
- September 2013
- August 2013
- July 2013
- June 2013
- May 2013
- April 2013
- March 2013
- February 2013
- January 2013
- December 2012
- November 2012
- October 2012
- September 2012
- August 2012
- July 2012
- June 2012
- May 2012
- April 2012
- March 2012
- February 2012
- January 2012
- December 2011
- November 2011
- October 2011
- September 2011
- August 2011
- July 2011
- June 2011
- May 2011
- November 2010
- January 2010
- April 2009
- March 2009
- January 2009
- December 2008
- October 2008
- August 2007
- July 2006
- March 2006
- January 2005
- April 2004


