USA/GLOBAL: +1-949-461-9292
EUROPE: +39-011-3052-794
CONTACT US

In Situ Wear Measurement at High Temperature

IN SITU WEAR MEASUREMENT AT HIGH TEMPERATURE

USING TRIBOMETER

IN-SITU WEAR MEASUREMENT Aerospace Tribometer

Prepared by

Duanjie Li, PhD

INTRODUCTION

The Linear Variable Differential Transformer (LVDT) is a type of robust electrical transformer used to measure linear displacement. It has been widely used in a variety of industrial applications, including power turbines, hydraulics, automation, aircraft, satellites, nuclear reactors, and many others.

In this study, we feature the add-ons of LVDT and high temperature modules of the NANOVEA Tribometer which allow the change of wear track depth of the tested sample to be measured during the wear process at elevated temperatures. This enables users to correlate different stages of wear process with the evolution of COF, which is critical in improving fundamental understanding of the wear mechanism and tribological characteristics of the materials for high temperature applications.

MEASUREMENT OBJECTIVE

In this study. we would like to showcase the capacity of NANOVEA T50 Tribometer for in situ monitoring the evolution of the wear process of materials at elevated temperatures.

The wear process of the alumina silicate ceramic at different temperatures is simulated in a controlled and monitored manner.

NANOVEA

T50

TEST PROCEDURE

The tribological behavior, e. g. coefficient of friction, COF, and wear resistance of alumina silicate ceramic plates was evaluated by the NANOVEA Tribometer. The alumina silicate ceramic plate was heated up by a furnace from room temperature, RT, to elevated temperatures (400°C and 800°C), followed by the wear tests at such temperatures. 

For comparison, the wear tests were carried out when the sample cooled down from 800°C to 400°C and then to room temperature. An AI2O3 ball tip (6mm dia., Grade 100) was applied against the tested samples. The COF, wear depth and temperature were monitored in situ.

TEST PARAMETERS

of the pin-on-disk measurement

Tribometer LVDT Sample

The wear rate, K, was evaluated using the formula K=V/(Fxs)=A/(Fxn), where V is the worn volume, F is the normal load, s is the sliding distance, A is the cross-sectional area of the wear track, and n is the number of revolution. Surface roughness and wear track profiles were evaluated by the NANOVEA Optical Profiler, and the wear track morphology was examined using an optical microscope.

RESULTS & DISCUSSION

The COF and wear track depth recorded in situ are shown in FIGURE 1 and FIGURE 2, respectively. In FIGURE 1, “-I” indicates the test performed when the temperature was increased from RT to an elevated temperature. “-D” represents the temperature decreased from a higher temperature of 800°C.

As shown in FIGURE 1, the samples tested at different temperatures exhibit a comparable COF of ~0.6 throughout the measurements. Such a high COF leads to an accelerated wear process which creates a substantial amount of debris. The wear track depth was monitored during the wear tests by LVDT as shown in FIGURE 2. The tests performed at room temperature before sample heating up and after sample cooling down show that the alumina silicate ceramic plate exhibits a progressive wear process at RT, the wear track depth gradually increases throughout the wear test to ~170 and ~150 μm, respectively. 

In comparison, the wear tests at elevated temperatures (400°C and 800°C) exhibit a different wear behavior – the wear track depth increases promptly at the beginning of the wear process, and it slows down as the test continues. The wear track depths for tests performed at temperatures 400°C-I, 800°C and 400°C-D are ~140, ~350 and ~210 μm, respectively.

COF during pin-on-desk Tests at different temperatures

FIGURE 1. Coefficient of Friction during pin-on-disk tests at different temperatures

Wear track depth of the alumina silicate ceramic plate at different temperatures

FIGURE 2. Evolution of wear track depth of the alumina silicate ceramic plate at different temperatures

The average wear rate and wear track depth of the alumina silicate ceramic plates at different temperatures were measured using NANOVEA Optical Profiler as summarized in FIGURE 3. The wear track depth is in agreement with that recorded using LVDT. The alumina silicate ceramic plate shows a substantially increased wear rate of ~0.5 mm3/Nm at 800°C, compared to the wear rates below 0.2mm3/N at temperatures below 400°C. The alumina silicate ceramic plate does not exhibit significantly enhanced mechanical/tribological properties after the short heating process, possessing a comparable wear rate before and after the heat treatment.

Alumina silicate ceramic, also knows as lava and wonderstone, is soft and machinable before heating treatment. A long process of firing at elevated temperatures up to 1093°C can substantially enhance its hardness and strength, after which diamond machining is required. Such a unique characteristic makes alumina silicate ceramic an ideal material for sculpture.

In this study, we show that heat treatment at a lower temperature that the one required for firing (800°C vs 1093°C) in a short time does not improve the mechanical and tribological characteristics of alumina silicate ceramic, making proper firing an essential process for this material before its usage in the real applications.

 
Wear rate and wear track depth of the sample at different temperatures 1

FIGURE 3. Wear rate and wear track depth of the sample at different temperatures

CONCLUSION

Based on the comprehensive tribological analysis in this study, we show that the alumina silicate ceramic plate exhibits comparable coefficient of friction at different temperatures from room temperature to 800°C. However, it shows a substantially increased wear rate of ~0.5 mm3/Nm at 800°C, demonstrating the importance of proper heat treatment of this ceramic.

NANOVEA Tribometers are capable of evaluating the tribological properties of materials for applications at high temperatures up to 1000°C. The function of in situ COF and wear track depth measurements allows users to correlate different stages of wear process with the evolution of COF, which is critical in improving fundamental understanding of the wear mechanism and tribological characteristics of the materials used at elevated temperatures.

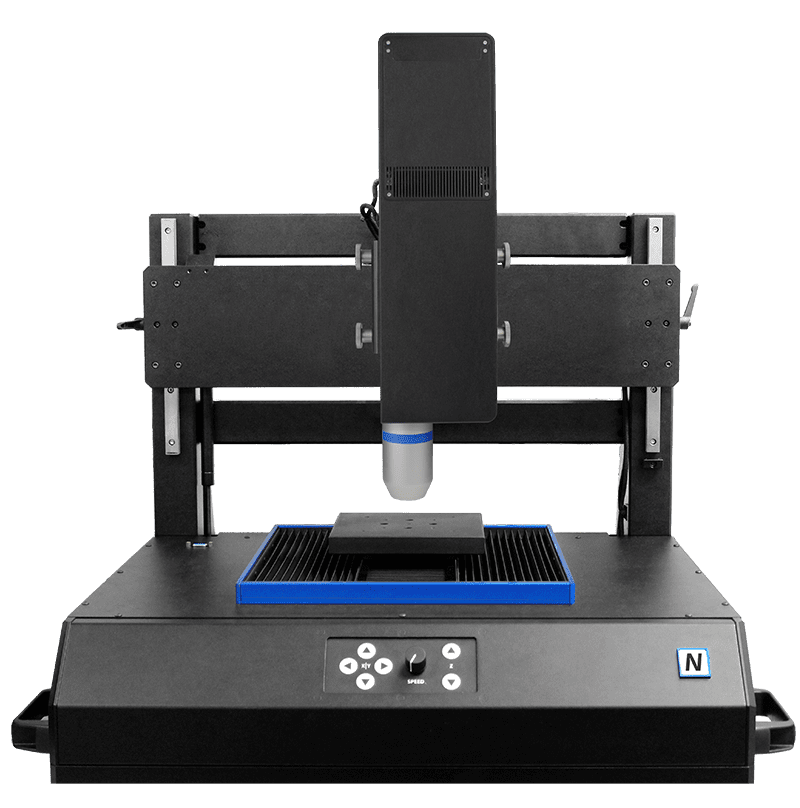
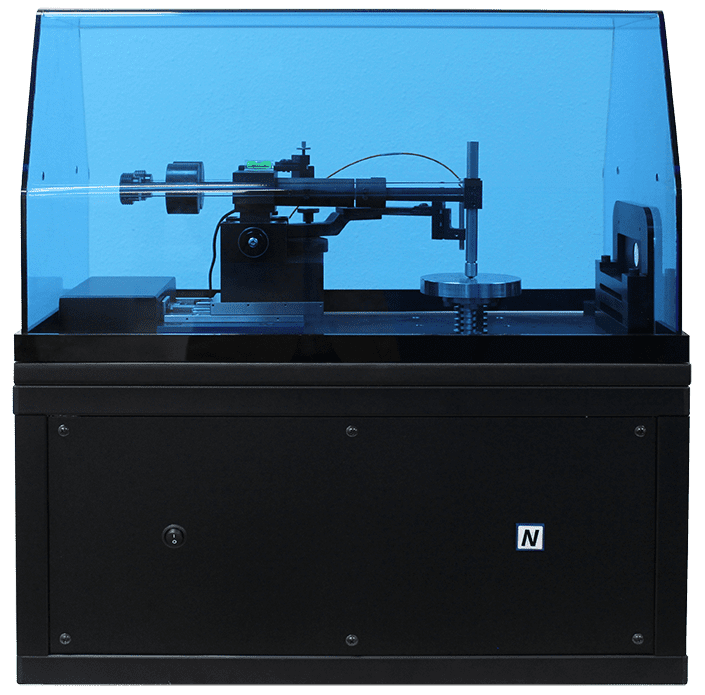
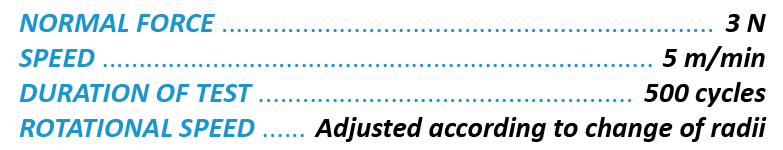
NANOVEA Tribometers offer precise and repeatable wear and friction testing using ISO and ASTM compliant rotative and linear modes, with optional high temperature wear, lubrication and tribo-corrosion modules available in one pre-integrated system. NANOVEA’s unmatched range is an ideal solution for determining the full range of tribological properties of thin or thick, soft or hard coatings, films and substrates.

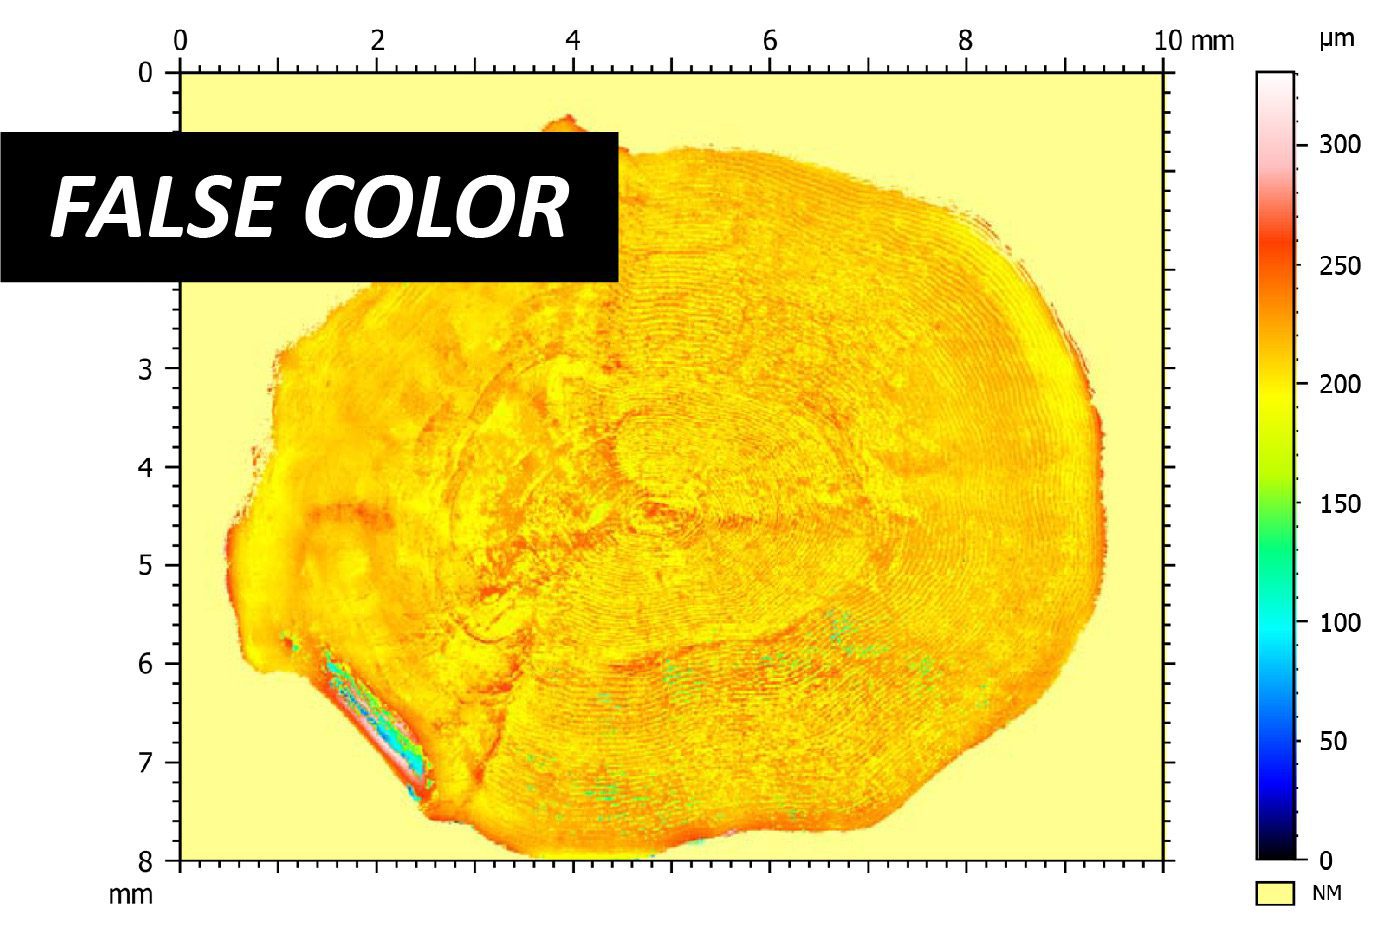
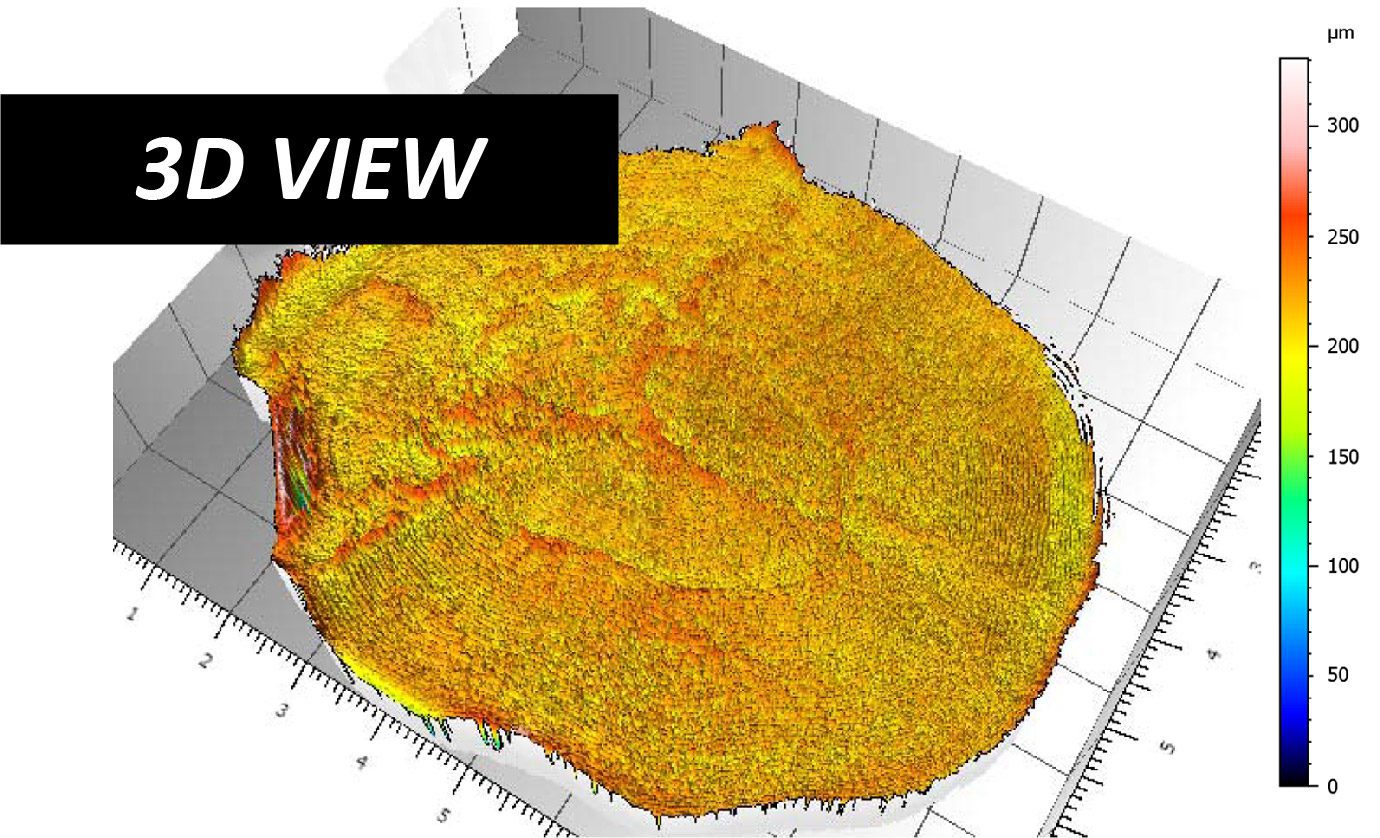
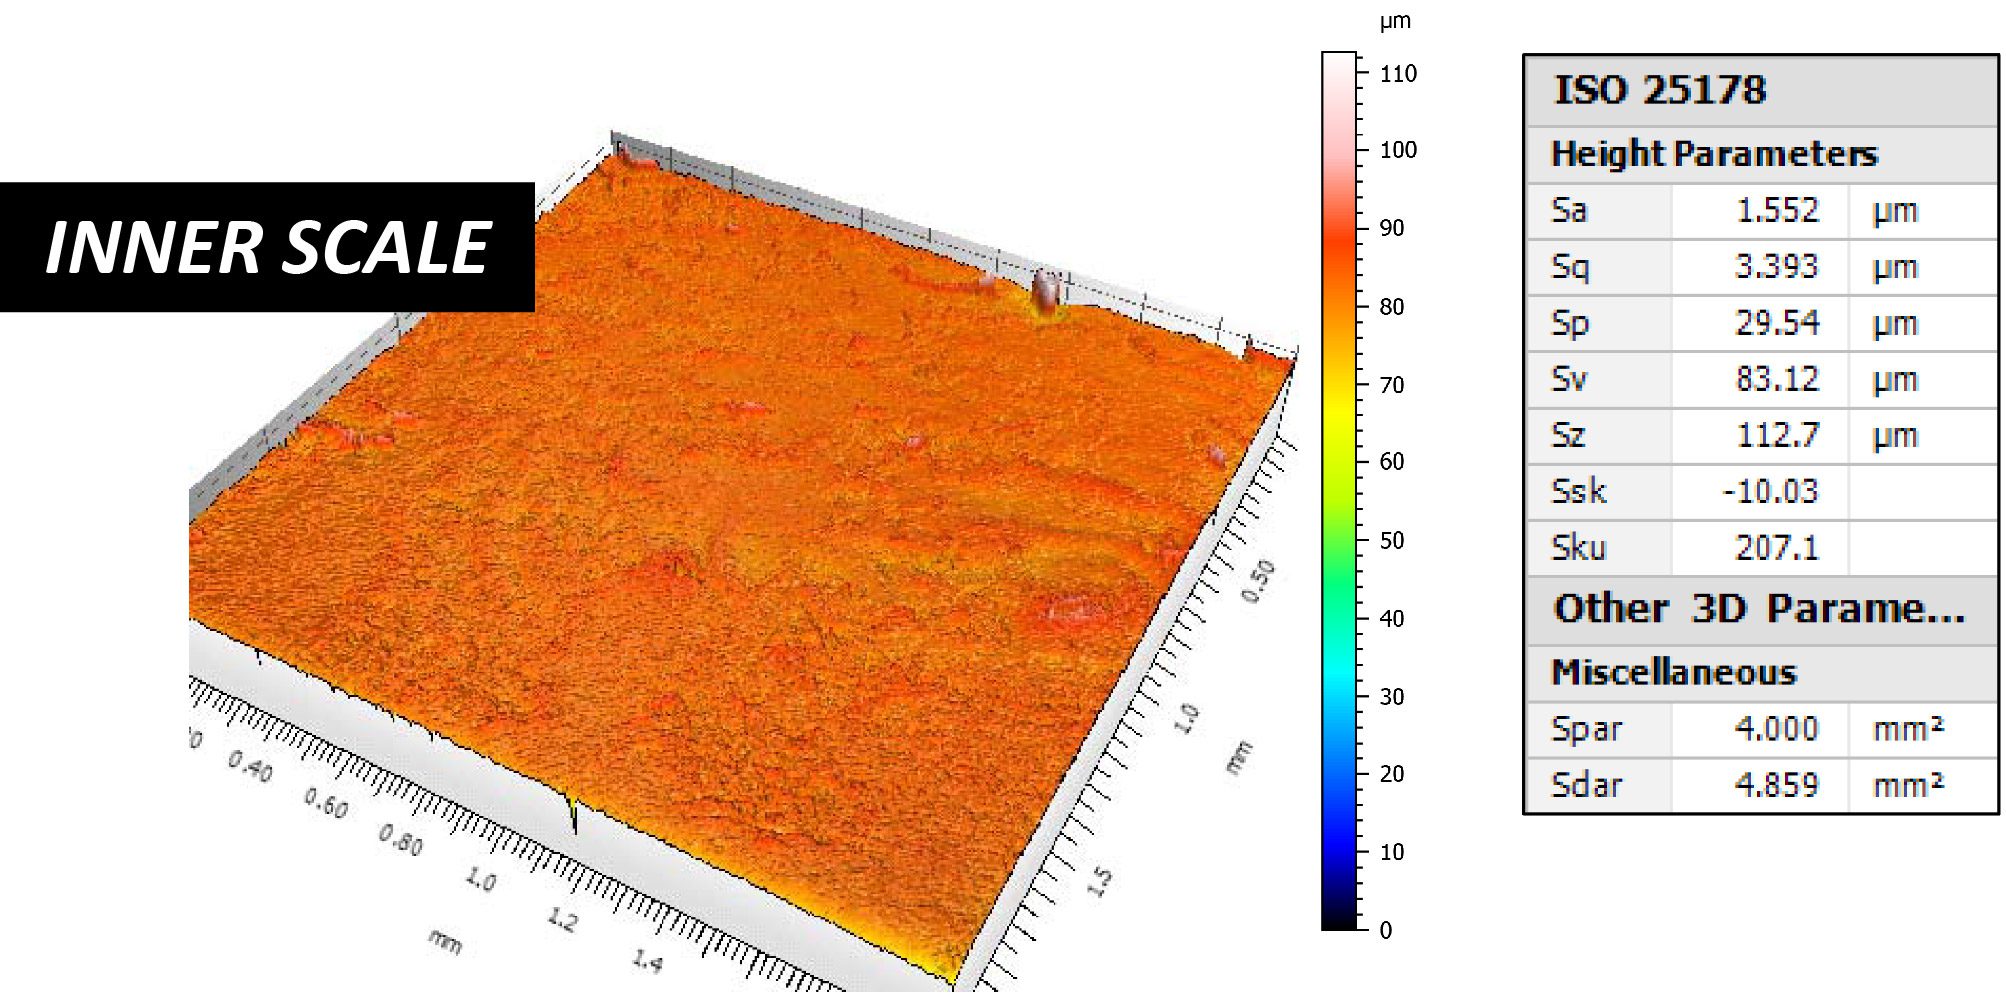
Optional 3D Non-Contact Profilers are available for high resolution 3D imaging of wear tracks in addition to other surface measurements such as roughness.

IN-SITU WEAR MEASUREMENT

NOW, LET'S TALK ABOUT YOUR APPLICATION

Fish Scale Surface Analysis Using 3D Optical Profiler

Fish Scale Surface Analysis Using 3D Optical Profiler

Learn more


FISH SCALE SURFACE ANALYSIS

using 3D OPTICAL PROFILER

Fish Scales profilometer

Prepared by

Andrea Novitsky

INTRODUCTION

The morphology, patterns, and other features of a fish scale are studied using the NANOVEA 3D Non-Contact Optical Profiler. The delicate nature of this biological sample along with its very small and high angled grooves also highlights the importance of the profiler’s non-contact technique. The grooves on the scale are called circuli, and can be studied to estimate the age of the fish, and even distinguish periods of different rates of growth, similar to the rings of a tree. This is very important information for the management of wild fish populations in order to prevent overfishing.

Importance of 3D Non-Contact Profilometry FOR BIOLOGICAL STUDIES

Unlike other techniques such as touch probes or interferometry, the 3D Non-Contact Optical Profiler, using axial chromatism, can measure nearly any surface. Sample sizes can vary widely due to open staging and there is no sample preparation needed. Nano through macro range features are obtained during a surface profile measurement with zero influence from sample reflectivity or absorption. The instrument provides an advanced ability to measure high surface angles with no software manipulation of the results. Any material can be easily measured, whether it’s transparent, opaque, specular, diffusive, polished or rough. The technique provides an ideal, broad and user friendly capability to maximize surface studies along with the benefits of combined 2D & 3D capabilities.

MEASUREMENT OBJECTIVE

In this application, we showcase NANOVEA ST400, a 3D Non-Contact Profiler with a high-speed sensor, providing comprehensive analysis of the surface of a scale.

The instrument has been used to scan the entire sample, along with a higher resolution scan of the center area. The outer and inner side surface roughness of the scale was measured for comparison as well.

NANOVEA

ST400

3D & 2D Surface Characterization of Outer Scale

The 3D View and False Color View of the outer scale show a complex structure similar to a finger print or the rings of a tree. This provides users a straightforward tool to directly observe the surface characterization of the scale from different angles. Various other measurements of the outer scale are shown along with the comparison of the outer and inner side of the scale.

Fish Scale Scan 3D View Profilometer
Fish Scale Scan Volume 3D Profilometer
Fish Scale Scan Step Height 3D Optical Profiler

SURFACE ROUGHNESS COMPARISON

Fish Scale Profilometer 3D Scanning

CONCLUSION

In this application, we have shown how the NANOVEA 3D Non-Contact Optical Profiler can characterize a fish scale in a variety of ways. 

The outer and inner surfaces of the scale can be easily distinguished by surface roughness alone, with roughness values of 15.92μm and 1.56μm respectively. Additionally, precise and accurate information can be learned about a fish scale by analyzing the grooves, or circuli, on the outer surface of the scale. The distance of bands of circuli from the center focus were measured, and the height of the circuli were also found to be approximately 58μm high on average. 

The data shown here represents only a portion of the calculations available in the analysis software.

NOW, LET'S TALK ABOUT YOUR APPLICATION