USA/GLOBAL: +1-949-461-9292
EUROPE: +39-011-3052-794
CONTACT US

Mechanical Properties of Hydrogel

MECHANICAL PROPERTIES OF HYDROGEL

USING NANOINDENTATION

Prepared by

DUANJIE LI, PhD & JORGE RAMIREZ

INTRODUCTION

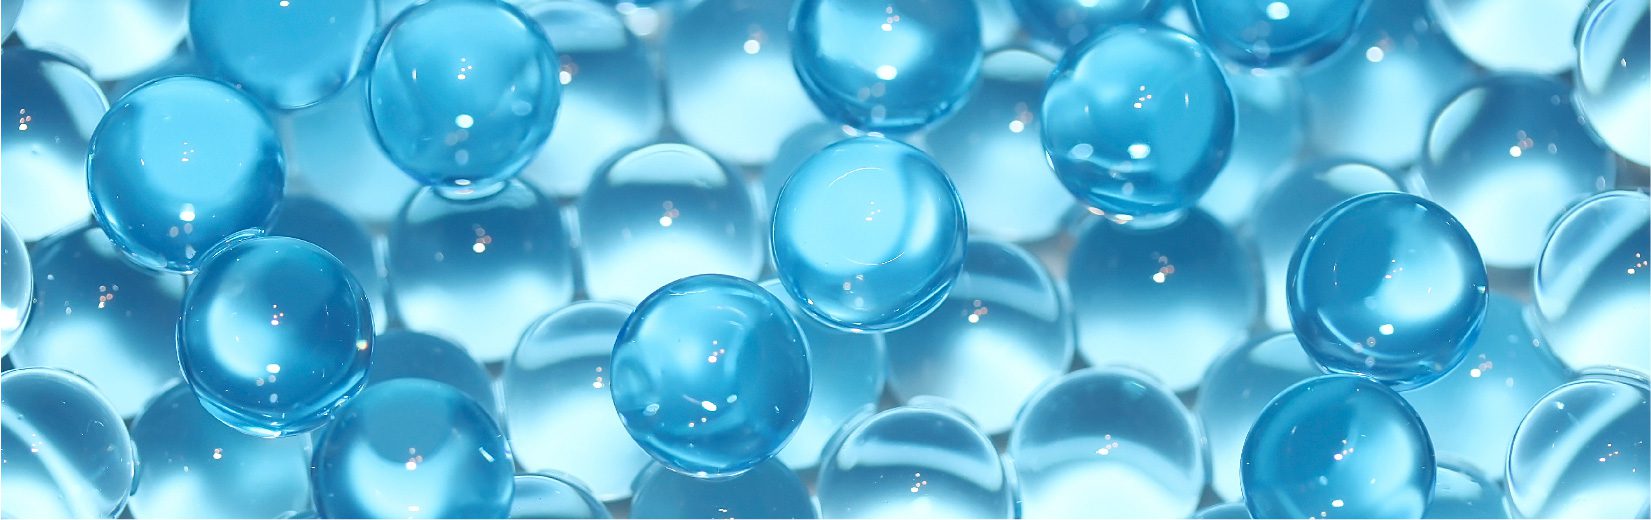
Hydrogel is known for its super absorbency of water allowing for a close resemblance in flexibility as natural tissues. This resemblance has made hydrogel a common choice not only in biomaterials, but also in electronics, environment and consumer good applications such as contact lens. Each unique application requires specific hydrogel mechanical properties.

IMPORTANCE OF NANOINDENTATION FOR HYDROGEL

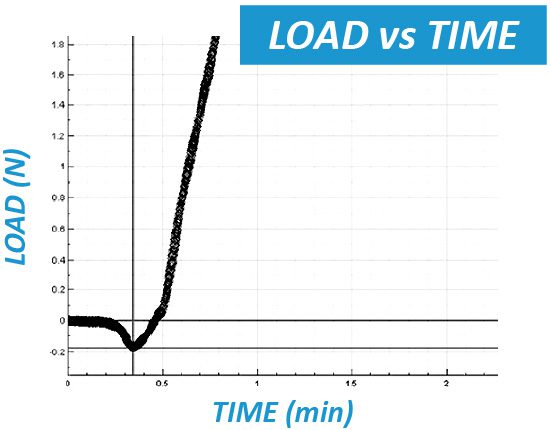
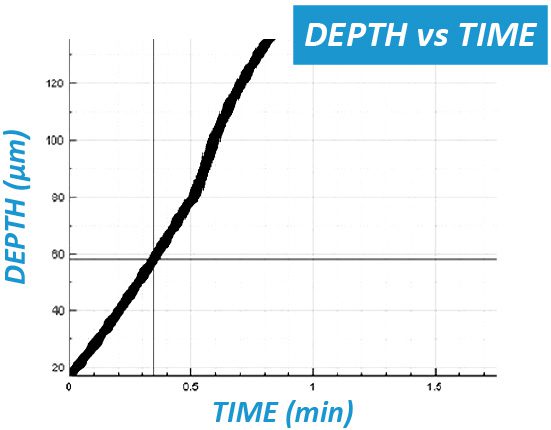
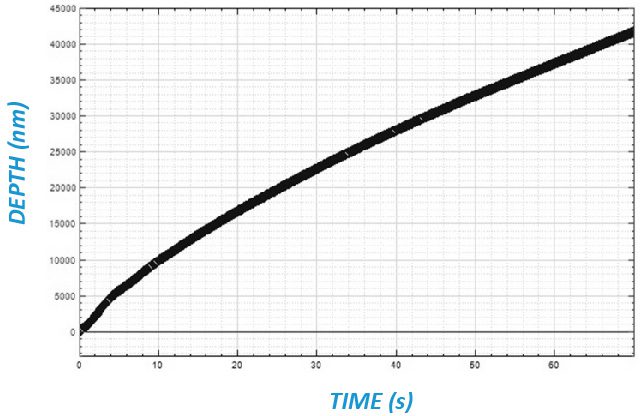
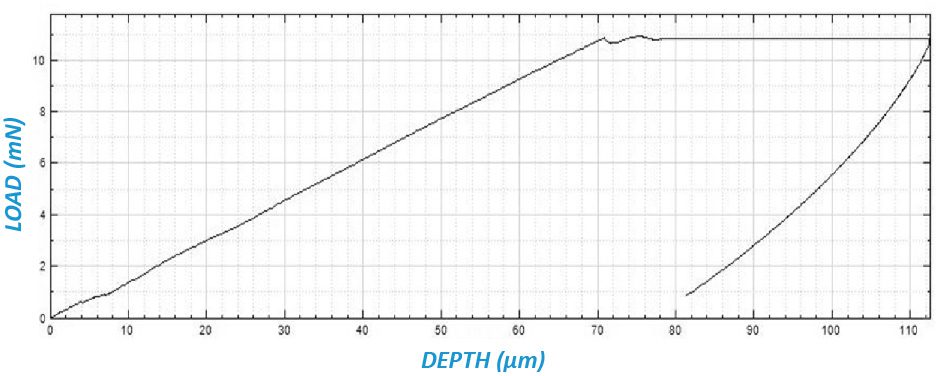
Hydrogels create unique challenges for Nanoindentation such as test parameters selection and sample preparation. Many nanoindentation systems have major limitations since they were not originally designed for such soft materials. Some of the nanoindentation systems use a coil/magnet assembly to apply force on the sample. There is no actual force measurement, leading to inaccurate and non-linear loading when testing soft materials. Determining the point of contact is extremely difficult as the depth is the only parameter actually being measured. It is almost impossible to observe the change of slope in the Depth vs Time plot during the period when the indenter tip is approaching the hydrogel material.

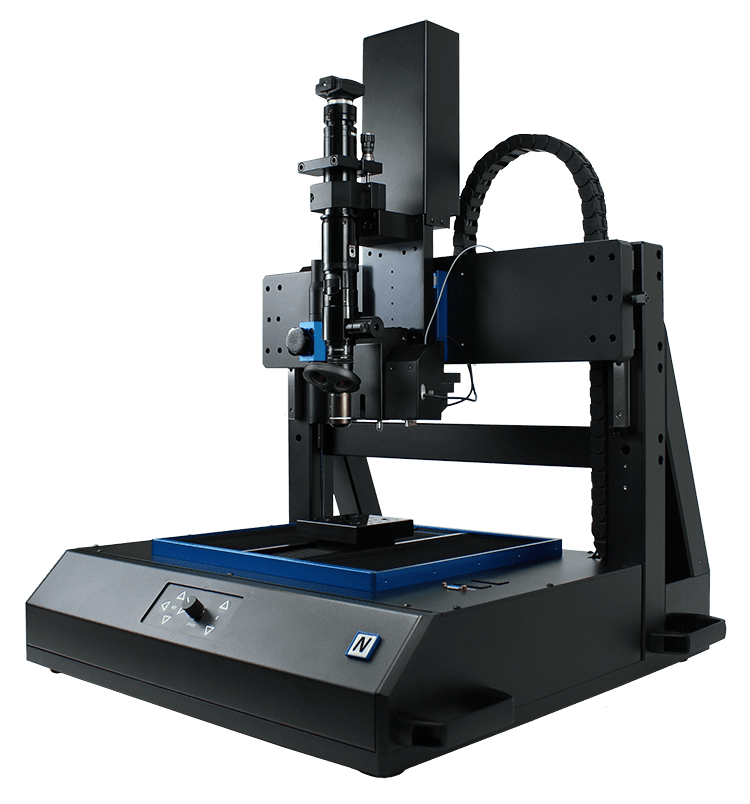
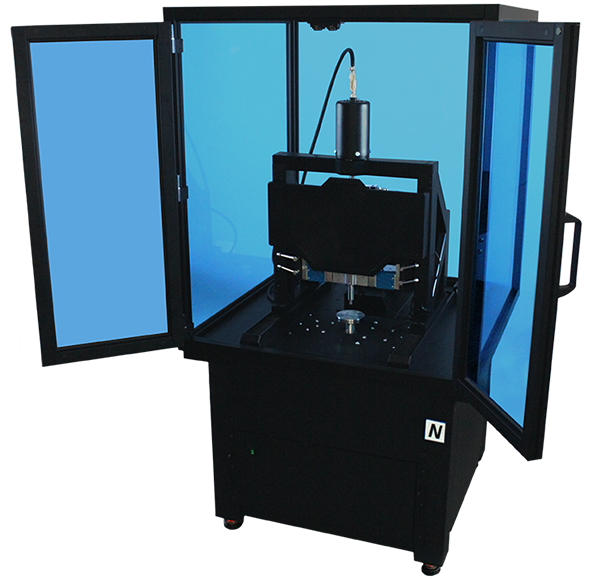
In order to overcome the limitations of these systems, the nano module of the NANOVEA Mechanical Tester measures the force feedback with an individual load cell to ensure high accuracy on all types of materials, soft or hard. The piezo-controlled displacement is extremely precise and fast. This allows unmatched measurement of viscoelastic properties by eliminating many theoretical assumptions that systems with a coil/magnet assembly and no force feedback must account for.

MEASUREMENT OBJECTIVE

In this application, the NANOVEA Mechanical Tester, in Nanoindentation mode, is used to study the hardness, elastic modulus and creep of a hydrogel sample.

NANOVEA

PB1000

TEST CONDITIONS

A hydrogel sample placed on a glass slide was tested by nanoindentation technique using a NANOVEA Mechanical Tester. For this soft material a 3 mm diameter spherical tip was used. The load linearly increased from 0.06 to 10 mN during the loading period. The creep was then measured by the change of indentation depth at the maximum load of 10 mN for 70 seconds.

APPROACH SPEED: 100 μm/min

CONTACT LOAD
0.06 mN
MAX LOAD
10 mN
LOADING RATE

20 mN/min

CREEP
70 s
RESULTS & DISCUSSION

The evolution of the load and depth as a function of time is shown in FUGURE 1. It can be observed that on the plot of the Depth vs Time, it is very difficult to determine the point of the change of slope at the beginning of the loading period, which usually works as an indication where the indenter starts to contact the soft material. However, the plot of the Load vs Time shows the peculiar behavior of the hydrogel under an applied load. As the hydrogel begins to get in touch with the ball indenter, the hydrogel pulls the ball indenter due to its surface tension, which tends to decrease the surface area. This behavior leads to the negative measured load at the beginning of the loading stage. The load progressively increases as the indenter sinks into the hydrogel, and it is then controlled to be constant at the maximum load of 10 mN for 70 seconds to study the creep behavior of the hydrogel.

FIGURE 1: Evolution of the load and depth as a function of Time.

The plot of the Creep Depth vs Time is shown in FIGURE 2, and the Load vs. Displacement plot of the nanoindentation test is shown in FIGURE 3. The hydrogel in this study possesses a hardness of 16.9 KPa and a Young’s modulus of 160.2 KPa, as calculated based on the load displacement curve using the Oliver-Pharr method.

Creep is an important factor for the study of a hydrogel’s mechanical properties. The close-loop feedback control between piezo and ultrasensitive load cell ensures a true constant loading during the creep time at the maximum load. As shown in FIGURE 2, the hydrogel subsides ~42 μm as a result of creep in 70 seconds under the 10 mN maximum load applied by the 3 mm ball tip.

FIGURE 2: Creeping at a max load of 10 mN for 70 seconds.

FIGURE 3: The Load vs. Displacement plot of the hydrogel.

CONCLUSION

In this study, we showcased that the NANOVEA Mechanical Tester, in Nanoindentation mode, provides a precise and repeatable measurement of a hydrogel’s mechanical properties including hardness, Young’s modulus and creep. The large 3 mm ball tip ensures proper contact against the hydrogel surface. The high precision motorized sample stage allows for accurate positioning of the flat face of the hydrogel sample under the ball tip. The hydrogel in this study exhibits a hardness of 16.9 KPa and a Young’s modulus of 160.2 KPa. The creep depth is ~42 μm under a 10 mN load for 70 seconds.

NANOVEA Mechanical Testers provide unmatched multi-function Nano and Micro modules on a single platform. Both modules include a scratch tester, hardness tester and a wear tester mode, offering the widest and the most user friendly range of testing available on a single
system.

NOW, LET'S TALK ABOUT YOUR APPLICATION

Piston Wear Testing

Piston Wear Testing

Using a Tribometer

Prepared by

FRANK LIU

INTRODUCTION

Friction loss accounts for approximately 10% of total energy in fuel for a diesel engine[1]. 40-55% of the friction loss comes from the power cylinder system. The loss of energy from friction can be diminished with better understanding of the tribological interactions occurring in the power cylinder system.

A significant portion of the friction loss in the power cylinder system stems from the contact between the piston skirt and the cylinder liner. The interaction between the piston skirt, lubricant, and cylinder interfaces is quite complex due to the constant changes in force, temperature, and speed in a real life engine. Optimizing each factor is key to obtaining optimal engine performance. This study will focus on replicating the mechanisms causing friction forces and wear at the piston skirt-lubricant-cylinder liner (P-L-C) interfaces.

 Schematic of power cylinders system and piston skirt-lubricant-cylinder liner interfaces.

[1] Bai, Dongfang. Modeling piston skirt lubrication in internal combustion engines. Diss. MIT, 2012

IMPORTANCE OF TESTING PISTONS WITH TRIBOMETERS

Motor oil is a lubricant that is well-designed for its application. In addition to the base oil, additives such as detergents, dispersants, viscosity improver (VI), anti-wear/anti-friction agents, and corrosion inhibitors are added to improve its performance. These additives affect how the oil behaves under different operating conditions. The behavior of oil affects the P-L-C interfaces and determines if significant wear from metal-metal contact or if hydrodynamic lubrication (very little wear) is occurring.

It is difficult to understand the P-L-C interfaces without isolating the area from external variables. It is more practical to simulate the event with conditions that are representative of its real-life application. The NANOVEA Tribometer is ideal for this. Equipped with multiple force sensors, depth sensor, a drop-by-drop lubricant module, and linear reciprocating stage, the NANOVEA T2000 is able to closely mimic events occurring within an engine block and obtain valuable data to better understand the P-L-C interfaces.

Liquid Module on the NANOVEA T2000 Tribometer

The drop-by-drop module is crucial for this study. Since pistons can move at a very fast rate (above 3000 rpm), it is difficult to create a thin film of lubricant by submerging the sample. To remedy this issue, the drop-by-drop module is able to consistently apply a constant amount of lubricant onto the piston skirt surface.

Application of fresh lubricant also removes concern of dislodged wear contaminants influencing the lubricant’s properties.

NANOVEA T2000

High Load Tribometer

MEASUREMENT OBJECTIVE

The piston skirt-lubricant-cylinder liner interfaces will be studied in this report. The interfaces will be replicated by conducting a linear reciprocating wear test with drop-by-drop lubricant module.

The lubricant will be applied at room temperature and heated conditions to compare cold start and optimal operation conditions. The COF and wear rate will be observed to better understand how the interfaces behaves in real-life applications.

TEST PARAMETERS

for tribology testing on pistons

LOAD ………………………. 100 N

TEST DURATION ………………………. 30 min

SPEED ………………………. 2000 rpm

AMPLITUDE ………………………. 10 mm

TOTAL DISTANCE ………………………. 1200 m

SKIRT COATING ………………………. Moly-graphite

PIN MATERIAL ………………………. Aluminum Alloy 5052

PIN DIAMETER ………………………. 10 mm

LUBRICANT ………………………. Motor Oil (10W-30)

APPROX. FLOW RATE ………………………. 60 mL/min

TEMPERATURE ………………………. Room temp & 90°C

LINEAR RECIPROCATING TEST RESULTS

In this experiment, A5052 was used as the counter material. While engine blocks are usually made of cast aluminum such as A356, A5052 have mechanical properties similar to A356 for this simulative testing [2].

Under the testing conditions, significant wear was
observed on the piston skirt at room temperature
compared to at 90°C. The deep scratches seen on the samples suggest that contact between the static material and the piston skirt occurs frequently throughout the test. The high viscosity at room temperature may be restricting the oil from completely filling gaps at the interfaces and creating metal-metal contact. At higher temperature, the oil thins and is able to flow between the pin and the piston. As a result, significantly less wear is observed at higher temperature. FIGURE 5 shows one side of the wear scar wore significantly less than the other side. This is most likely due to the location of the oil output. The lubricant film thickness was thicker on one side than the other, causing uneven wearing.


[2] “5052 Aluminum vs 356.0 Aluminum.” MakeItFrom.com, makeitfrom.com/compare/5052-O-Aluminum/A356.0-SG70B-A13560-Cast-Aluminum

The COF of linear reciprocating tribology tests can be split into a high and low pass. High pass refers to the sample moving in the forward, or positive, direction and low pass refers to the sample moving in the reverse, or negative, direction. The average COF for the RT oil was observed to be under 0.1 for both directions. The average COF between passes were 0.072 and 0.080. The average COF of the 90°C oil was found to be different between passes. Average COF values of 0.167 and 0.09 were observed. The difference in COF gives additional proof that the oil was only able to properly wet one side of the pin. High COF was obtained when a thick film was formed between the pin and the piston skirt due to hydrodynamic lubrication occurring. Lower COF is observed in the other direction when mixed lubrication is occurring. For more information on hydrodynamic lubrication and mixed lubrication, please visit our application note on Stribeck Curves.

Table 1: Results from lubricated wear test on pistons.

FIGURE 1: COF graphs for room temperature oil wear test A raw profile B high pass C low pass.

FIGURE 2: COF graphs for 90°C wear oil test A raw profile B high pass C low pass.

FIGURE 3: Optical image of wear scar from RT motor oil wear test.

FIGURE 4: Volume of a hole analysis of wear scar from RT motor oil wear test.

FIGURE 5: Profilometry scan of wear scar from RT motor oil wear test.

FIGURE 6: Optical image of wear scar from 90°C motor oil wear test

FIGURE 7: Volume of a hole analysis of wear scar from 90°C motor oil wear test.

FIGURE 8: Profilometry scan of wear scar from 90°C motor oil wear test.

CONCLUSION

Lubricated linear reciprocating wear testing was conducted on a piston to simulate events occurring in a
real-life operational engine. The piston skirt-lubricant-cylinder liner interfaces is crucial to the operations of an engine. The lubricant thickness at the interface is responsible for energy loss due to friction or wear between the piston skirt and cylinder liner. To optimize the engine, the film thickness must be as thin as possible without allowing the piston skirt and cylinder liner to touch. The challenge, however, is how changes in temperature, speed, and force will affect the P-L-C interfaces.

With its wide range of loading (up to 2000 N) and speed (up to 15000 rpm), the NANOVEA T2000 tribometer is able to simulate different conditions possible in an engine. Possible future studies on this topic include how the P-L-C interfaces will behave under different constant load, oscillated load, lubricant temperature, speed, and lubricant application method. These parameters can be easily adjusted with the NANOVEA T2000 tribometer to give a complete understanding on the mechanisms of the piston skirt-lubricant-cylinder liner interfaces.

NOW, LET'S TALK ABOUT YOUR APPLICATION