USA/GLOBAL: +1-949-461-9292
EUROPE: +39-011-3052-794
CONTACT US

Organic Surface Topography using Portable 3D Profilometer


ORGANIC SURFACE TOPOGRAPHY

USING PORTABLE 3D PROFILOMETER

Prepared by

CRAIG LEISING

INTRODUCTION

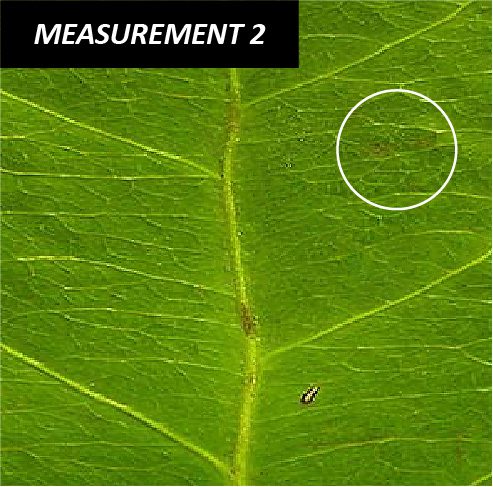
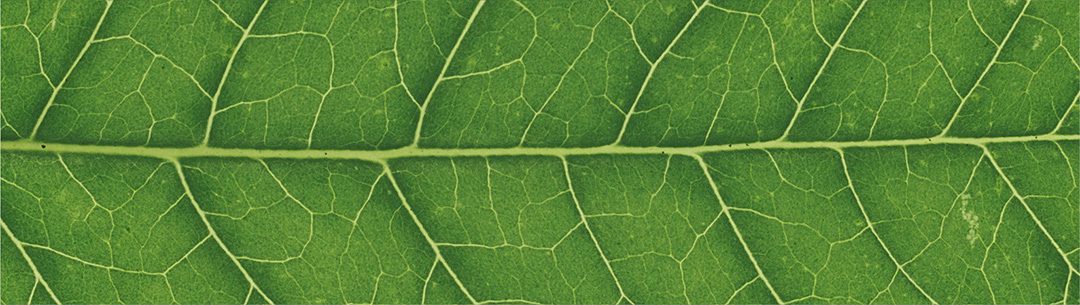
Nature has become a vital pool of inspiration for the development of improved surface structure. Understanding the surface structures found in nature has led to adhesion studies based on gecko’s feet, resistance studies based on a sea cucumbers textural change and repellency studies based from leaves, among many others. These surfaces have a number of potential applications from biomedical to clothing and automotive. For any of these surface breakthroughs to be successful, fabrication techniques must be developed so surface characteristics can be mimicked and reproduced. It is this process that will require identification and control.

IMPORTANCE OF PORTABLE 3D NON-CONTACT OPTICAL PROFILER FOR ORGANIC SURFACES

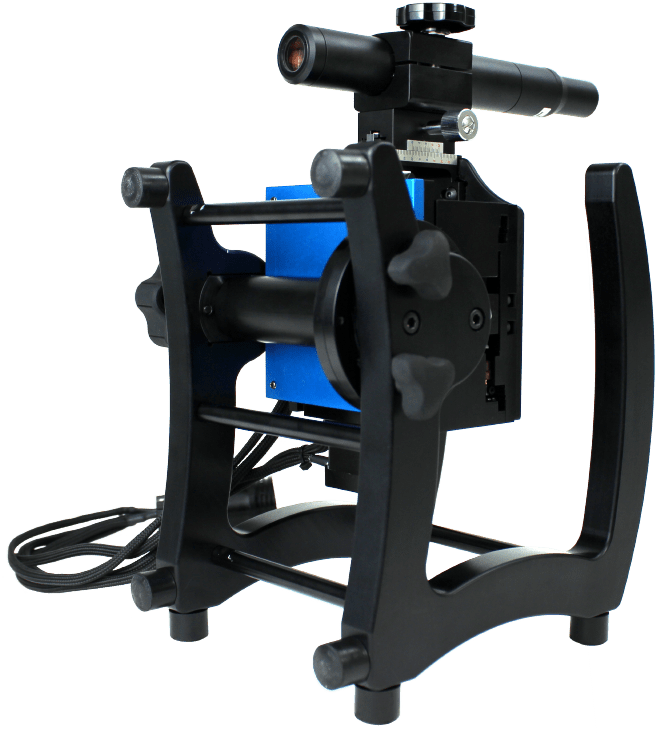
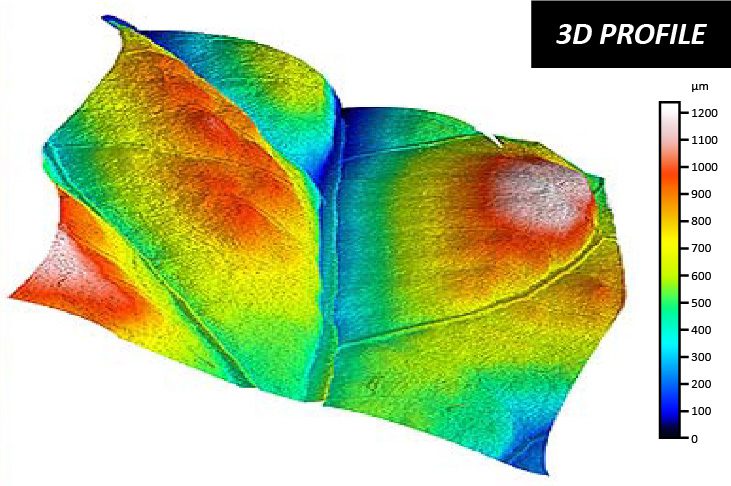
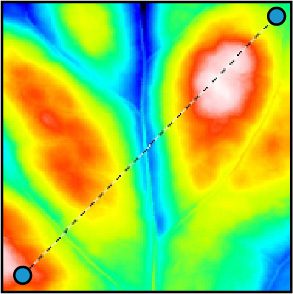
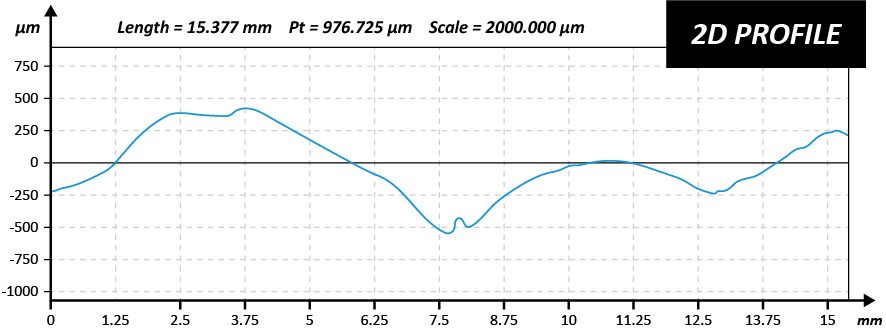
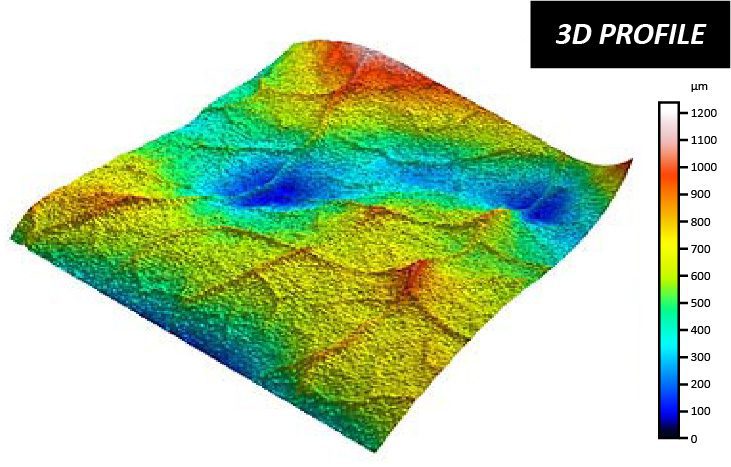
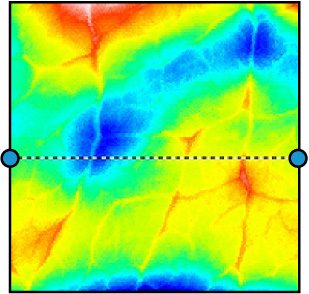
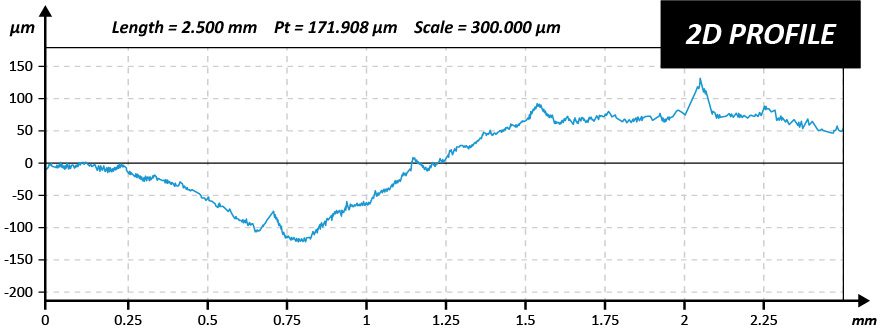
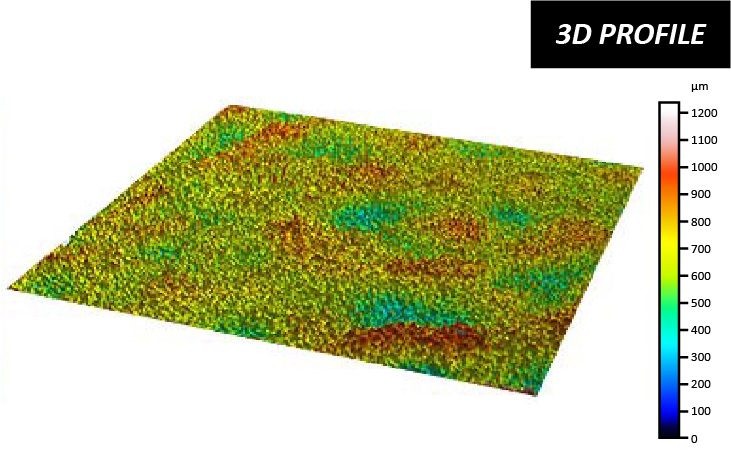
Utilizing Chromatic Light technology, the NANOVEA Jr25 Portable Optical Profiler has superior capability to measure nearly any material. That includes the unique and steep angles, reflective and absorbing surfaces found within natures broad range of surface characteristics. 3D non-contact measurements provide a full 3D image to give a more complete understanding of surface features. Without 3D capabilities, identification of nature’s surfaces would be solely relying on 2D information or microscope imaging, which does not provide sufficient information to properly mimic the surface studied. Understanding the full range of the surface characteristics including texture, form, dimension, among many others, will be critical to successful fabrication.

The ability to easily obtain lab-quality results in the field opens the door for new research opportunities.

MEASUREMENT OBJECTIVE

In this application, the NANOVEA Jr25 is used to measure the surface of a leaf. There is an endless list of surface parameters that can be automatically calculated after the 3D surface scan.

Here we will review the 3D surface and select
areas of interest to further analyze, including
quantifying and investigating the surface roughness, channels and topography

NANOVEA

JR25

TEST CONDITIONS

FURROW DEPTH

Mean density of furrows: 16.471 cm/cm2
Mean depth of furrows: 97.428 μm
Maximum depth: 359.769 μm

CONCLUSION

In this application, we have shown how the NANOVEA Jr25 portable 3D Non-Contact Optical Profiler can precisely characterize both the topography and the nanometer scale details of a leaf surface in the field. From these 3D surface measurements, areas of interest can quickly be identified and then analyzed with a list of endless studies (Dimension, Roughness Finish Texture, Shape Form Topography, Flatness Warpage Planarity, Volume Area, Step-Height and others). A 2D cross section can be easily chosen to analyze further details. With this information organic surfaces can be broadly investigated with a complete set of surface measurement resources. Special areas of interest could have been further analyzed with integrated AFM module on table top models.

NANOVEA also offers portable high-speed profilometers for field research and a wide range of lab-based systems, as well as provides laboratory services.

NOW, LET'S TALK ABOUT YOUR APPLICATION

Adhesion Properties of Gold Coating on Quartz Crystal Substrate


Adhesion Properties of Gold Coating

on Quartz Crystal Substrate

Prepared by

DUANJIE LI, PhD

INTRODUCTION

The Quartz Crystal Microbalance (QCM) is an extremely sensitive mass sensor capable of making precise measurements of small mass in the nanogram range. QCM measures the mass change on the surface through detecting variations in resonance frequency of the quartz crystal with two electrodes affixed to each side of the plate. The capacity of measuring extreme small weight makes it a key component in a variety of research and industrial instruments to detect and monitor the variation of mass, adsorption, density, and corrosion, etc.

IMPORTANCE OF SCRATCH TEST FOR QCM

As an extremely accurate device, the QCM measures the mass change down to 0.1 nanogram. Any mass loss or delamination of the electrodes on the quartz plate will be detected by the quartz crystal and cause significant measurement errors. As a result, the intrinsic quality of the electrode coating and the interfacial integrity of the coating/substrate system play an essential role in performing accurate and repeatable mass measurement. The Micro scratch test is a widely used comparative measurement to evaluate the relative cohesion or adhesion properties of coatings based on comparison of the critical loads at which failures appear. It is a superior tool for reliable quality control of QCMs.

MEASUREMENT OBJECTIVE

In this application, the NANOVEA Mechanical Tester, in Micro Scratch Mode, is used to evaluate the cohesive & adhesive strength of the gold coating on the quartz substrate of a QCM sample. We would like to showcase the capacity of the NANOVEA Mechanical Tester in performing micro scratch tests on a delicate sample with high precision and repeatability.

NANOVEA

PB1000

TEST CONDITIONS

The NANOVEA PB1000 Mechanical Tester was used to perform the micro scratch tests on a QCM sample using the test parameters summarized below. Three scratches were performed to ensure reproducibility of the results.

LOAD TYPE: Progressive

INITIAL LOAD

0.01 N

FINAL LOAD

30 N

ATMOSPHERE: Air 24°C

SLIDING SPEED

2 mm/min

SLIDING DISTANCE

2 mm

RESULTS & DISCUSSION

The full micro scratch track on the QCM sample is shown in FIGURE 1. The failure behaviors at different critical loads are displayed in FIGURE 2, where critical load, LC1 is defined as the load at which the first sign of adhesive failure occurs in the scratch track, LC2 is the load after which repetitive adhesive failures take place, and LC3 is the load at which the coating is completely removed from the substrate. It can be observed that little chipping takes place at LC1 of 11.15 N, the first sign of coating failure. 

As the normal load continues to increase during the micro scratch test, repetitive adhesive failures occur after LC2 of 16.29 N. When LC3 of 19.09 N is reached, the coating completely delaminates from the quartz substrate. Such critical loads can be used to quantitatively compare the cohesive and adhesive strength of the coating and select the best candidate for targeted applications.

FIGURE 1: Full micro scratch track on the QCM sample.

FIGURE 2: Micro scratch track at different critical loads.

FIGURE 3 plots the evolution of friction coefficient and depth that may provide more insight in the progression of coating failures during the micro scratch test.

FIGURE 3: Evolution of COF and Depth during the micro scratch test.

CONCLUSION

In this study, we showcased that the NANOVEA Mechanical Tester performs reliable and accurate micro scratch tests on a QCM sample. By applying linearly increased loads in a controlled and closely monitored fashion, the scratch measurement allows users to identify the critical load at which typical cohesive and adhesive coating failure occurs. It provides a superior tool to quantitatively evaluate and compare the intrinsic quality of the coating and the interfacial integrity of the coating/substrate system for QCM.

The Nano, Micro or Macro modules of the NANOVEA Mechanical Tester all include ISO and ASTM compliant indentation, scratch and wear tester modes, providing the widest and most user friendly range of testing available in a single system. NANOVEA‘s unmatched range is an ideal solution for determining the full range of mechanical properties of thin or thick, soft or hard coatings, films and substrates, including hardness, Young’s modulus, fracture toughness, adhesion, wear resistance and many others.

In addition, an optional 3D non-contact profiler and AFM module are available for high resolution 3D imaging of indentation, scratch and wear track in addition to other surface measurements, such as roughness and warpage.

NOW, LET'S TALK ABOUT YOUR APPLICATION