USA/GLOBAL: +1-949-461-9292
EUROPE: +39-011-3052-794
CONTACT US

Category: Linear Tribology


PTFE Coating Wear Test

PTFE COATING WEAR TEST

USING TRIBOMETER AND MECHANICAL TESTER

Prepared by

DUANJIE LI, PhD

INTRODUCTION

Polytetrafluoroethylene (PTFE), commonly known as Teflon, is a polymer with an exceptionally low coefficient of friction (COF) and excellent wear resistance, depending on the applied loads. PTFE exhibits superior chemical inertness, high melting point of 327°C (620°F), and maintains high strength, toughness, and self-lubrication at low temperatures. The exceptional wear resistance of  PTFE coatings makes them highly sought-after in a wide range of industrial applications, such as automotive, aerospace, medical, and, notably, cookware.

IMPORTANCE OF QUANTITATIVE EVALUATION OF PTFE COATINGS

The combination of a super low coefficient of friction (COF), excellent wear resistance, and exceptional chemical inert- ness at high temperatures makes PTFE an ideal choice for non-stick pan coatings. To further enhance its mechanical processes during R&D, as well as ensure optimal control over malfunction prevention and safety measures in the Quality Control process, it is crucial to have a reliable technique for quantity evaluating the tribomechanical processes of PTFE coatings. Precise control over surface friction, wear, and adhesion of the coatings is essential to ensure their intended performance.

MEASUREMENT OBJECTIVE

In this application, the wear process of a PTFE coating for a non-stick pan is simulated using NANOVEA Tribometer in linear reciprocating mode.

NANOVEA T50

Compact Free Weight Tribometer

In addition, the NANOVEA Mechanical Tester was used to perform a micro scratch adhesion test to determine the critical load of the PTFE coating adhesion failure.

NANOVEA PB1000

Large Platform Mechanical Tester

TEST PROCEDURE

WEAR TEST

LINEAR RECIPROCATING WEAR USING A TRIBOMETER

The tribological behavior of the PTFE coating sample, including the coefficient of friction (COF) and wear resistance, was evaluated using the NANOVEA Tribometer in linear reciprocating mode. A Stainless Steel 440 ball tip with a diameter of 3 mm (Grade 100) was used against the coating. The COF was continuously monitored during the PTFE coating wear test.


The wear rate, K, was calculated using the formula K=V/(F×s)=A/(F×n), where V represents the worn volume, F is the normal load, s is the sliding distance, A is the cross-sectional area of the wear track, and n is the number of strokes. The wear track profiles were evaluated using the NANOVEA Optical Profilometer, and the wear track morphology was examined using an optical microscope.

WEAR TEST PARAMETERS

LOAD 30 N
TEST DURATION 5 min
SLIDING RATE 80 rpm
AMPLITUDE OF TRACK 8 mm
REVOLUTIONS 300
BALL DIAMETER 3 mm
BALL MATERIAL Stainless Steel 440
LUBRICANT None
ATMOSPHERE Air
TEMPERATURE 230C (RT)
HUMIDITY 43%

TEST PROCEDURE

SCRATCH TEST

MICRO SCRATCH ADHESION TEST USING MECHANICAL TESTER

The PTFE scratch adhesion measurement was conducted using the NANOVEA Mechanical Tester with a 1200 Rockwell C diamond stylus (200 μm radius) in the Micro Scratch Tester Mode.


To ensure the reproducibility of the results, three tests were performed under identical testing conditions.

SCRATCH TEST PARAMETERS

LOAD TYPE Progressive
INITIAL LOAD 0.01 mN
FINAL LOAD 20 mN
LOADING RATE 40 mN/min
SCRATCH LENGTH 3 mm
SCRATCHING SPEED, dx/dt 6.0 mm/min
INDENTER GEOMETRY 120o Rockwell C
INDENTER MATERIAL (tip) Diamond
INDENTER TIP RADIUS 200 μm

RESULTS & DISCUSSION

LINEAR RECIPROCATING WEAR USING A TRIBOMETER

The COF recorded in situ is shown in FIGURE 1. The test sample exhibited a COF of ~0.18 during the first 130 revolutions, due to the low stickiness of PTFE. However, there was a sudden increase in COF to ~1 once the coating broke through, revealing the substrate underneath. Following the linear reciprocating tests, the wear track profile was measured using the NANOVEA Non-Contact Optical Profilometer, as shown in FIGURE 2. From the data obtained, the corresponding wear rate was calculated to be ~2.78 × 10⁻³ mm3/Nm, while the depth of the wear track was determined to be 44.94 µm.

PTFE coating wear test setup on the NANOVEA T50 Tribometer.

FIGURE 1: Evolution of COF during the PTFE coating wear test.

FIGURE 2: Profile extraction of wear track PTFE.

PTFE Before breakthrough

Max COF 0.217
Min COF 0.125
Average COF 0.177

PTFE After breakthrough

Max COF 0.217
Min COF 0.125
Average COF 0.177

TABLE 1: COF before and after breakthrough during the wear test.

RESULTS & DISCUSSION

MICRO SCRATCH ADHESION TEST USING MECHANICAL TESTER

The adhesion of the PTFE coating to the substrate is measured using scratch tests with a 200 µm diamond stylus. The micrograph is shown in FIGURE 3 and FIGURE 4, Evolution of COF, and penetration depth in FIGURE 5. The PTFE coating scratch test results are summarized in TABLE 4. As the load on the diamond stylus increased, it progressively penetrated into the coating, resulting in an increase in the COF. When a load of ~8.5 N was reached, the breakthrough of the coating and exposure of the substrate occurred under high pressure, leading to a high COF of ~0.3. The low St Dev shown in TABLE 2 demonstrates the repeatability of the PTFE coating scratch test conducted using the NANOVEA Mechanical Tester.

FIGURE 3: Micrograph of the full scratch on PTFE (10X).

FIGURE 4: Micrograph of the full scratch on PTFE (10X).

FIGURE 5: Friction graph showing the line of the critical point of failure for PTFE.

Scratch Point of Failure [N] Frictional Force [N] COF
1 0.335 0.124 0.285
2 0.337 0.207 0.310
3 0.380 0.229 0.295
Average 8.52 2.47 0.297
St dev 0.17 0.16 0.012

TABLE 2: Summary of Critical Load, Frictional Force, and COF during the scratch test.

CONCLUSION

In this study, we conducted a simulation of the wear process of a PTFE coating for non-stick pans using the NANOVEA T50 Tribometer in linear reciprocating mode. The PTFE coating exhibited a low COF of ~0.18 the coating experienced a breakthrough at around 130 revolutions. The quantitative evaluation of the PTFE coating adhesion to the metal substrate was performed using the NANOVEA Mechanical Tester which determined the critical load of the coating adhesion failure to be ~8.5 N in this test.


The NANOVEA Tribometers offer precise and repeatable wear and friction testing capabilities using ISO and ASTM-compliant rotary and linear modes. They provide optional modules for high-temperature wear, lubrication, and tribocorrosion, all integrated into a single system. This versatility allows users to simulate real-world application environments more accurately and gain a beer understanding of the wear mechanisms and tribological properties of different materials.


The NANOVEA Mechanical Testers offer Nano, Micro, and Macro modules, each of which includes ISO and ASTM compliant indentation, scratch, and wear testing modes, providing the widest and most user-friendly range of testing capabilities available in a single system.

NOW, LET'S TALK ABOUT YOUR APPLICATION

Polymer Belt Wear and Friction using a Tribometer
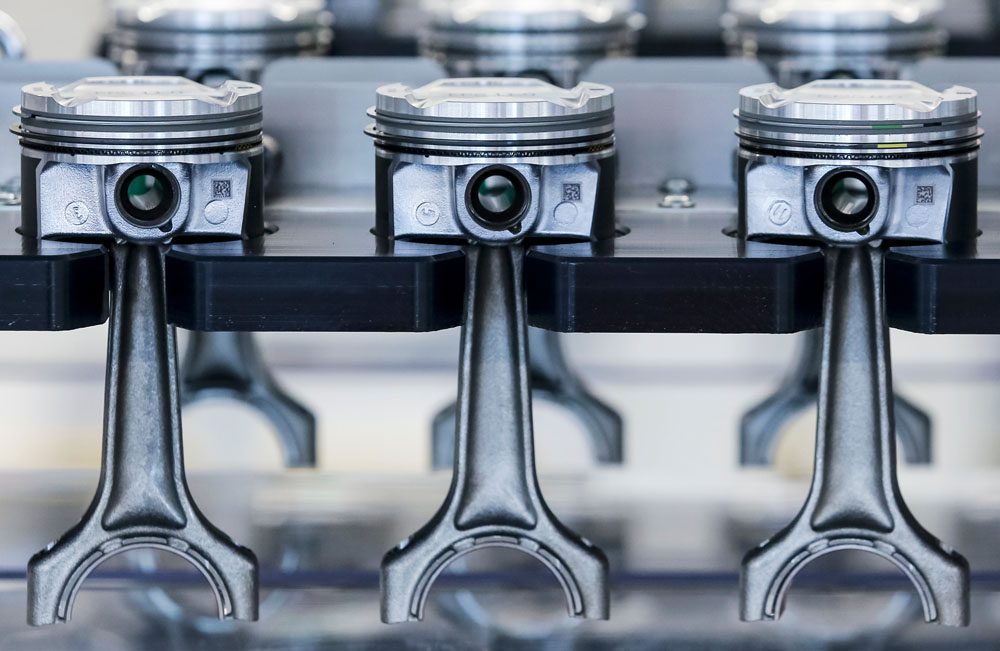
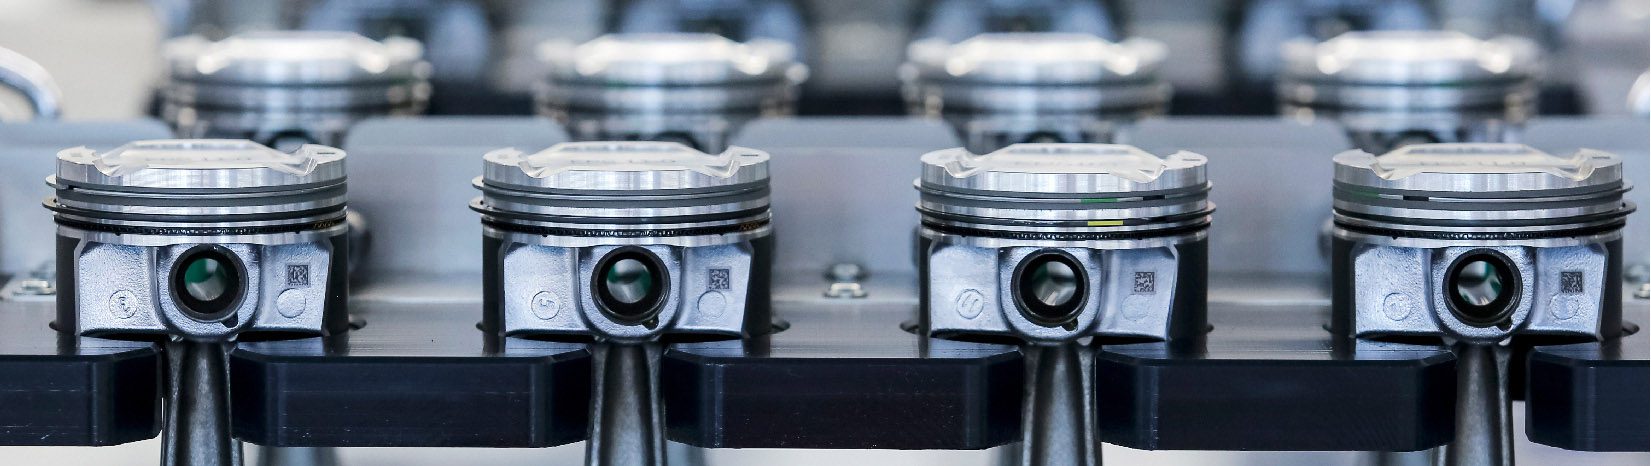
POLYMER BELTS

WEAR AND FRICTION USING a TRIBOMETER

Prepared by

DUANJIE LI, PhD

INTRODUCTION

Belt drive transmits power and tracks relative movement between two or more rotating shafts. As a simple and inexpensive solution with minimal maintenance, belt drives are widely used in a variety of applications, such as bucksaws, sawmills, threshers, silo blowers and conveyors. Belt drives can protect the machinery from overload as well as damp and isolate vibration.

IMPORTANCE OF WEAR EVALUATION FOR BELT DRIVES

Friction and wear are inevitable for the belts in a belt-driven machine. Sufficient friction ensures effective power transmission without slipping, but excessive friction may rapidly wear the belt. Different types of wear such as fatigue, abrasion and friction take place during the belt drive operation. In order to extend the lifetime of the belt and to cut the cost and time on belt repairing and replacement, reliable evaluation of the wear performance of the belts is desirable in improving belt lifespan, production efficiency and application performance. Accurate measurement of the coefficient of friction and wear rate of the belt facilitates R&D and quality control of belt production.

MEASUREMENT OBJECTIVE

In this study, we simulated and compared the wear behaviors of belts with different surface textures to showcase the capacity of the NANOVEA T2000 Tribometer in simulating the wear process of the belt in a controlled and monitored manner.

NANOVEA

T2000

TEST PROCEDURES

The coefficient of friction, COF, and the wear resistance of two belts with different surface roughness and texture were evaluated by the NANOVEA High-Load Tribometer using Linear Reciprocating Wear Module. A Steel 440 ball (10 mm diameter) was used as the counter material. The surface roughness and wear track were examined using an integrated 3D Non-Contact profilometer. The wear rate, K, was evaluated using the formula K=Vl(Fxs), where V is the worn volume, F is the normal load and s is the sliding distance.


Please note that a smooth Steel 440 ball counterpart was used as an example in this study, any solid material with different shapes and surface finish can be applied using custom fixtures to simulate the actual application situation.

RESULTS & DISCUSSION

The Textured Belt and Smooth Belt have a surface roughness Ra of 33.5 and 8.7 um, respectively, according to the analyzed surface profiles taken with a NANOVEA 3D Non-Contact Optical profiler. The COF and wear rate of the two tested belts were measured at 10 N and 100 N, respectively, to compare the wear behavior of the belts at different loads.

FIGURE 1 shows the evolution of COF of the belts during the wear tests. The belts with different textures exhibit substantially different wear behaviors. It is interesting that after the run-in period during which the COF progressively increases, the Textured Belt reaches a lower COF of ~0.5 in both the tests conducted using loads of 10 N and 100 N. In comparison, the Smooth Belt tested under the load of 10 N exhibits a significantly higher COF of~ 1.4 when the COF gets stable and maintains above this value for the rest of the test. The Smooth Belt tested under the load of 100 N rapidly was worn out by the steel 440 ball and formed a large wear track. The test was therefore stopped at 220 revolutions.

FIGURE 1: Evolution of COF of the belts at different loads.

FIGURE 2 compares the 3D wear track images after the tests at 100 N. The NANOVEA 3D non-contact profilometer offers a tool to analyze the detailed morphology of the wear tracks, providing more insight in fundamental understanding of wear mechanism.

TABLE 1: Result of wear track analysis.

FIGURE 2:  3D view of the two belts
after the tests at 100 N.

The 3D wear track profile allows direct and accurate determination of the wear track volume calculated by the advanced analysis software as shown in TABLE 1. In a wear test for 220 revolutions, the Smooth Belt has a much larger and deeper wear track with a volume of 75.7 mm3, compared to a wear volume of 14.0 mm3 for the Textured Belt after a 600-revolution wear test. The significantly higher friction of the Smooth Belt against the steel ball leads to a 15 fold higher wear rate compared to the Textured Belt.


Such a drastic difference of COF between the Textured Belt and Smooth Belt is possibly related to the size of the contact area between the belt and the steel ball, which also leads to their different wear performance. FIGURE 3 shows the wear tracks of the two belts under the optical microscope. The wear track examination is in agreement with the observation on COF evolution: The Textured Belt, which maintains a low COF of ~0.5, exhibits no sign of wear after the wear test under a load of 10 N. The Smooth Belt shows a small wear track at 10 N. The wear tests carried out at 100 N create substantially larger wear tracks on both the Textured and Smooth Belts, and the wear rate will be calculated using 3D profiles as will be discussed in the following paragraph.

FIGURE 3:  Wear tracks under optical microscope.

CONCLUSION

In this study, we showcased the capacity of the NANOVEA T2000 Tribometer in evaluating the coefficient of friction and wear rate of belts in a well-controlled and quantitative manner. The surface texture plays a critical role in the friction and wear resistance of the belts during their service performance. The textured belt exhibits a stable coefficient of friction of ~0.5 and possesses a long lifetime, which results in reduced time and cost on tool repairing or replacement. In comparison, the excessive friction of the smooth belt against the steel ball rapidly wears the belt. Further, the loading on the belt is a vital factor of its service lifetime. Overload creates very high friction, leading to accelerated wear to the belt.

The NANOVEA T2000 Tribometer offers precise and repeatable wear and friction testing using ISO and ASTM compliant rotative and linear modes, with optional high temperature wear, lubrication and tribocorrosion modules available in one pre-integrated system. NANOVEA’s unmatched range is an ideal solution for determining the full range of tribological properties of thin or thick, soft or hard coatings, films and substrates.

NOW, LET'S TALK ABOUT YOUR APPLICATION

Piston Wear Testing

Piston Wear Testing

Using a Tribometer

Prepared by

FRANK LIU

INTRODUCTION

Friction loss accounts for approximately 10% of total energy in fuel for a diesel engine[1]. 40-55% of the friction loss comes from the power cylinder system. The loss of energy from friction can be diminished with better understanding of the tribological interactions occurring in the power cylinder system.

A significant portion of the friction loss in the power cylinder system stems from the contact between the piston skirt and the cylinder liner. The interaction between the piston skirt, lubricant, and cylinder interfaces is quite complex due to the constant changes in force, temperature, and speed in a real life engine. Optimizing each factor is key to obtaining optimal engine performance. This study will focus on replicating the mechanisms causing friction forces and wear at the piston skirt-lubricant-cylinder liner (P-L-C) interfaces.

 Schematic of power cylinders system and piston skirt-lubricant-cylinder liner interfaces.

[1] Bai, Dongfang. Modeling piston skirt lubrication in internal combustion engines. Diss. MIT, 2012

IMPORTANCE OF TESTING PISTONS WITH TRIBOMETERS

Motor oil is a lubricant that is well-designed for its application. In addition to the base oil, additives such as detergents, dispersants, viscosity improver (VI), anti-wear/anti-friction agents, and corrosion inhibitors are added to improve its performance. These additives affect how the oil behaves under different operating conditions. The behavior of oil affects the P-L-C interfaces and determines if significant wear from metal-metal contact or if hydrodynamic lubrication (very little wear) is occurring.

It is difficult to understand the P-L-C interfaces without isolating the area from external variables. It is more practical to simulate the event with conditions that are representative of its real-life application. The NANOVEA Tribometer is ideal for this. Equipped with multiple force sensors, depth sensor, a drop-by-drop lubricant module, and linear reciprocating stage, the NANOVEA T2000 is able to closely mimic events occurring within an engine block and obtain valuable data to better understand the P-L-C interfaces.

Liquid Module on the NANOVEA T2000 Tribometer

The drop-by-drop module is crucial for this study. Since pistons can move at a very fast rate (above 3000 rpm), it is difficult to create a thin film of lubricant by submerging the sample. To remedy this issue, the drop-by-drop module is able to consistently apply a constant amount of lubricant onto the piston skirt surface.

Application of fresh lubricant also removes concern of dislodged wear contaminants influencing the lubricant’s properties.

NANOVEA T2000

High Load Tribometer

MEASUREMENT OBJECTIVE

The piston skirt-lubricant-cylinder liner interfaces will be studied in this report. The interfaces will be replicated by conducting a linear reciprocating wear test with drop-by-drop lubricant module.

The lubricant will be applied at room temperature and heated conditions to compare cold start and optimal operation conditions. The COF and wear rate will be observed to better understand how the interfaces behaves in real-life applications.

TEST PARAMETERS

for tribology testing on pistons

LOAD ………………………. 100 N

TEST DURATION ………………………. 30 min

SPEED ………………………. 2000 rpm

AMPLITUDE ………………………. 10 mm

TOTAL DISTANCE ………………………. 1200 m

SKIRT COATING ………………………. Moly-graphite

PIN MATERIAL ………………………. Aluminum Alloy 5052

PIN DIAMETER ………………………. 10 mm

LUBRICANT ………………………. Motor Oil (10W-30)

APPROX. FLOW RATE ………………………. 60 mL/min

TEMPERATURE ………………………. Room temp & 90°C

LINEAR RECIPROCATING TEST RESULTS

In this experiment, A5052 was used as the counter material. While engine blocks are usually made of cast aluminum such as A356, A5052 have mechanical properties similar to A356 for this simulative testing [2].

Under the testing conditions, significant wear was
observed on the piston skirt at room temperature
compared to at 90°C. The deep scratches seen on the samples suggest that contact between the static material and the piston skirt occurs frequently throughout the test. The high viscosity at room temperature may be restricting the oil from completely filling gaps at the interfaces and creating metal-metal contact. At higher temperature, the oil thins and is able to flow between the pin and the piston. As a result, significantly less wear is observed at higher temperature. FIGURE 5 shows one side of the wear scar wore significantly less than the other side. This is most likely due to the location of the oil output. The lubricant film thickness was thicker on one side than the other, causing uneven wearing.


[2] “5052 Aluminum vs 356.0 Aluminum.” MakeItFrom.com, makeitfrom.com/compare/5052-O-Aluminum/A356.0-SG70B-A13560-Cast-Aluminum

The COF of linear reciprocating tribology tests can be split into a high and low pass. High pass refers to the sample moving in the forward, or positive, direction and low pass refers to the sample moving in the reverse, or negative, direction. The average COF for the RT oil was observed to be under 0.1 for both directions. The average COF between passes were 0.072 and 0.080. The average COF of the 90°C oil was found to be different between passes. Average COF values of 0.167 and 0.09 were observed. The difference in COF gives additional proof that the oil was only able to properly wet one side of the pin. High COF was obtained when a thick film was formed between the pin and the piston skirt due to hydrodynamic lubrication occurring. Lower COF is observed in the other direction when mixed lubrication is occurring. For more information on hydrodynamic lubrication and mixed lubrication, please visit our application note on Stribeck Curves.

Table 1: Results from lubricated wear test on pistons.

FIGURE 1: COF graphs for room temperature oil wear test A raw profile B high pass C low pass.

FIGURE 2: COF graphs for 90°C wear oil test A raw profile B high pass C low pass.

FIGURE 3: Optical image of wear scar from RT motor oil wear test.

FIGURE 4: Volume of a hole analysis of wear scar from RT motor oil wear test.

FIGURE 5: Profilometry scan of wear scar from RT motor oil wear test.

FIGURE 6: Optical image of wear scar from 90°C motor oil wear test

FIGURE 7: Volume of a hole analysis of wear scar from 90°C motor oil wear test.

FIGURE 8: Profilometry scan of wear scar from 90°C motor oil wear test.

CONCLUSION

Lubricated linear reciprocating wear testing was conducted on a piston to simulate events occurring in a
real-life operational engine. The piston skirt-lubricant-cylinder liner interfaces is crucial to the operations of an engine. The lubricant thickness at the interface is responsible for energy loss due to friction or wear between the piston skirt and cylinder liner. To optimize the engine, the film thickness must be as thin as possible without allowing the piston skirt and cylinder liner to touch. The challenge, however, is how changes in temperature, speed, and force will affect the P-L-C interfaces.

With its wide range of loading (up to 2000 N) and speed (up to 15000 rpm), the NANOVEA T2000 tribometer is able to simulate different conditions possible in an engine. Possible future studies on this topic include how the P-L-C interfaces will behave under different constant load, oscillated load, lubricant temperature, speed, and lubricant application method. These parameters can be easily adjusted with the NANOVEA T2000 tribometer to give a complete understanding on the mechanisms of the piston skirt-lubricant-cylinder liner interfaces.

NOW, LET'S TALK ABOUT YOUR APPLICATION

Fretting Wear Testing Tribology

Fretting Wear Evaluation


FRETTING WEAR EVALUATION

Fretting Wear Evaluation in Aviation

Author:

Duanjie Li, PhD

Revised by

Jocelyn Esparza

Fretting Wear Evaluation in Mining and Metallurgy

INTRODUCTION

Fretting is “a special wear process that occurs at the contact area between two materials under load and subject to minute relative motion by vibration or some other force.” When machines are in operation, vibrations inevitably occur in joints that are bolted or pinned, between components that are not intended to move, and in oscillating couplings and bearings. The amplitude of such relative sliding motion is often in the order of micrometers to millimeters. Such repetitive low-amplitude motion causes serious localized mechanical wear and material transfer at the surface, which may lead to reduced production efficiency, machine performance or even damage to the machine.

Importance of Quantitative
Fretting Wear Evaluation

Fretting wear often involves several complex wear mechanisms taking place at the contact surface, including two-body abrasion, adhesion and/or fretting fatigue wear. In order to understand the fretting wear mechanism and select the best material for fretting wear protection, reliable and quantitative fretting wear evaluation is needed. The fretting wear behavior is significantly influenced by the work environment, such as displacement amplitude, normal loading, corrosion, temperature, humidity and lubrication. A versatile tribometer that can simulate the different realistic work conditions will be ideal for fretting wear evaluation.

Steven R. Lampman, ASM Handbook: Volume 19: Fatigue and Fracture
http://www.machinerylubrication.com/Read/693/fretting-wear

MEASUREMENT OBJECTIVE

In this study, we evaluated the fretting wear behaviors of a stainless steel SS304 sample at different oscillation speeds and temperatures to showcase the capacity of NANOVEA T50 Tribometer in simulating the fretting wear process of metal in a well-controlled and monitored manner.

NANOVEA

T50

TEST CONDITIONS

The fretting wear resistance of a stainless steel SS304 sample was evaluated by NANOVEA Tribometer using Linear Reciprocating Wear Module. A WC (6 mm diameter) ball was used as the counter material. The wear track was examined using a NANOVEA 3D non-contact profiler. 

The fretting test was performed at room temperature (RT) and 200 °C to study the effect of high temperature on the fretting wear resistance of the SS304 sample. A heating plate on the sample stage heated up the sample during the fretting test at 200 °C. The wear rate, K, was evaluated using the formula K=V/(F×s), where V is the worn volume, F is the normal load, and s is the sliding distance.

Please note that a WC ball as a counter material was used as an example in this study. Any solid material with different shapes and surface finish can be applied using a custom fixture to simulate the actual application situation.

TEST PARAMETERS

of the wear measurements

RESULTS & DISCUSSION

The 3D wear track profile allows direct and accurate determination of the wear track volume loss calculated by the NANOVEA Mountains analysis software. 

The reciprocating wear test at a low speed of 100 rpm and room temperature exhibits a small wear track of 0.014 mm³. In comparison, the fretting wear test carried out at a high speed of 1000 rpm creates a substantially larger wear track with a volume of 0.12 mm³. Such an accelerated wear process may be attributed to the high heat and intense vibration generated during the fretting wear test, which promotes oxidation of the metallic debris and results in severe three-body abrasion. The fretting wear test at an elevated temperature of 200 °C forms a larger wear track of 0.27 mm³.

The fretting wear test at 1000 rpm has a wear rate of 1.5×10⁻⁴ mm³/Nm, which is nearly nine times compared to that in a reciprocating wear test at 100 rpm. The fretting wear test at an elevated temperature further accelerates the wear rate to 3.4×10⁻⁴ mm³/Nm. Such a significant difference in wear resistance measured at different speeds and temperatures shows the importance of proper simulations of fretting wear for realistic applications.

Wear behavior can change drastically when small changes in testing conditions are introduced into the tribosystem. The versatility of the NANOVEA Tribometer allows measuring wear under various conditions, including high temperature, lubrication, corrosion and others. The accurate speed and position control by the advanced motor enables users to perform the wear test at speeds ranging from 0.001 to 5000 rpm, making it an ideal tool for research/testing labs to investigate the fretting wear in different tribological conditions.

Fretting wear tracks at various conditions

under the optical microscope

Fretting wear tracks at various conditions under the optical microscope

3D WEAR TRACKs PROFILES

provide more insight in fundamental understanding
of the fretting wear mechanism

3d wear track profiles - fretting

RESULT SUMMARY OF WEAR TRACKS

measured using different test parameters

CONCLUSION

In this study, we showcased the capacity of the NANOVEA Tribometer in evaluating the fretting wear behavior of a stainless steel SS304 sample in a well-controlled and quantitative manner. 

The test speed and temperature play critical roles in the fretting wear resistance of the materials. The high heat and intense vibration during the fretting resulted in substantially accelerated wear of the SS304 sample by close to nine times. The elevated temperature of 200 °C further increased the wear rate to 3.4×10⁻⁴ mm3/Nm. 

The versatility of the NANOVEA Tribometer makes it an ideal tool for measuring fretting wear under various conditions, including high temperature, lubrication, corrosion and others.

NANOVEA Tribometers offer precise and repeatable wear and friction testing using ISO and ASTM compliant rotative and linear modes, with optional high temperature wear, lubrication and tribo-corrosion modules available in one pre-integrated system. Our unmatched range is an ideal solution for determining the full scope of tribological properties of thin or thick, soft or hard coatings, films and substrates.

NOW, LET'S TALK ABOUT YOUR APPLICATION

Ball Bearings: High Force Wear Resistance Study


INTRODUCTION

A ball bearing uses balls to reduce rotational friction and support radial and axial loads. The rolling balls between the bearing races produce much lower coefficient of friction (COF) compared to two flat surfaces sliding against each other. Ball bearings are often exposed to high contact stress levels, wear and extreme environmental conditions such as high temperatures. Therefore, wear resistance of the balls under high loads and extreme environmental conditions is critical for extending the lifetime of the ball bearing to cut down cost and time on repairs and replacements.
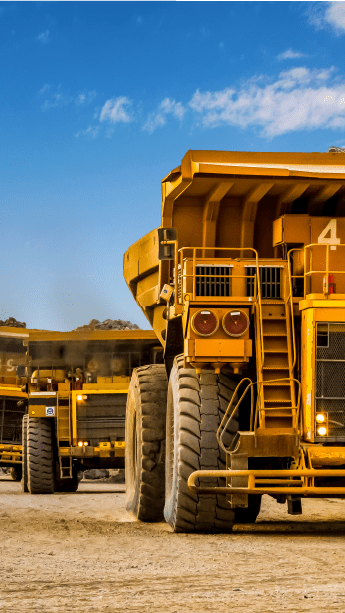
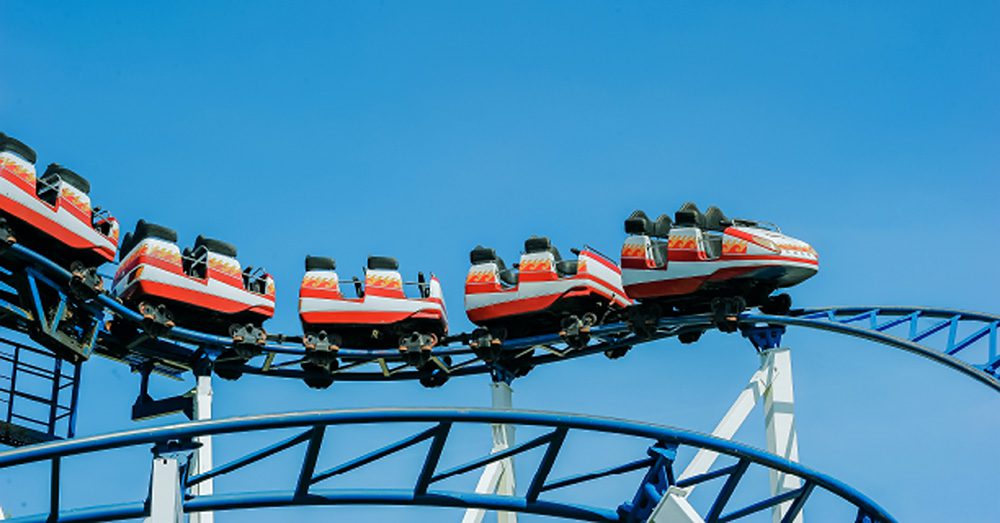
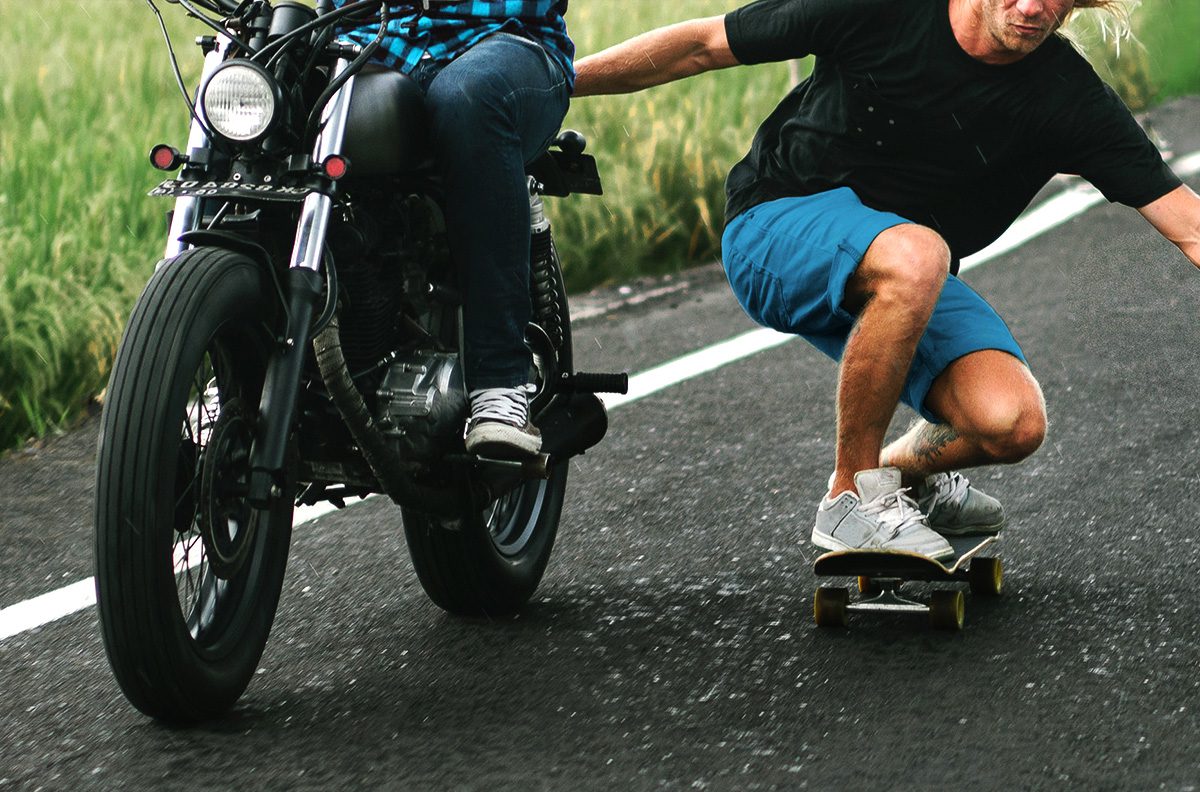
Ball bearings can be found in nearly all applications that involve moving parts. They are commonly used in transportation industries such as aerospace and automobile as well as the toy industry that manufactures items such as fidget spinner and skateboards.

BALL BEARING WEAR EVALUATION AT HIGH LOADS

Ball bearings can be made from an extensive list of materials. Commonly used materials range between metals like stainless steel and chrome steel or ceramics such as tungsten carbide (WC) and silicon nitride (Si3n4). To ensure that the manufactured ball bearings possess the required wear resistance ideal for the given application’s conditions, reliable tribological evaluations under high loads are necessary. Tribological testing aids in quantifying and contrasting the wear behaviors of diff­erent ball bearings in a controlled and monitored manner to select the best candidate for the targeted application.

MEASUREMENT OBJECTIVE

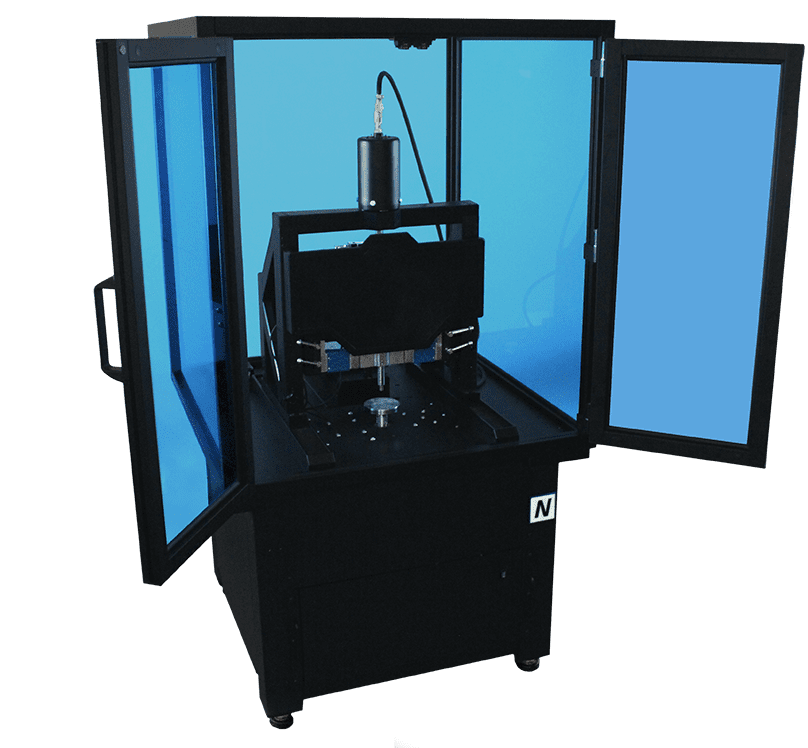
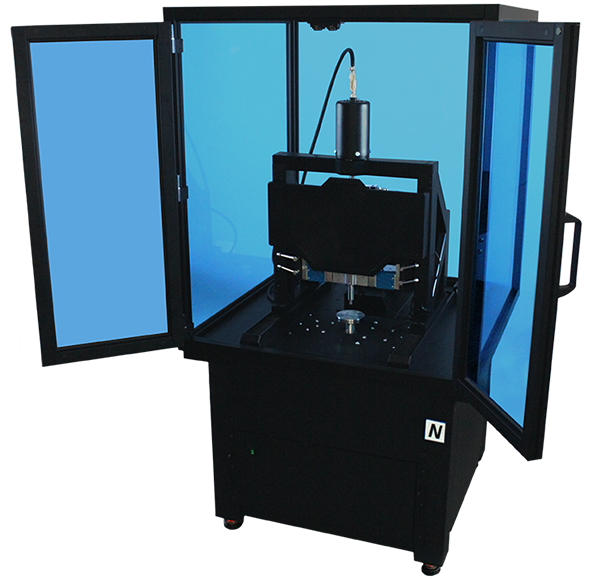
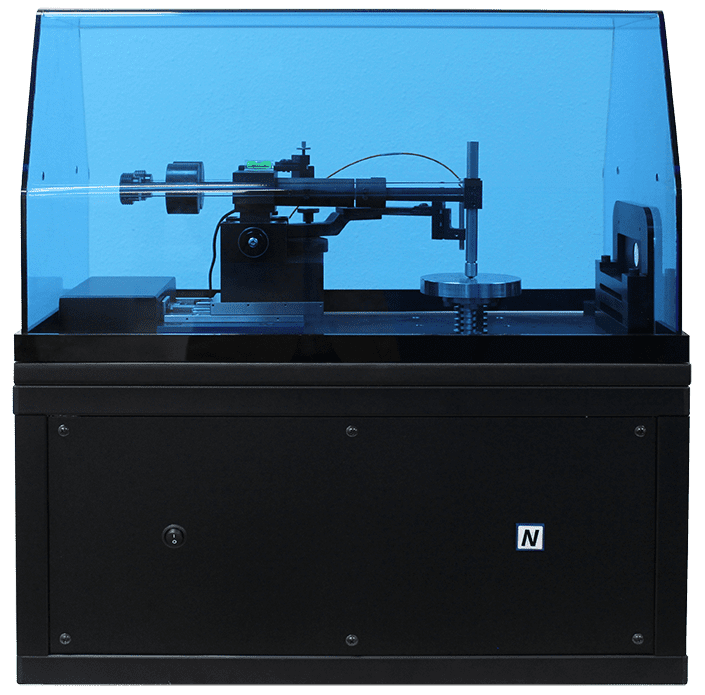
In this study, we showcase a Nanovea Tribometer as the ideal tool for comparing the wear resistance of different ball bearings under high loads.

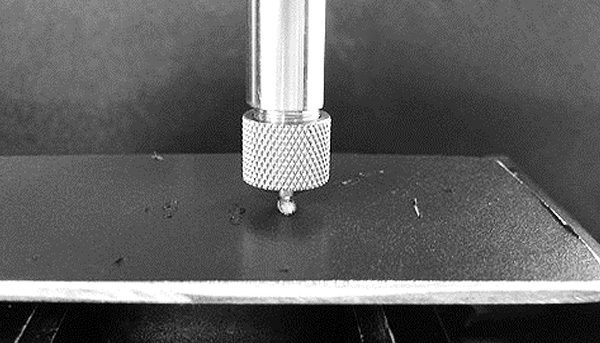
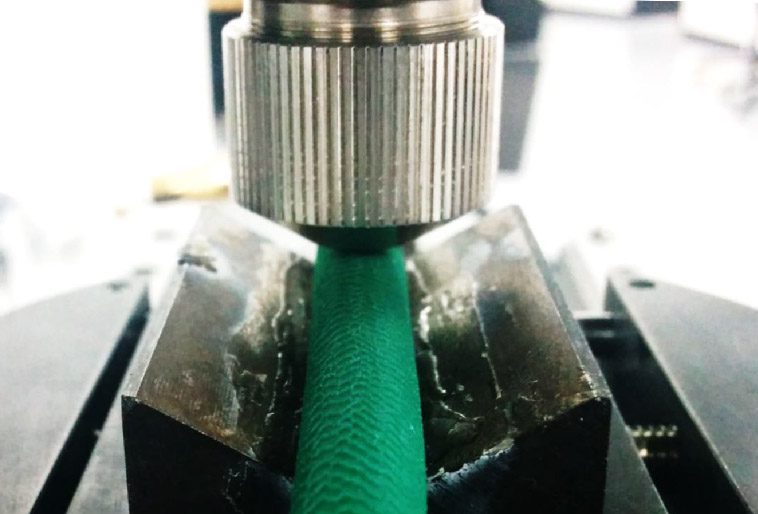
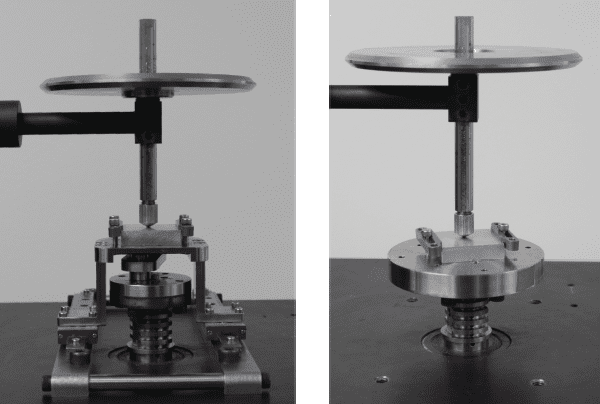
Figure 1:  Setup of the bearing test.

TESTING PROCEDURE

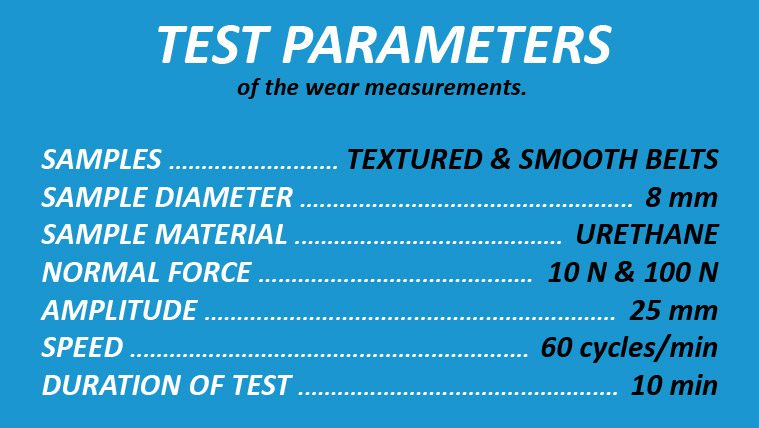
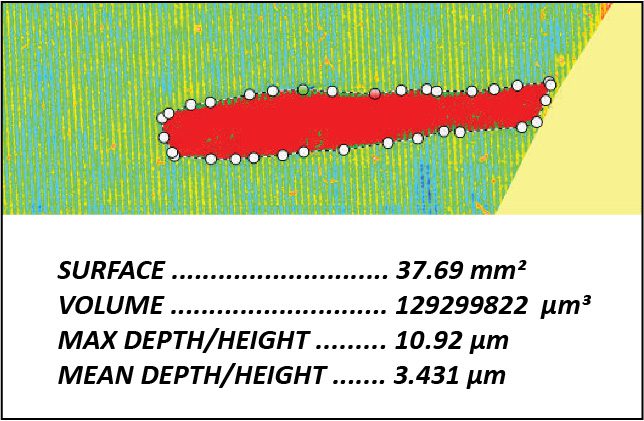
The coefficient of friction, COF, and the wear resistance of the ball bearings made of different materials were evaluated by a Nanovea Tribometer. P100 grit sandpaper was used as the counter material. The wear scars of the ball bearings were examined using a Nanovea 3D Non-Contact Profiler after the wear tests concluded. The test parameters are summarized in Table 1. The wear rate, K, was evaluated using the formula K=V/(F×s), where V is the worn volume, F is the normal load and s is the sliding distance. Ball wear scars were evaluated by a Nanovea 3D Non-Contact Profiler to ensure precise wear volume measurement.
The automated motorized radial positioning feature allows the tribometer to decrease the radius of the wear track for the duration of a test. This test mode is called a spiral test and it ensures that the ball bearing always slides on a new surface of the sandpaper (Figure 2). It significantly improves the repeatability of the wear resistance test on the ball. The advanced 20bit encoder for internal speed control and 16bit encoder for external position control provide precise real-time speed and position information, allowing for a continuous adjustment of rotational speed to achieve constant linear sliding speed at the contact.
Please note that P100 Grit sandpaper was used to simplify the wear behavior between various ball materials in this study and can be substituted with any other material surface. Any solid material can be substituted to simulate the performance of a wide range of material couplings under actual application conditions, such as in liquid or lubricant.

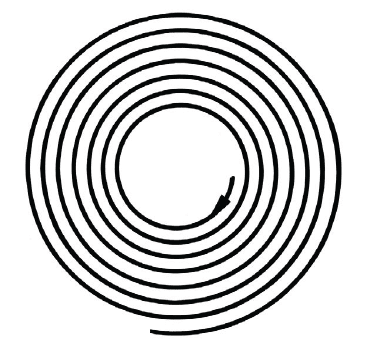
Figure 2:  Illustration of the spiral passes for the ball bearing on the sandpaper.
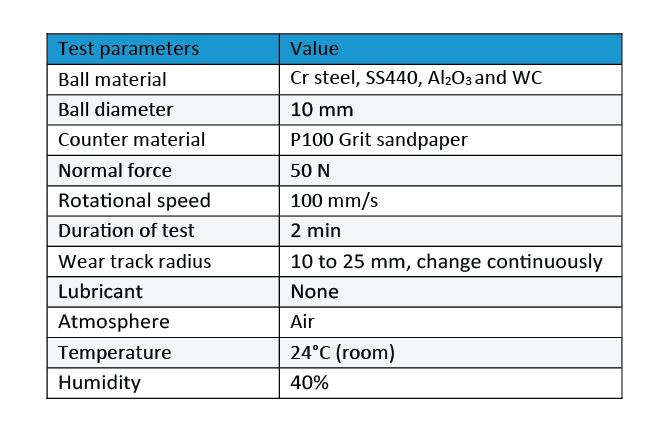
Table 1:  Test parameters of the wear measurements.


RESULTS & DISCUSSION

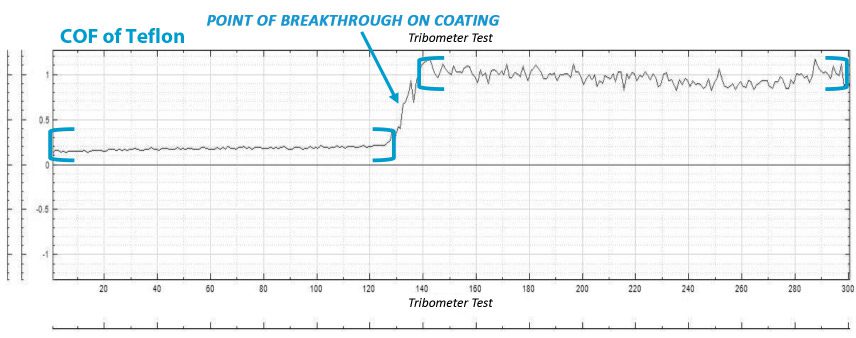
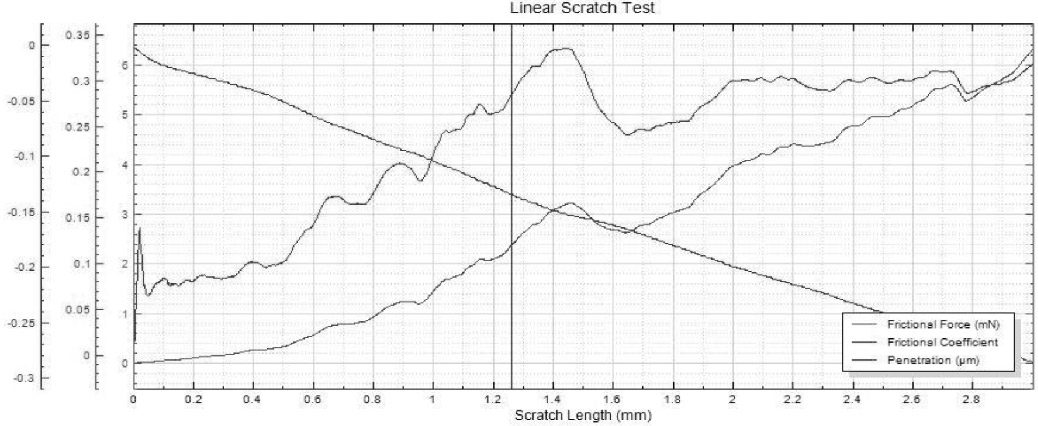
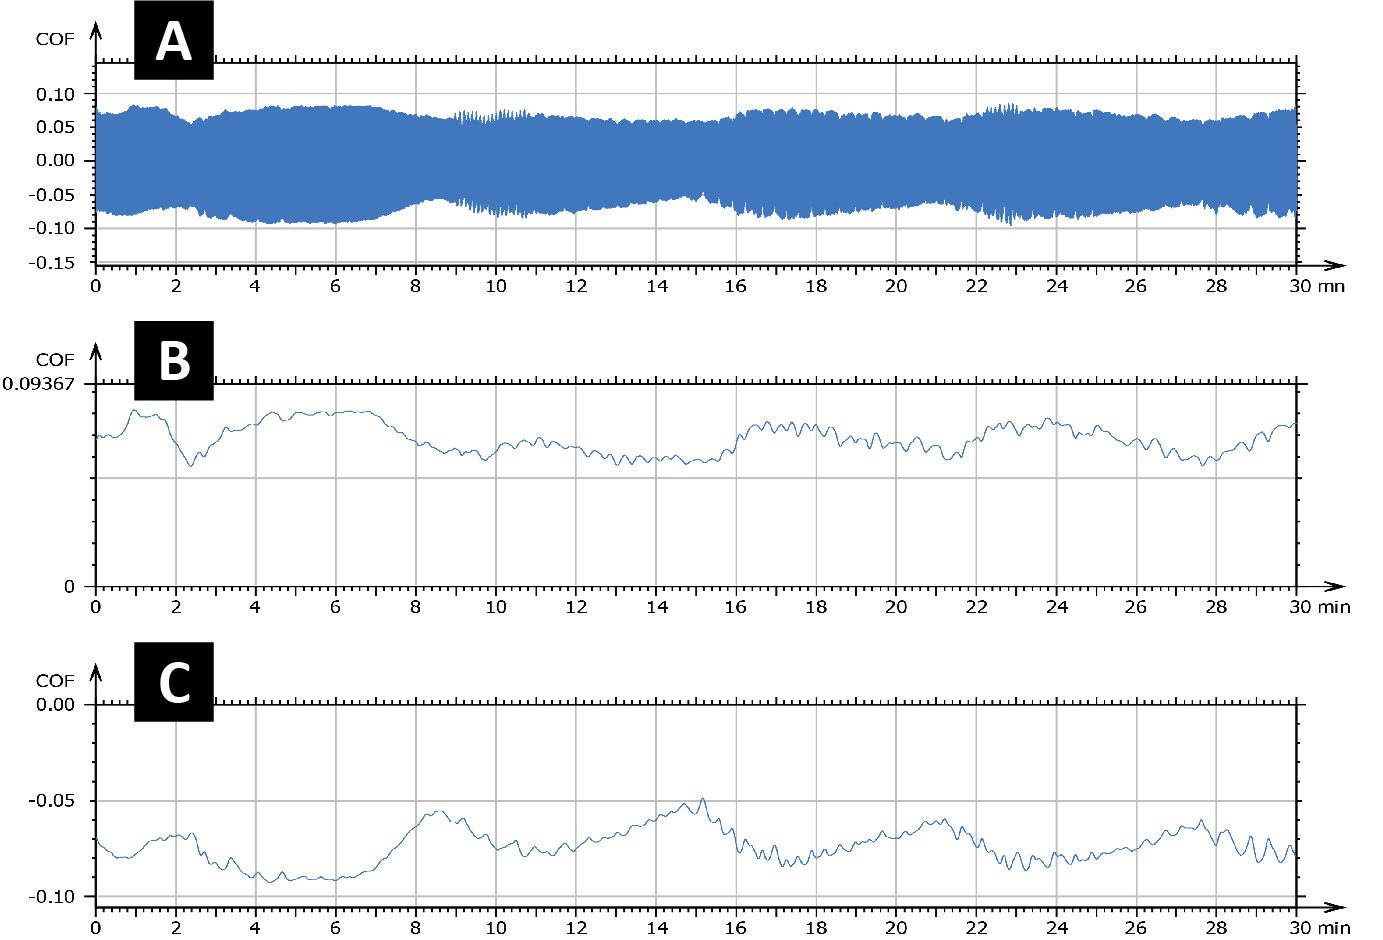
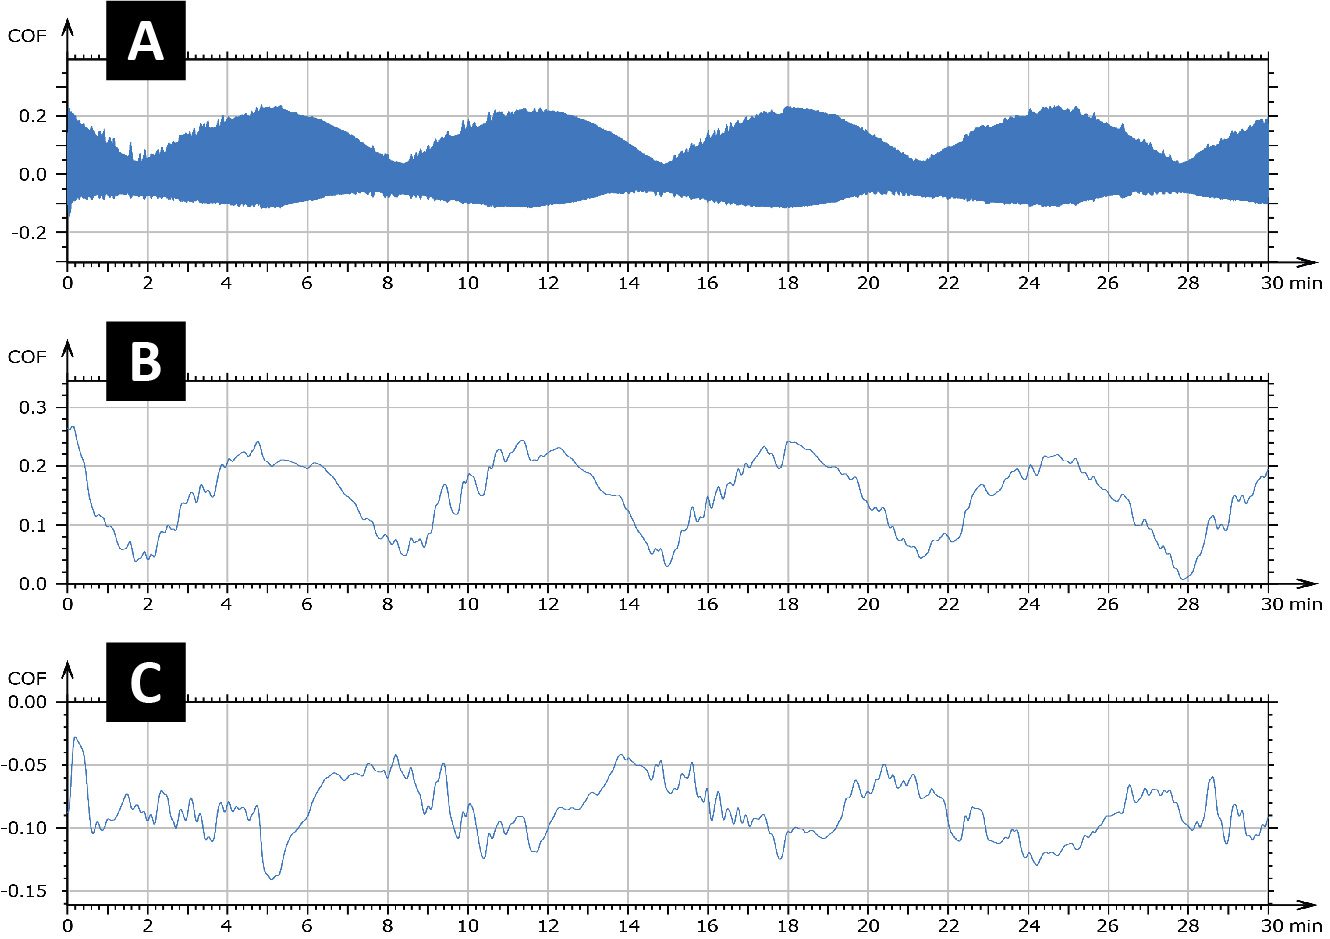
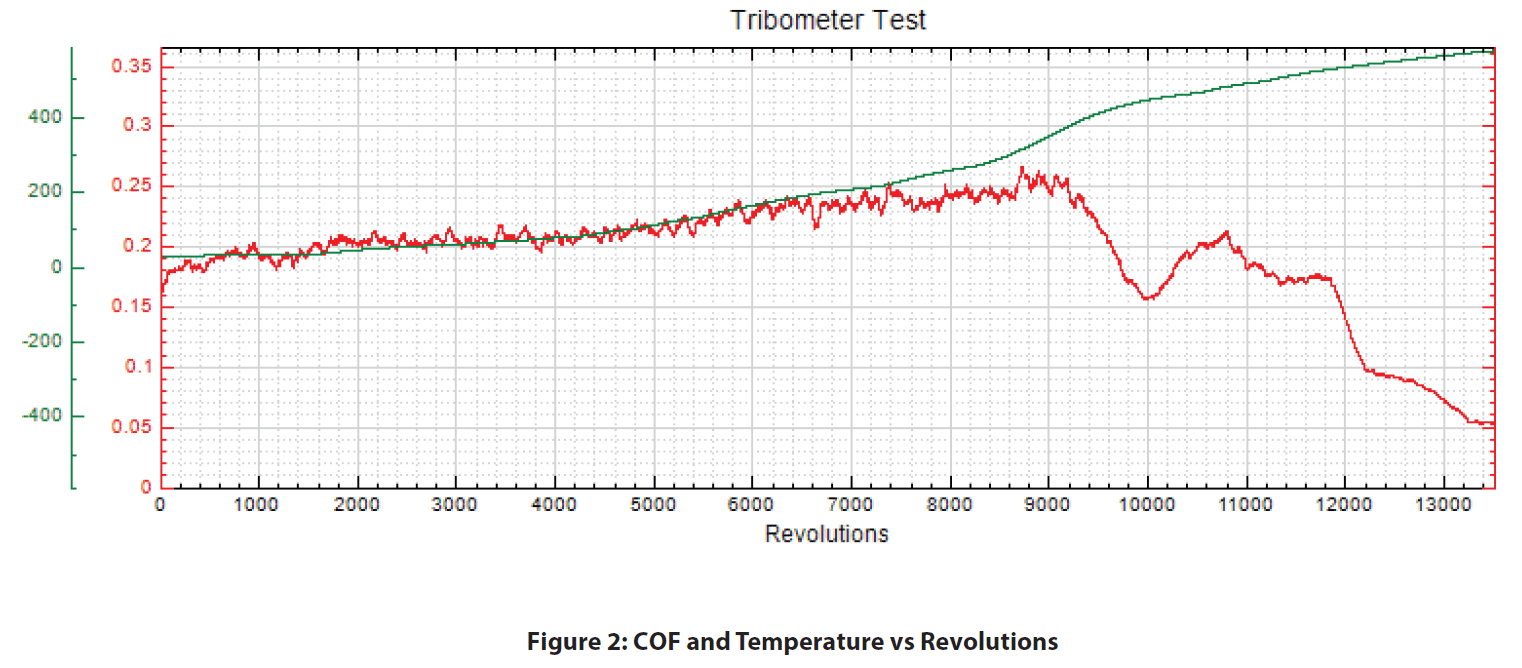
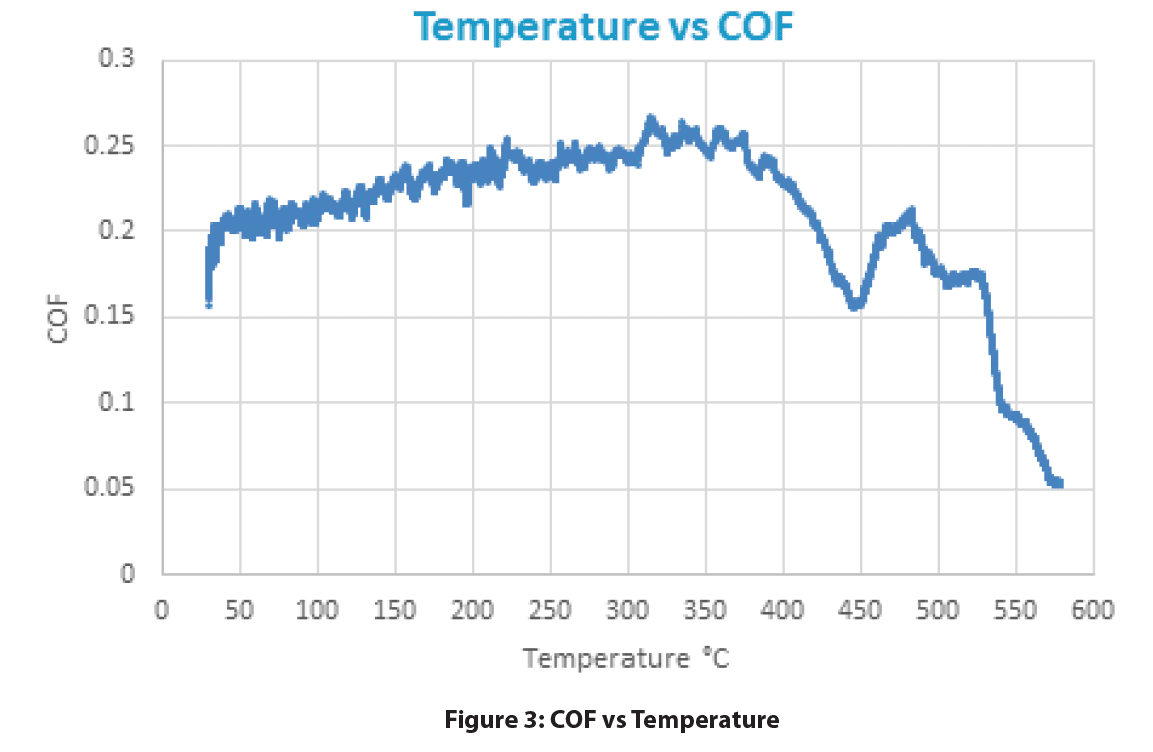
Wear rate is a vital factor for determining the service lifetime of the ball bearing, while a low COF is desirable to improve the bearing performance and efficiency. Figure 3 compares the evolution of COF for di­fferent ball bearings against the sandpaper during the tests. The Cr Steel ball shows an increased COF of ~0.4 during the wear test, compared to ~0.32 and ~0.28 for SS440 and Al2O3 ball bearings. On the other hand, the WC ball exhibits a constant COF of ~0.2 throughout the wear test. Observable COF variation can be seen throughout each test which is attributed to vibrations caused by the sliding movement of the ball bearings against the rough sandpaper surface.


Figure 3:  Evolution of COF during the wear tests.

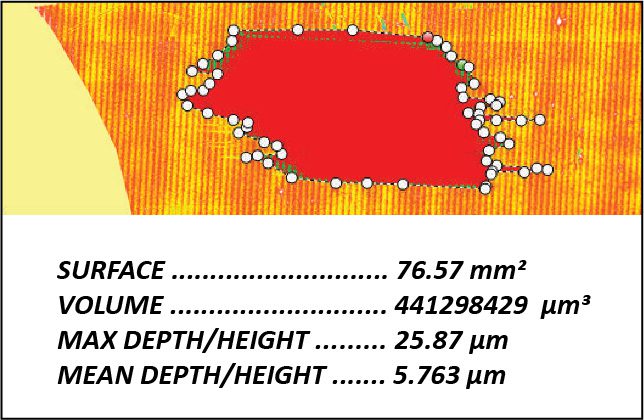
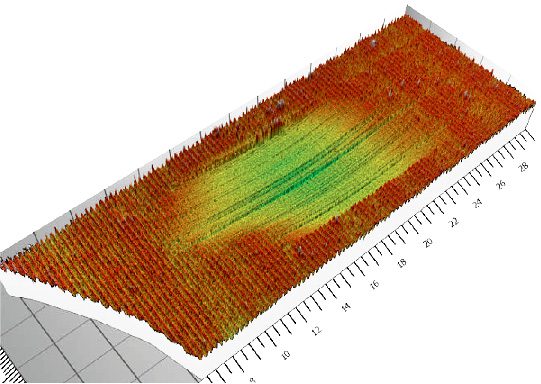
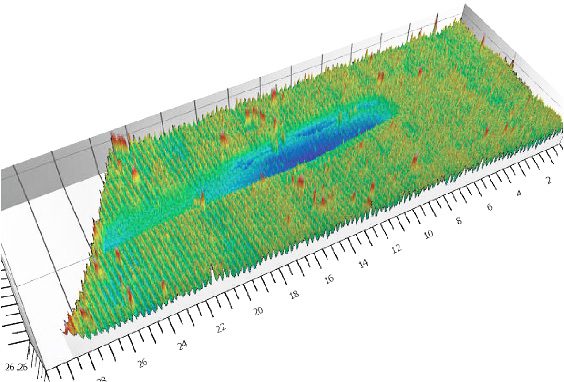
Figure 4 and Figure 5 compare the wear scars of the ball bearings after they were measured by an optical microscope and Nanovea Non-Contact optical profiler, respectively, and Table 2 summarizes the results of the wear track analysis. The Nanovea 3D profiler precisely determines the wear volume of the ball bearings, making it possible to calculate and compare the wear rates of different ball bearings. It can be observed that the Cr Steel and SS440 balls exhibit much larger flattened wear scars compared to the ceramic balls, i.e. Al2O3 and WC after the wear tests. The Cr Steel and SS440 balls have comparable wear rates of 3.7×10⁻³ and 3.2×10⁻³ m3/N m, respectively. In comparison, the Al2O3 ball shows an enhanced wear resistance with a wear rate of 7.2×10⁻⁴ m3/N m. The WC ball barely exhibits minor scratches on the shallow wear track area, resulting in a significantly reduced wear rate of 3.3×10⁻⁶ mm3/N m.

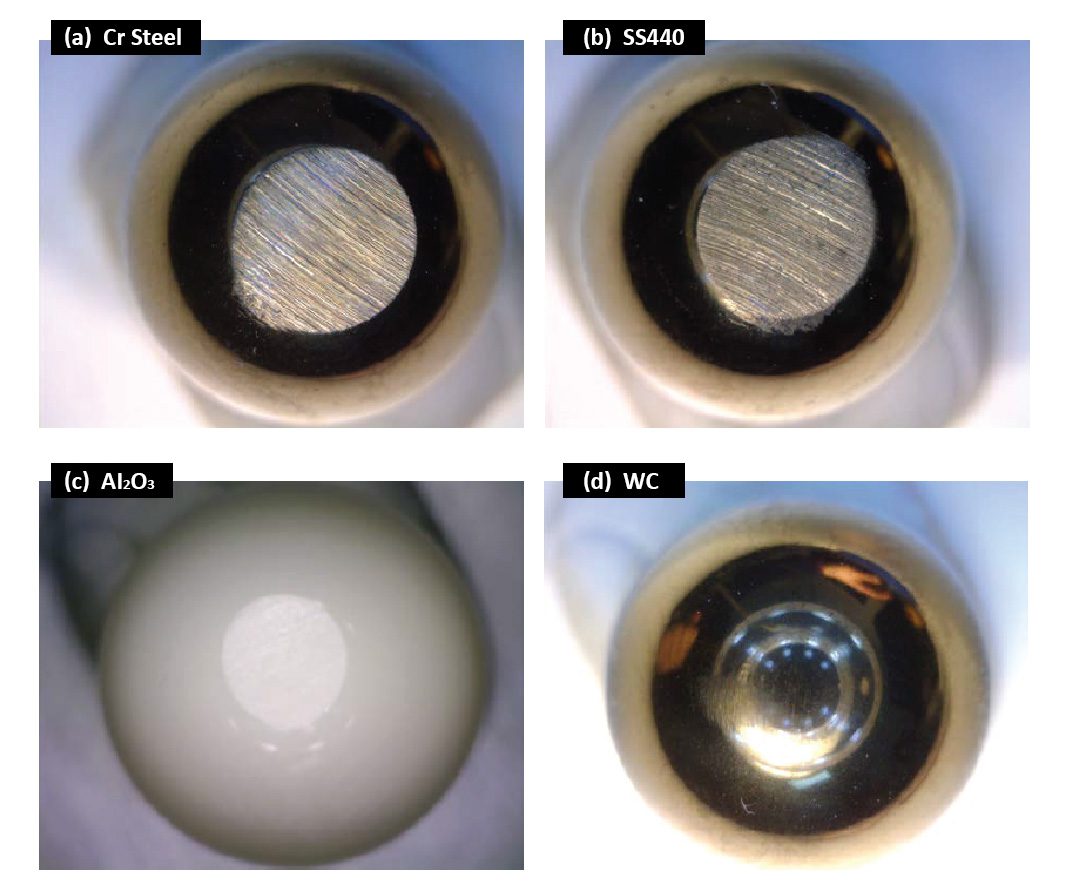
Figure 4:  Wear scars of the ball bearings after the tests.

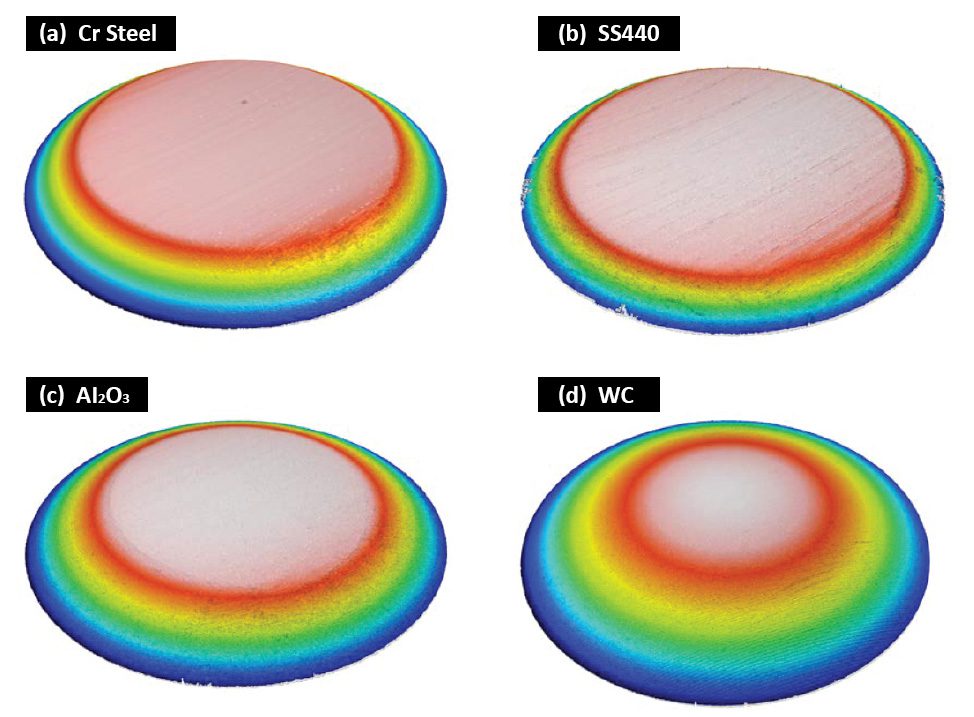
Figure 5:  3D morphology of the wear scars on the ball bearings.

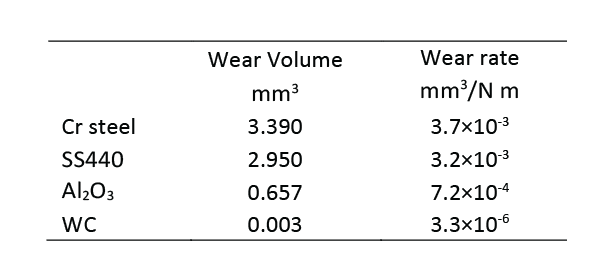
Table 2: Wear scar analysis of the ball bearings.

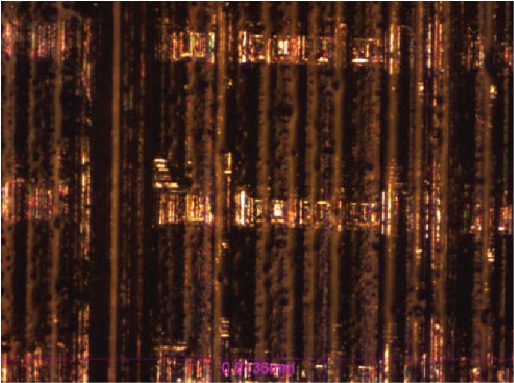
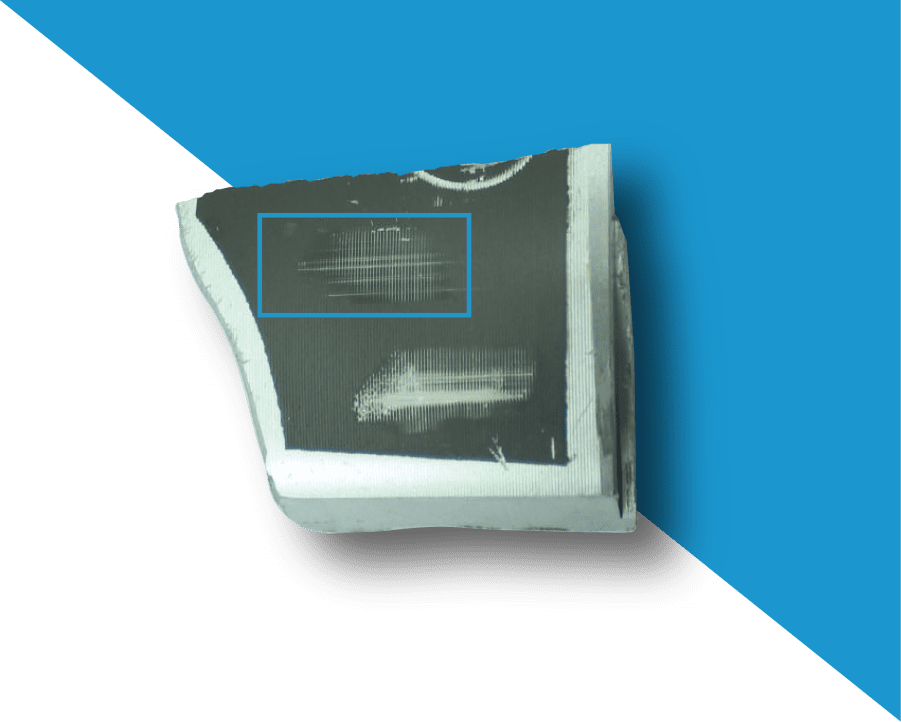
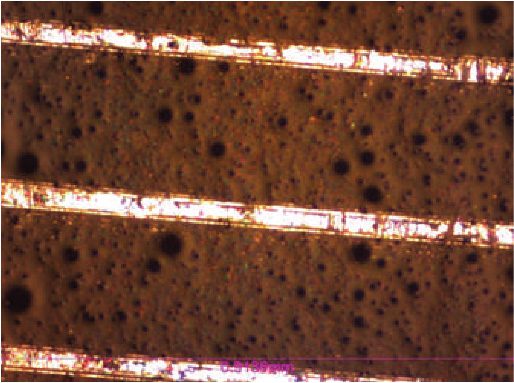
Figure 6 shows microscope images of the wear tracks produced on the sand paper by the four ball bearings. It is evident that the WC ball produced the most severe wear track (removing almost all sand particle in its path) and possesses the best wear resistance. In comparison, the Cr Steel and SS440 balls left a large amount of metal debris on the wear track of the sand paper.
These observations further demonstrate the importance of the benefit of a spiral test. It ensures that the ball bearing always slides on a new surface of the sandpaper, which significantly improves the repeatability of a wear resistance test.

Figure 6:  Wear tracks on the sand paper against different ball bearings.

CONCLUSION

The wear resistance of the ball bearings under a high pressure plays a vital role in their service performance. The ceramic ball bearings possess significantly enhanced wear resistance under high stress conditions and reduce the time and cost due to bearing repairing or replacement. In this study, the WC ball bearing exhibits a substantially higher wear resistance compared to the steel bearings, making it an ideal candidate for bearing applications where severe wear takes place.
A Nanovea Tribometer is designed with high torque capabilities for loads up to 2000 N and precise and controlled motor for rotational speeds from 0.01 to 15,000 rpm. It offers repeatable wear and friction testing using ISO and ASTM compliant rotative and linear modes, with optional high temperature wear and lubrication modules available in one pre-integrated system. This unmatched range allows users to simulate different severe work environments of the ball bearings including high stress, wear and high temperature, etc. It also acts as an ideal tool to quantitatively assess the tribological behaviors of superior wear resistant materials under high loads.
A Nanovea 3D Non-Contact Profiler provides precise wear volume measurements and acts as a tool to analyze the detailed morphology of the wear tracks, providing additional insights in the fundamental understanding of wear mechanisms.

Prepared by
Duanjie Li, PhD, Jonathan Thomas, and Pierre Leroux

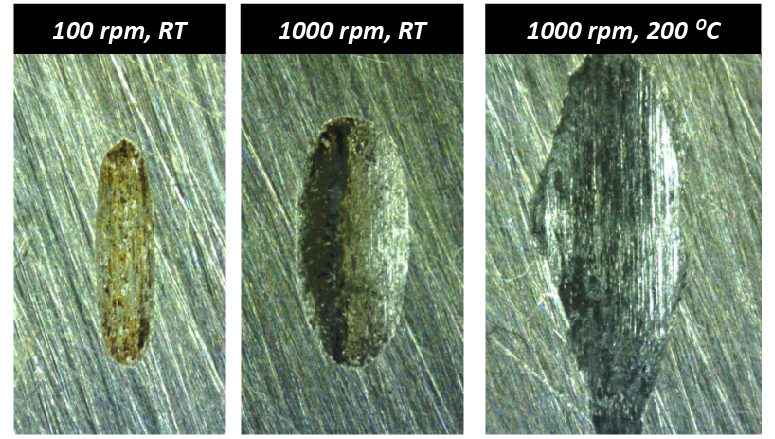
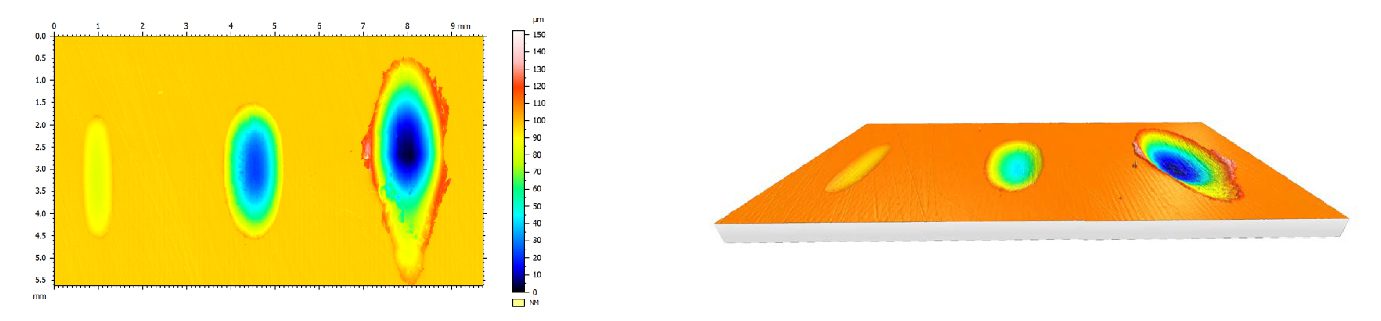
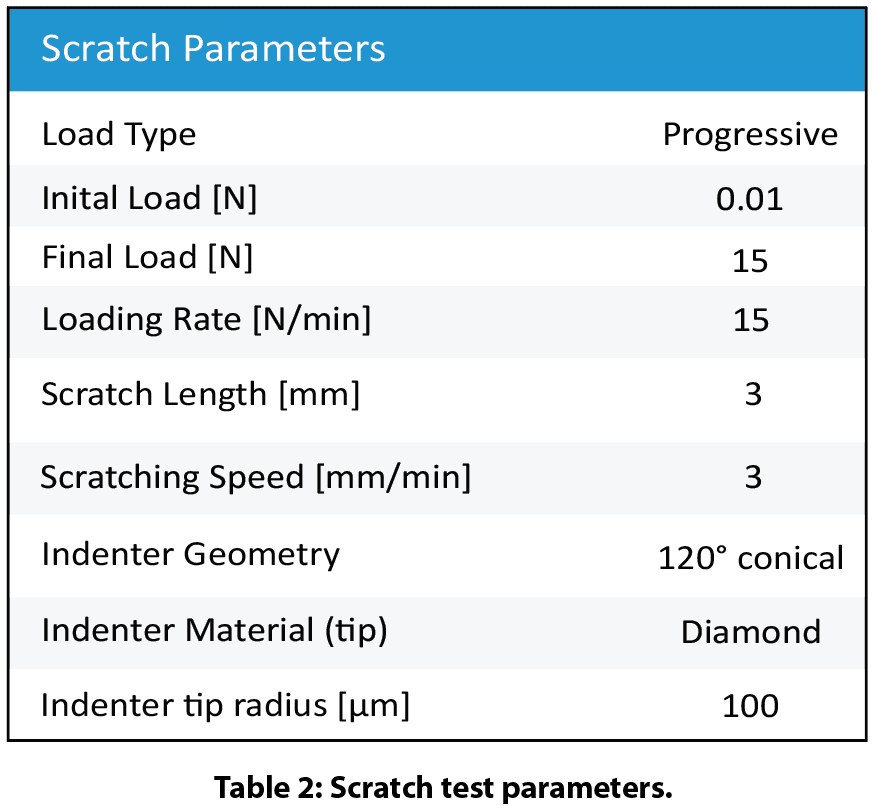
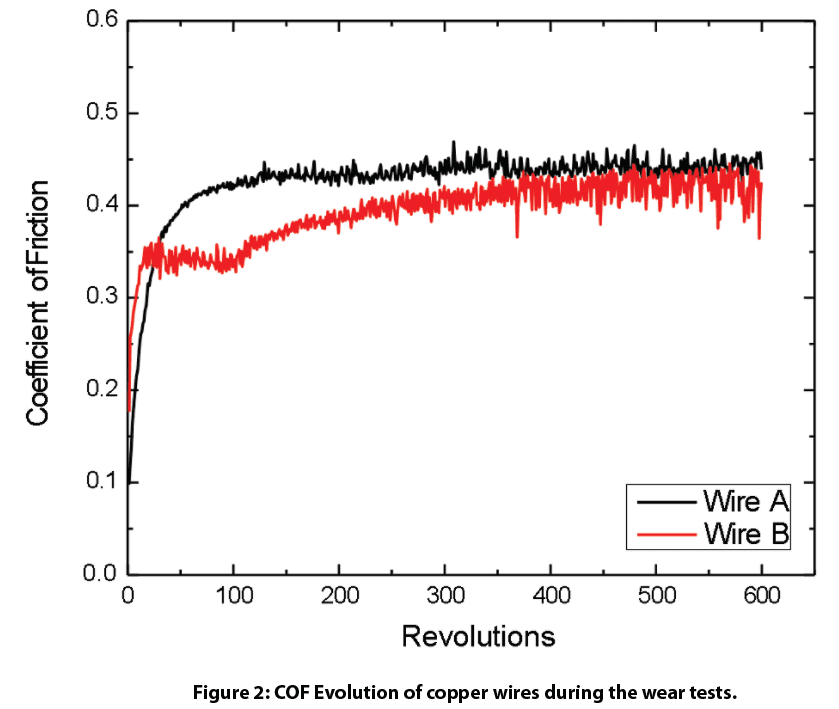
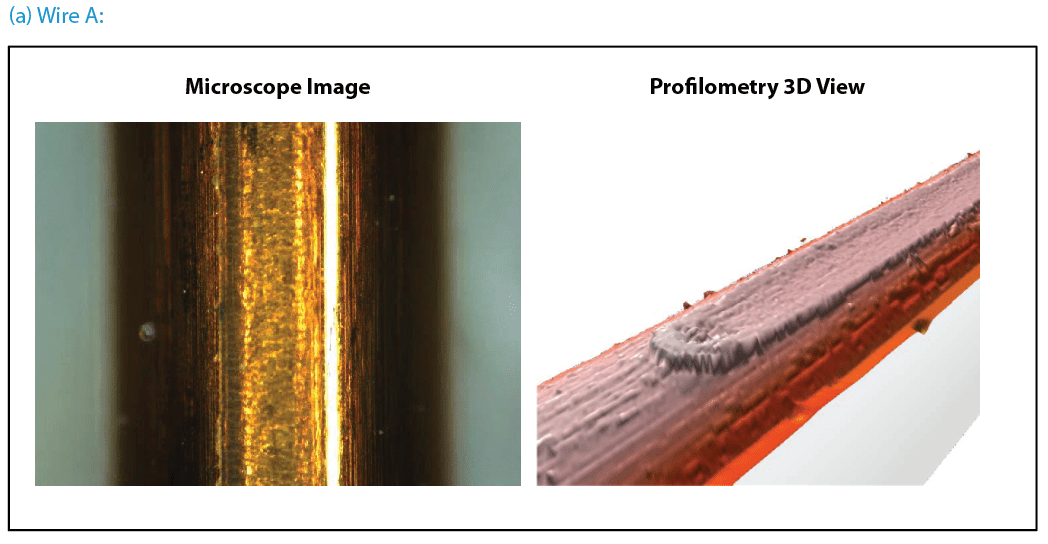
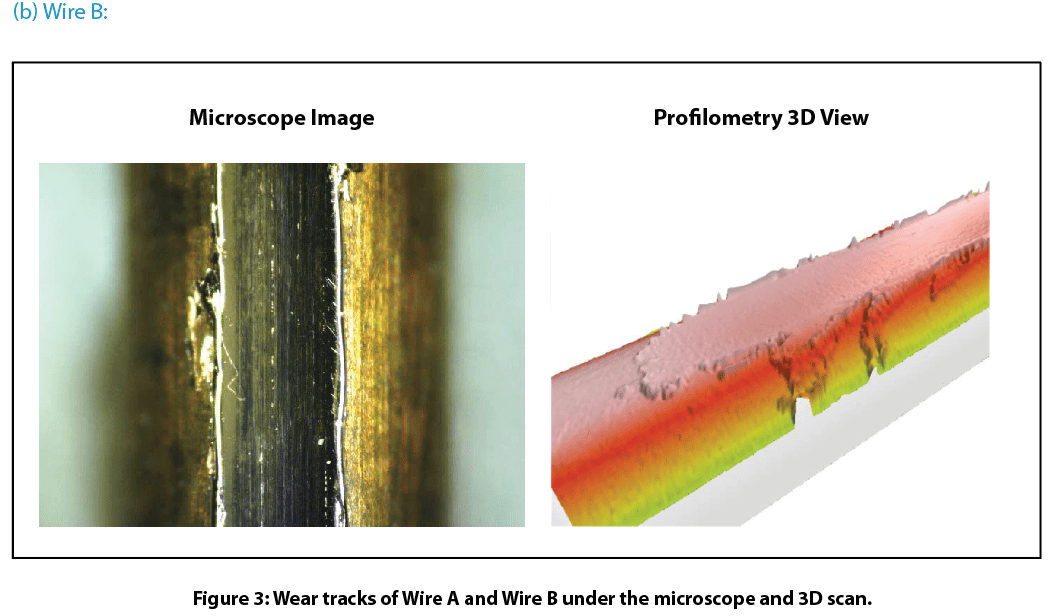
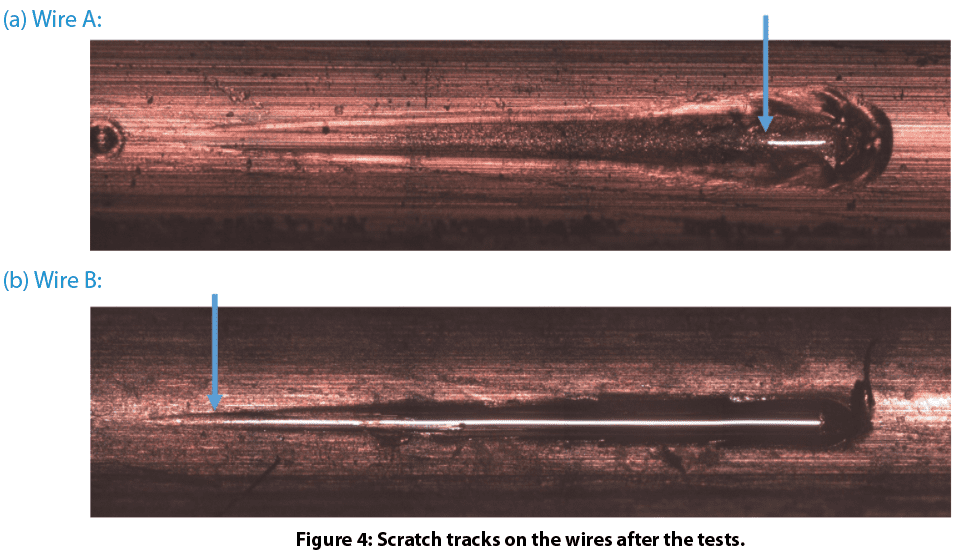
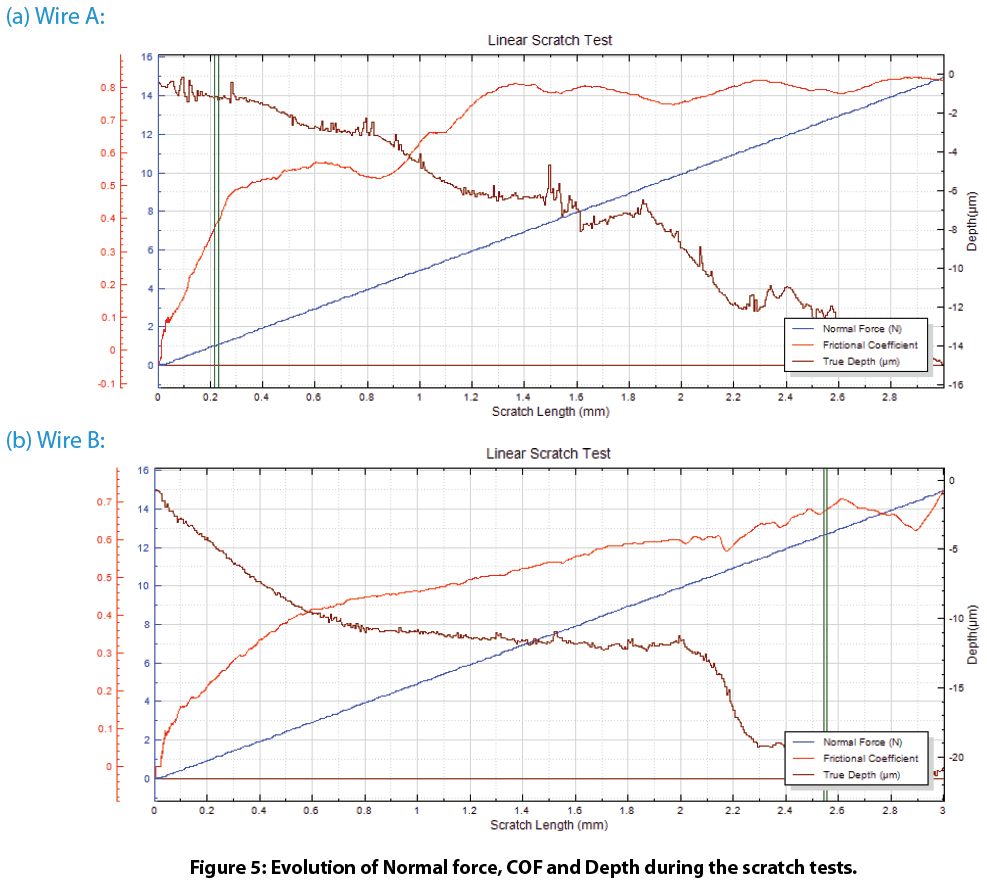
Wear and Scratch Evaluation of Surface Treated Copper Wire


Importance of Wear and Scratch Evaluation of Copper Wire

Copper has a long history of use in electric wiring since the invention of the electromagnet and telegraph. Copper wires are applied in a wide range of electronic equipment such as panels, meters, computers, business machines, and appliances thanks to its corrosion resistance, solderability, and performance at elevated temperatures up to 150°C. Approximately half of all mined copper is used for manufacturing electrical wire and cable conductors.

Copper wire surface quality is critical to application service performance and lifetime. Micro defects in wires may lead to excessive wear, crack initiation and propagation, decreased conductivity, and inadequate solderability. Proper surface treatment of copper wires removes surface defects generated during wire drawing improving corrosion, scratch, and wear resistance. Many aerospace applications with copper wires require controlled behavior to prevent unexpected equipment failure. Quantifiable and reliable measurements are needed to properly evaluate the wear and scratch resistance of the copper wire surface.


Measurement Objective

In this application we simulate a controlled wear process of different copper wire surface treatments. Scratch testing measures the load required to cause failure on the treated surface layer. This study showcases the Nanovea Tribometer and Mechanical Tester as ideal tools for evaluation and quality control of electric wires.


Test Procedure and Procedures

Coefficient of friction (COF) and wear resistance of two different surface treatments on copper wires (Wire A and Wire B) were evaluated by the Nanovea tribometer using a linear reciprocating wear module. An Al₂O₃ ball (6 mm diameter) is the counter material used in this application. The wear track was examined using Nanovea’s 3D non-contact profilometer. Test parameters are summarized in Table 1.

A smooth Al₂O₃ ball as a counter material was used as an example in this study. Any solid material with different shape and surface finish can be applied using a custom fixture to simulate the actual application situation.


Nanovea’s mechanical tester equipped with a Rockwell C diamond stylus (100 μm radius) performed progressive load scratch tests on the coated wires using micro scratch mode. Scratch test parameters and tip geometry are shown in Table 2.


Results and Discussion

Wear of copper wire:

Figure 2 shows COF evolution of the copper wires during wear tests. Wire A shows a stable COF of ~0.4 throughout the wear test while wire B exhibits a COF of ~0.35 in the first 100 revolutions and progressively increases to ~0.4.


Figure 3 compares wear tracks of the copper wires after tests. Nanovea’s 3D non-contact profilometer offered superior analysis of the detailed morphology of wear tracks. It allows direct and accurate determination of the wear track volume by providing a fundamental understanding of the wear mechanism. Wire B’s surface has signi¬ficant wear track damage after a 600-revolution wear test. The profilometer 3D view shows the surface treated layer of Wire B removed completely which substantially accelerated the wear process. This left a flattened wear track on Wire B where copper substrate is exposed. This may result in significantly shortened lifespan of electrical equipment where Wire B is used. In comparison, Wire A exhibits relatively mild wear shown by a shallow wear track on the surface. The surface treated layer on Wire A did not remove like the layer on Wire B under the same conditions.

Scratch resistance of the copper wire surface:

Figure 4 shows the scratch tracks on the wires after testing. The protective layer of Wire A exhibits very good scratch resistance. It delaminates at a load of ~12.6 N. In comparison, the protective layer of Wire B failed at a load of ~1.0 N. Such a significant difference in scratch resistance for these wires contributes to their wear performance, where Wire A possesses substantially enhanced wear resistance. The evolution of normal force, COF, and depth during the scratch tests shown in Fig. 5 provides more insight on coating failure during tests.

Conclusion

In this controlled study we showcased the Nanovea’s tribometer conducting quantitative evaluation of wear resistance for surface treated copper wires and Nanovea’s mechanical tester providing reliable assessment of copper wire scratch resistance. Wire surface treatment plays a critical role in the tribo-mechanical properties during their lifetime. Proper surface treatment on Wire A significantly enhanced wear and scratch resistance, critical in the performance and lifespan of electrical wires in rough environments.

Nanovea’s tribometer offers precise and repeatable wear and friction testing using ISO and ASTM compliant rotative and linear modes, with optional high temperature wear, lubrication, and tribo-corrosion modules available in one pre-integrated system. Nanovea’s unmatched range is an ideal solution for determining the full range of tribological properties of thin or thick, soft or hard coatings, films, and substrates.

NOW, LET'S TALK ABOUT YOUR APPLICATION

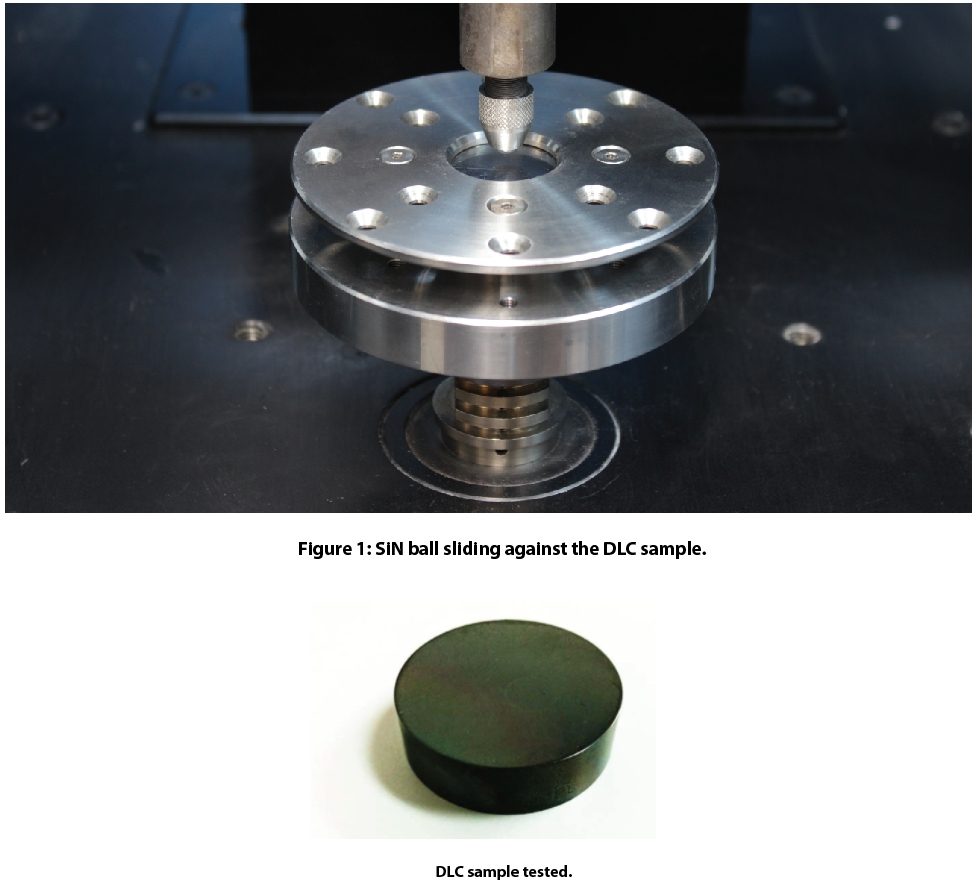
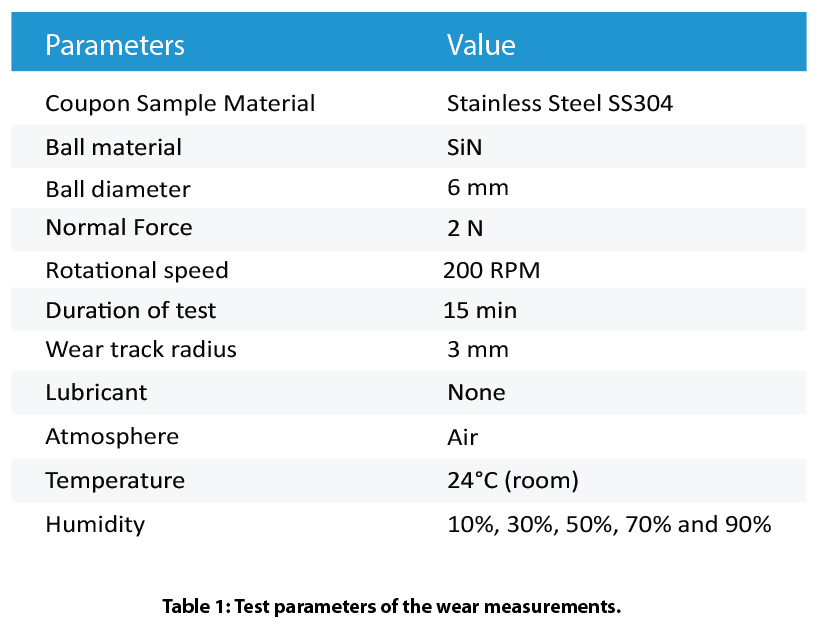
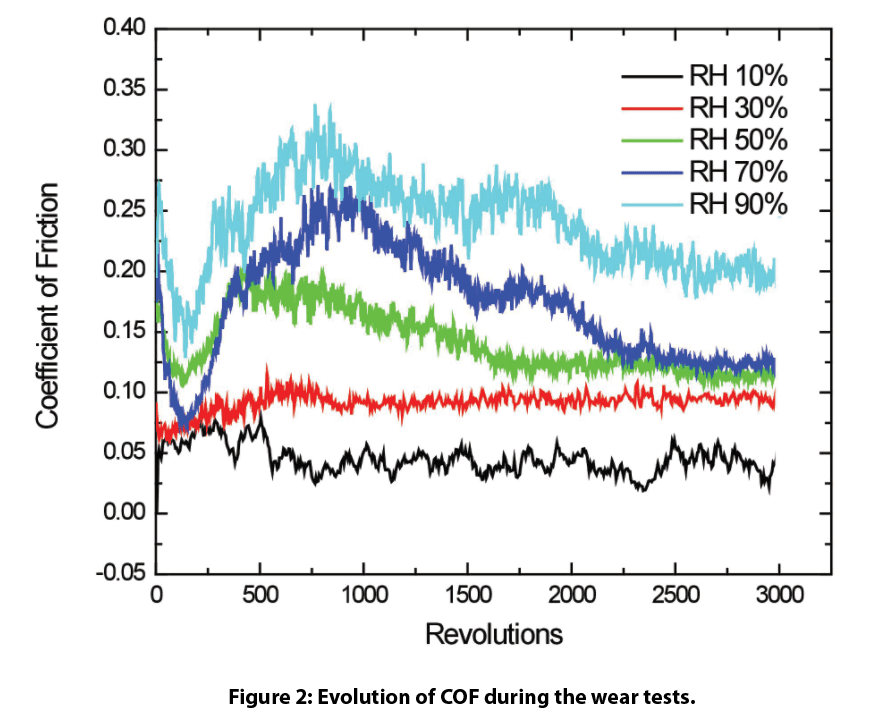
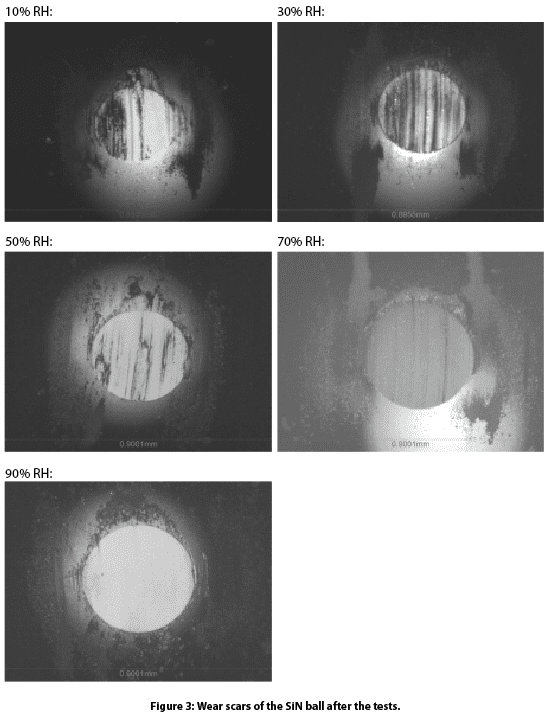
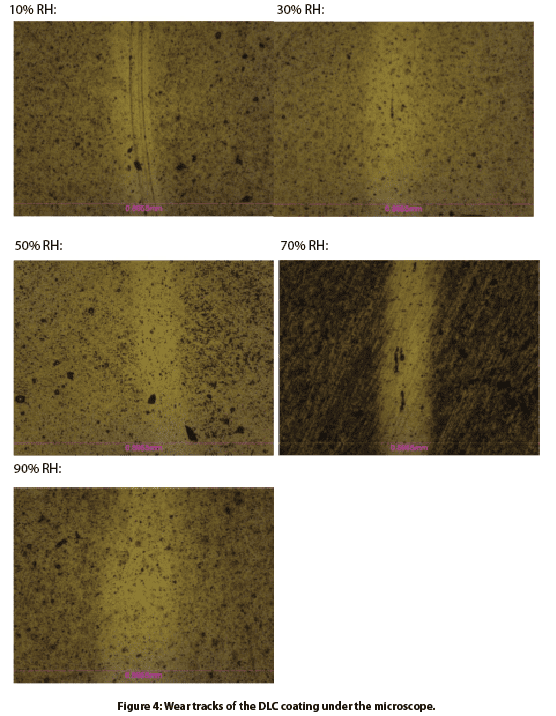
Humidity Effect on DLC Coating Tribology

Importance of Wear Evaluation on DLC in Humidity

Diamond-like carbon (DLC) coatings possess enhanced tribological properties, namely excellent wear resistance and a very low coefficient of friction (COF). DLC coatings impart diamond characteristics when deposited on different materials. Favorable tribo-mechanical properties make DLC coatings preferable in various industrial applications, such as aerospace parts, razor blades, metal cutting tools, bearings, motorcycle engines, and medical implants.

DLC coatings exhibit very low COF (below 0.1) against steel balls under high vacuum and dry conditions12. However, DLC coatings are sensitive to environmental condition changes, particularly relative humidity (RH)3. Environments with high humidity and oxygen concentration may lead to significant increase in COF4. Reliable wear evaluation in controlled humidity simulates realistic environmental conditions of DLC coatings for tribological applications. Users select the best DLC coatings for target applications with proper comparison
of DLC wear behaviors exposed to different humidity.


Measurement Objective

This study showcases the Nanovea Tribometer equipped with a humidity controller is the ideal tool for investigating wear behavior of DLC coatings at various relative humidity.


Test Procedure

Friction and wear resistance of DLC coatings were evaluated by the Nanovea Tribometer. Test parameters are summarized in Table 1. A humidity controller attached to the tribo-chamber precisely controlled the relative humidity (RH) with an accuracy of ±1%. Wear tracks on DLC coatings and wear scars on SiN balls were examined using an optical microscope after tests.

Note: Any solid ball material can be applied to simulate the performance of different material coupling under environmental conditions such as in lubricant or high temperature.


Results and Discussion

DLC coatings are great for tribological applications due to their low friction and superior wear resistance. The DLC coating friction exhibits humidity dependent behavior shown in Figure 2. The DLC coating shows a very low COF of ~0.05 throughout the wear test in relatively dry conditions (10% RH). The DLC coating exhibits a constant COF of ~0.1 during the test as RH increases to 30%. The initial run-in stage of COF is observed in the first 2000 revolutions when RH rises above 50%. The DLC coating shows a maximum COF of ~0.20, ~0.26 and ~0.33 in RH of 50, 70 and 90%, respectively. Following the run-in period, the DLC coating COF stays constant at ~0.11, 0.13 and 0.20 in RH of 50, 70 and 90%, respectively.


Figure 3 compares SiN ball wear scars and Figure 4 compares DLC coating wear tracks after the wear tests. The diameter of the wear scar was smaller when the DLC coating was exposed to an environment with low humidity. Transfer DLC layer accumulates on the SiN ball surface during the repetitive sliding process at the contact surface. At this stage, the DLC coating slides against its own transfer layer which acts as an efficient lubricant to facilitate the relative motion and restrain further mass loss caused by shear deformation. A transfer film is observed in the wear scar of the SiN ball in low RH environments (e.g. 10% and 30%), resulting in a decelerated wear process on the ball. This wear process reflects on the DLC coating’s wear track morphology as shown in Figure 4. The DLC coating exhibits a smaller wear track in dry environments, due to the formation of a stable DLC transfer film at the contact interface which significantly reduces friction and wear rate.


Conclusion


Humidity plays a vital role in the tribological performance of DLC coatings. The DLC coating possesses significantly enhanced wear resistance and superior low friction in dry conditions due to the formation of a stable graphitic layer transferred onto the sliding counterpart (a SiN ball in this study). The DLC coating slides against its own transfer layer, which acts as an efficient lubricant to facilitate the relative motion and restrain further mass loss caused by shear deformation. A film is not observed on the SiN ball with increasing relative humidity, leading to an increased wear rate on the SiN ball and the DLC coating.

The Nanovea Tribometer offers repeatable wear and friction testing using ISO and ASTM compliant rotative and linear modes, with optional humidity modules available in one pre- integrated system. It allows users to simulate the work environment at different humidity, providing users an ideal tool to quantitatively assess the tribological behaviors of materials under different work conditions.


Learn More about the Nanovea Tribometer and Lab Service

1 C. Donnet, Surf. Coat. Technol. 100–101 (1998) 180.

2 K. Miyoshi, B. Pohlchuck, K.W. Street, J.S. Zabinski, J.H. Sanders, A.A. Voevodin, R.L.C. Wu, Wear 225–229 (1999) 65.

3 R. Gilmore, R. Hauert, Surf. Coat. Technol. 133–134 (2000) 437.

4 R. Memming, H.J. Tolle, P.E. Wierenga, Thin Solid Coatings 143 (1986) 31


NOW, LET'S TALK ABOUT YOUR APPLICATION

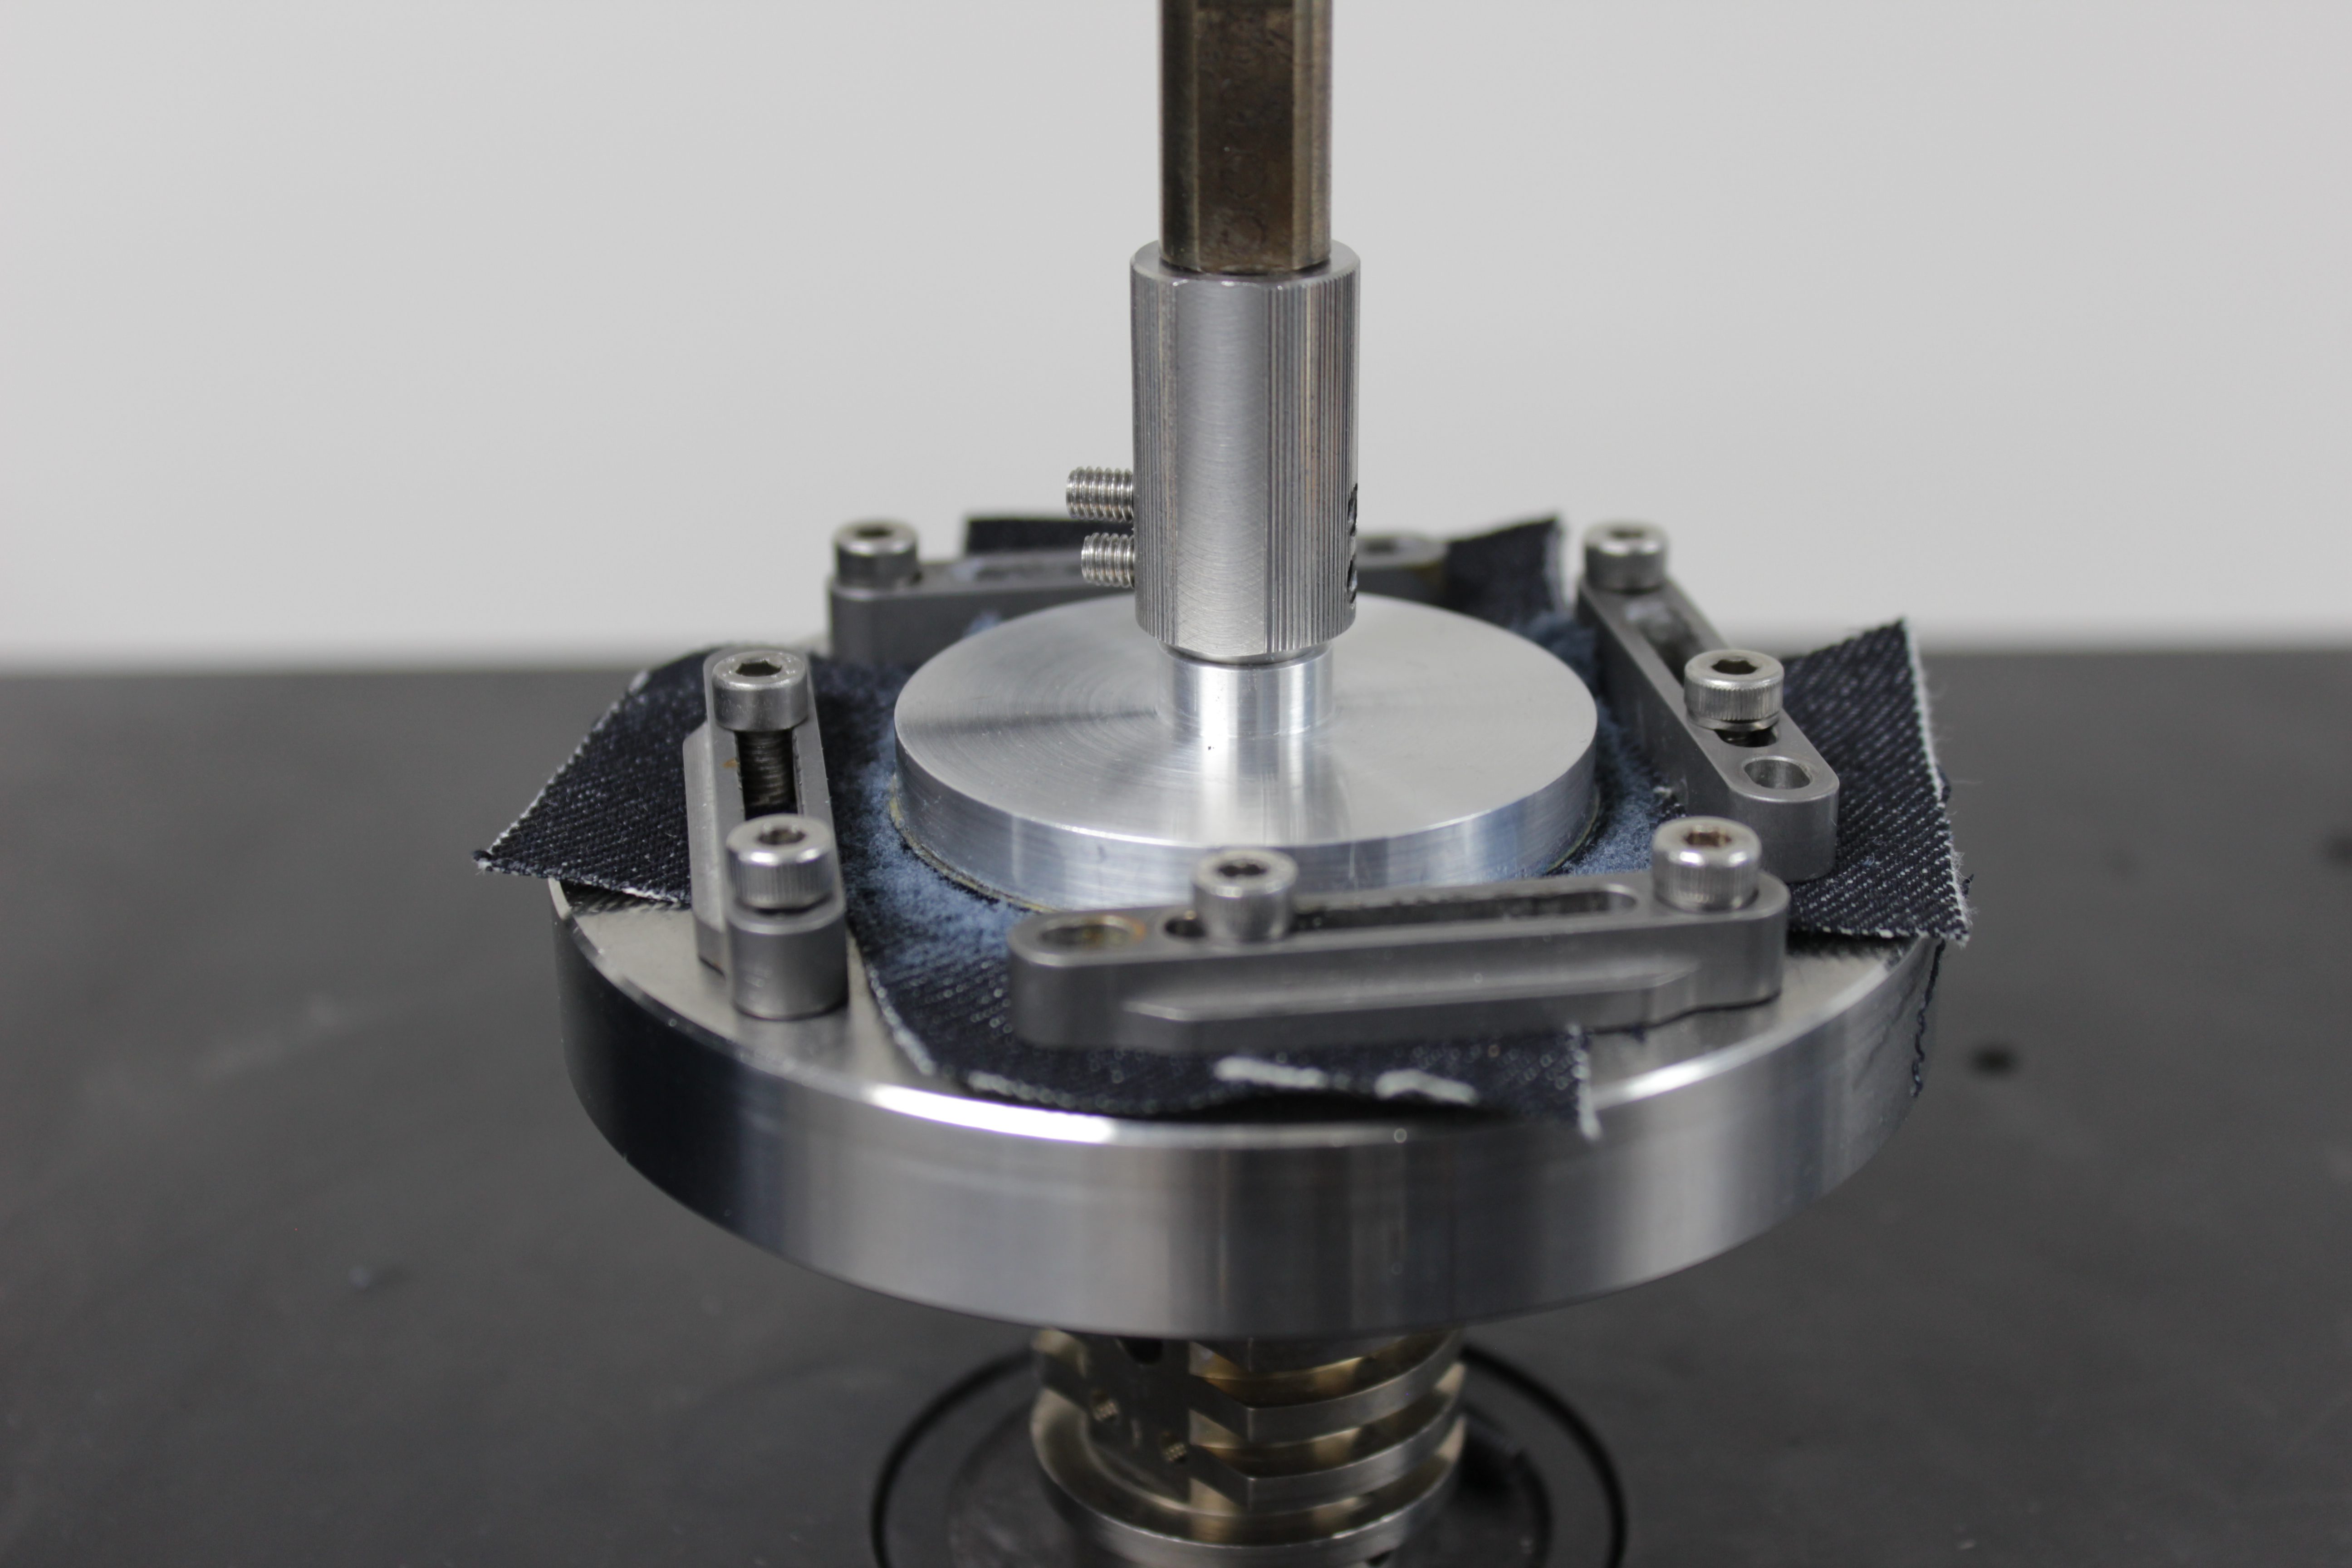
Comparing Abrasion Wear on Denim

Introduction

The form and function of a fabric is determined by its quality and durability. Daily usage of fabrics cause wear and tear on the material, e.g. piling, fuzzing, and discoloration. Subpar fabric quality used for clothing can often lead to consumer dissatisfaction and brand damage.

Attempting to quantify the mechanical properties of fabrics can pose many challenges. The yarn structure and even the factory in which it was produced can result in poor reproducibility of test results. Making it difficult to compare test results from different laboratories. Measuring the wear performance of fabrics is critical to the manufacturers, distributors, and retailers in the textile production chain. A well controlled and reproducible wear resistance measurement is crucial to ensure reliable quality control of the fabric.

Click to read the full application note!

Rotative or Linear Wear & COF? (A Comprehensive Study Using the Nanovea Tribometer)

Wear is the process of removal and deformation of material on a surface as a result of the mechanical action of the opposite surface. It is influenced by a variety of factors, including unidirectional sliding, rolling, speed, temperature, and many others. The study of wear, tribology, spans many disciplines, from physics and chemistry to mechanical engineering and material science. The complex nature of wear requires isolated studies toward specific wear mechanisms or processes, such as adhesive wear, abrasive wear, surface fatigue, fretting wear, and erosive wear. However, “Industrial Wear” commonly involves multiple wear mechanisms occurring in synergy.

Linear reciprocating and Rotative (Pin on Disk) wear tests are two widely used ASTM-compliant setups for measuring sliding wear behaviors of materials. Since the wear rate value of any wear test method is often used to predict the relative ranking of material combinations, it is extremely important to confirm the repeatability of the wear rate measured using different test setups. This enables users to carefully consider the wear rate value reported in the literature, which is critical in understanding the tribological characteristics of materials.

Read More!

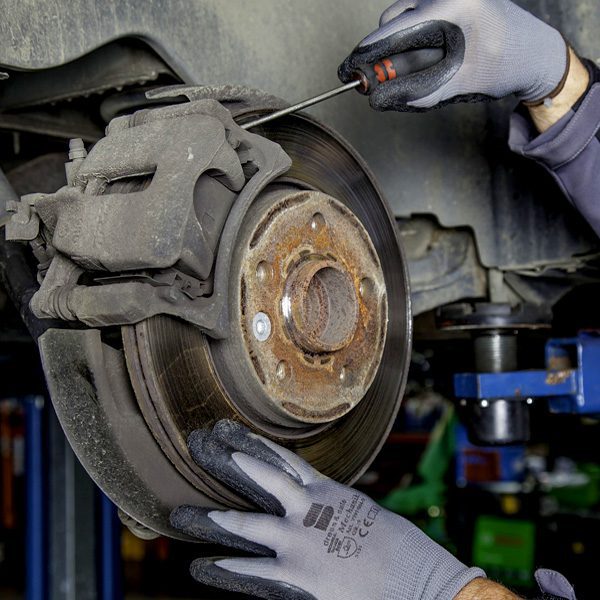
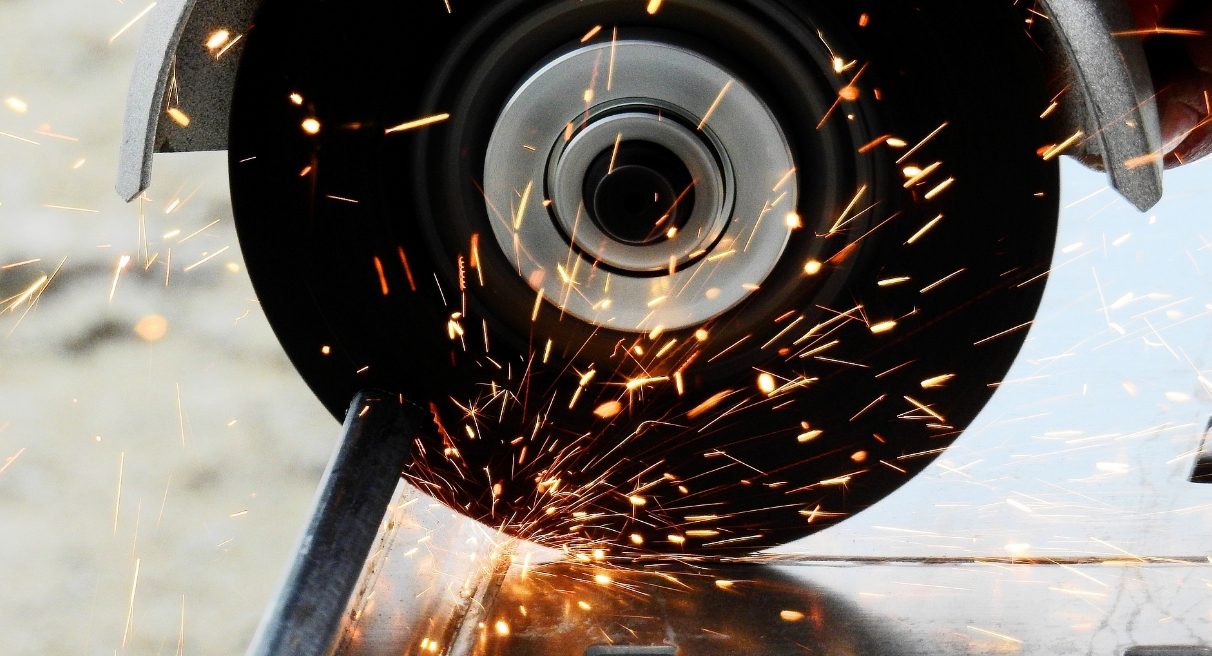
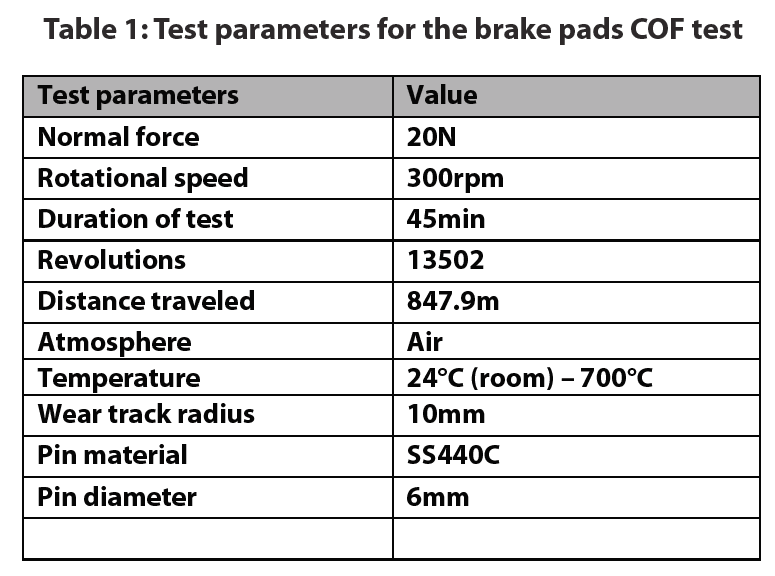
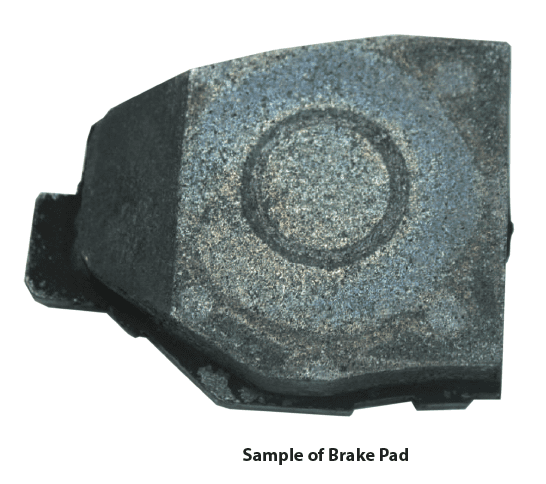
Evaluating Brake Pads with Tribology


Importance of Evaluating Break Pad Performance

Brake pads are composites., a material made up of multiple ingredients, that must be able to satisfy a large number of safety requirements. Ideal brake pads have high coefficient of friction (COF), low wear rate, minimal noise, and remain reliable under varying environments. To ensure the quality of brake pads are able to satisfy their requirements, tribology testing can be used to identify critical specifications.


The importance of the reliability of brake pads is placed very high; the safety of passengers should never be neglected. Therefore, it is key to replicate operating conditions and identify possible points of failure.
With the Nanovea Tribometer, a constant load is applied between a pin, ball, or flat and a constantly moving counter material. The friction between the two material is collected with a stiff load cell, allowing the collection of material properties at different loads and speeds and tested in high temperature, corrosive, or liquid environments.


Measurement Objective

In this study, the coefficient of friction of the brake pads were studied under a continuously increasing temperature environment from room temperature to 700°C. The environmental temperature was raised in-situ until noticeable failure of the brake pad was observed. A thermocouple was attached to the backside of the pin to measure the temperature near the sliding interface.


Test Procedure and Procedures


Results and Discussion

This study focuses mainly on the temperature at which brake pads start to fail. The COF obtained do not represent real-life values; the pin material is not the same as brake rotors. It should also be noted that the temperature data collected is the temperature of the pin and not the sliding interface temperature


At the start of the test (room temperature), the COF between the SS440C pin and brake pad gave a consistent value of approximately 0.2. As the temperature increased, the COF steadily increased and peaked at a value of 0.26 near 350°C. Past 390°C, the COF quickly starts decreasing. The COF began to increase back to 0.2 at 450°C but starts decreasing to a value of 0.05 shortly after.


The temperature at which the brake pads consistently failed is identified at temperatures above 500°C. Past this temperature, the COF was no longer able to retain the starting COF of 0.2.


Conclusion


The brake pads have shown consistent failure at a temperature past 500°C. Its COF of 0.2 slowly rises to a value of 0.26 before dropping down to 0.05 at the end of the test (580°C). The difference between 0.05 and 0.2 is a factor of 4. This means that the normal force at 580°C must be four times greater than at room temperature to achieve the same stopping force!


While not included in this study, the Nanovea Tribometer is also able to conduct testing to observe another important property of brake pads: wear rate. By utilizing our 3D non-contact profilometers, the volume of the wear track can be obtained to calculate how quickly samples wear. Wear testing can be conducted with the Nanovea Tribometer under different test conditions and environments to best simulate operating conditions.

NOW, LET'S TALK ABOUT YOUR APPLICATION