EN
EN  ES
ES  DE
DE  FR
FR  IT
IT  ZH
ZH  JA
JA  PT
PT  TR
TR  KO
KO  PL
PL  AR
AR Category: Mechanical Testing

Compression on Soft, Flexible Materials
Importance of testing soft, flexible materials
An example of very soft and flexible samples is a microelectromechanical system. MEMS are used in everyday commercial products like printers, mobile phones, and cars [1]. Their uses also include special functions, such as biosensors [2] and energy harvesting [3]. For their applications, MEMS must be able to reversibly transition between their original configuration to a compressed configuration repeatedly [4]. To understand how the structures will react to mechanical forces, compression testing can be conducted. Compression testing can be utilized to test and tune various MEMS configurations as well as testing upper and lower force limits for these samples.
The Nanovea Mechanical Tester Nano Module’s ability to accurately collect data at very low loads and travel over 1mm of distance makes it ideal for testing the soft and exible samples. By having independent load and depth sensors, large indenter displacement does not affect the readings by the load sensor. The ability to carry out low-load testing over a range of more than 1mm of indenter travel makes our system unique compared to other nanoindentation systems. In comparison, a reasonable travel distance for a nanoscale indentation system is typically below 250μm.
Measurement Objective
In this case study, Nanovea conducted compression testing on two uniquely di erent flexible, spring-like samples. We showcase our ability to conduct compression at very low loads and record large displacement while accurately obtaining data at low loads and how this can be applied to the MEMS industry. Due to privacy policies, the samples and their origin will not be revealed in this study
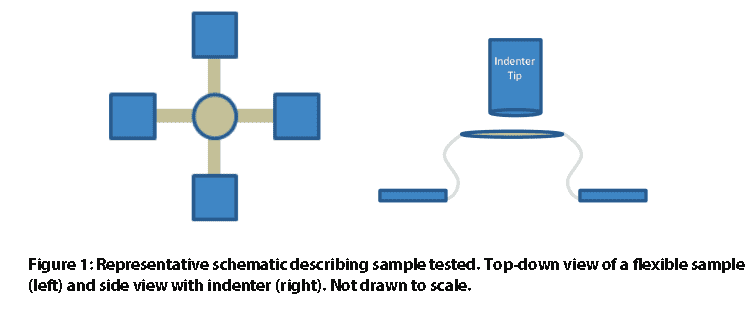
Measurement Parameters
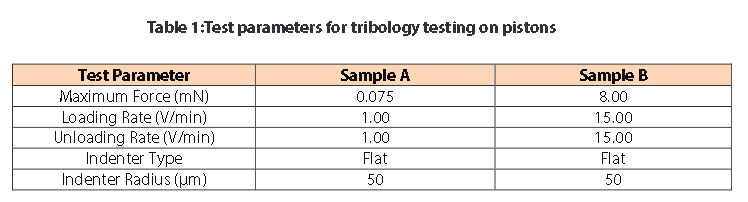
Note: The loading rate of 1 V/min is proportional to approximately 100μm of displacement when the indenter is in the air.
Results and Discussion
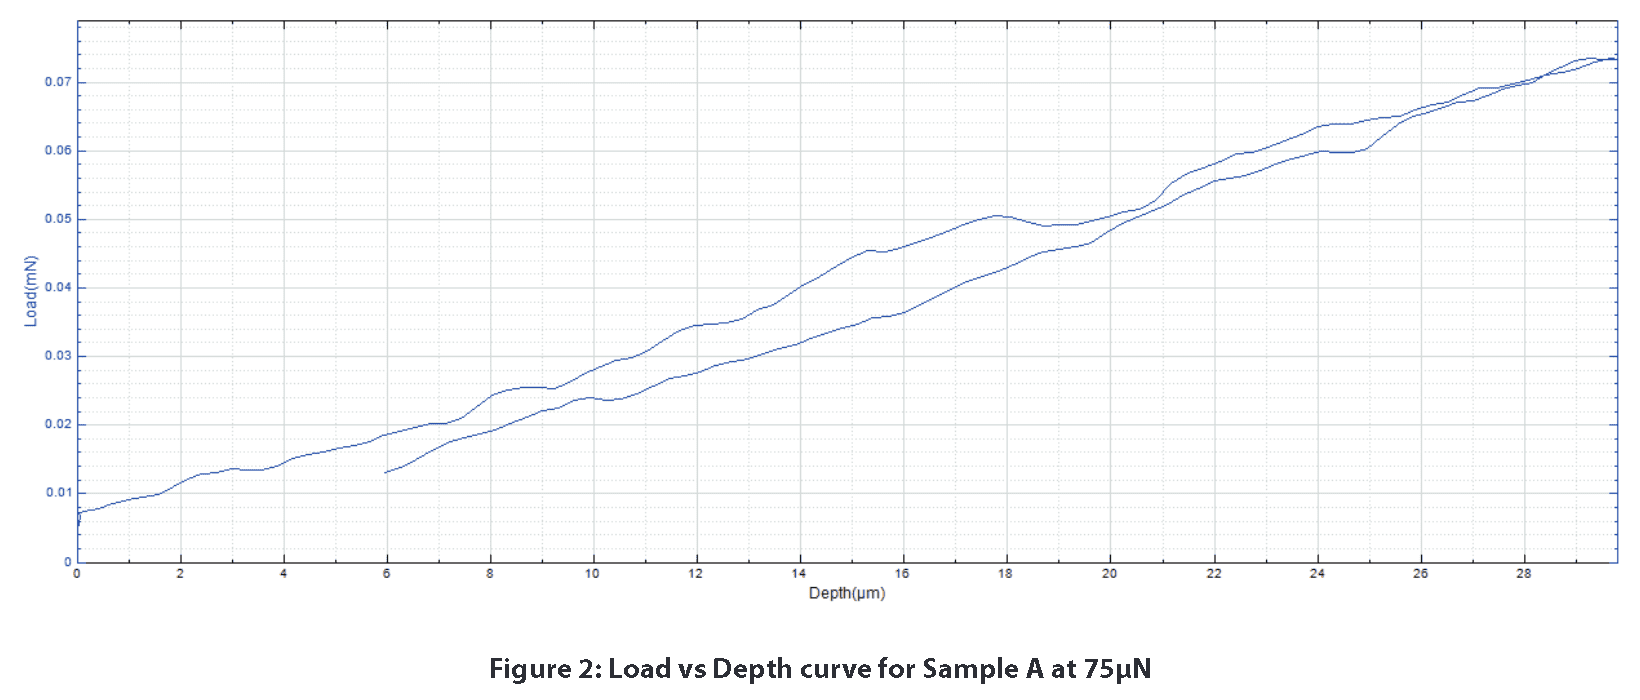
The sample’s response to mechanical forces can be seen in the load vs depth curves. Sample A only displays linear elastic deformation with the test parameters listed above. Figure 2 is a great example of the stability that can be achieved for a load vs. depth curve at 75μN. Due to the load and depth sensors stability, it would be easy to perceive any signi cant mechanical response from the sample.
Sample B displays a different mechanical response from Sample A. Past 750μm of depth, fracture-like behavior in the graph begins to appear. This is seen with the sharp drops in load at 850 and 975μm of depth. Despite traveling at a high loading rate for more than 1mm over a range of 8mN, our highly sensitive load and depth sensors allow the user to obtain the sleek load vs depth curves below.
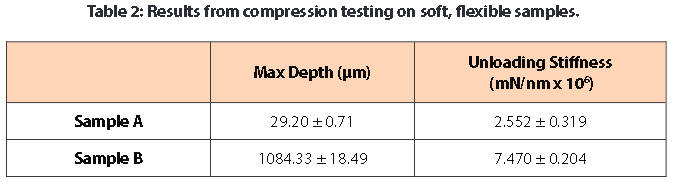
The stiffness was calculated from the unloading portion of the load vs depth curves. Stiffness reflects how much force is necessary to deform the sample. For this stiffness calculation, a pseudo Poisson’s ratio of 0.3 was used since the actual ratio of the material is not known. In this case, Sample B proved to be stiffer than Sample A.

Conclusion
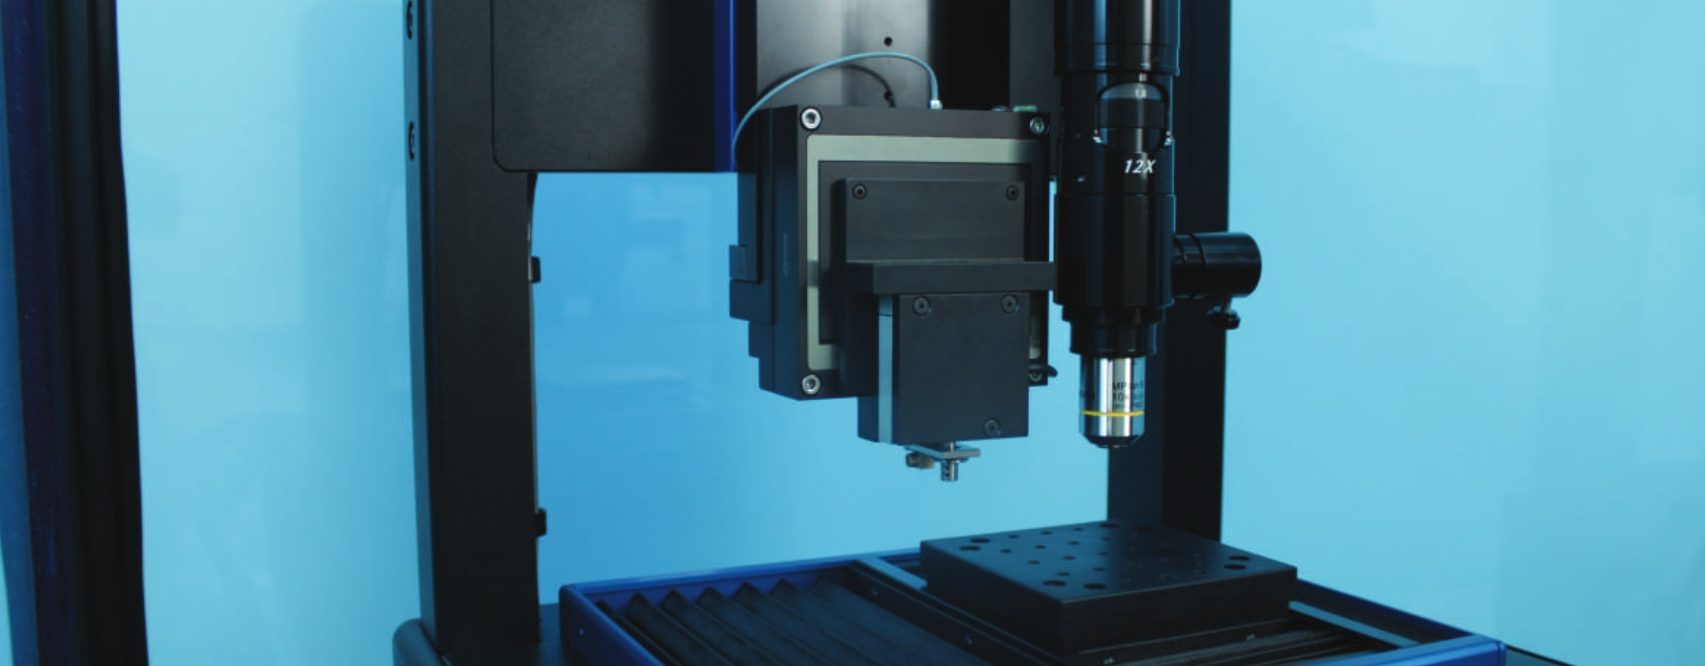
Two diff erent flexible samples were tested under compression using the Nanovea Mechanical Tester’s Nano Module. The tests were conducted at very low loads (<80μN) and over a large depth range (>1mm). Nano-scaled compression testing with the Nano Module has shown the module’s ability to test very soft and flexible samples. Additional testing for this study could address how repeated cyclical loading a ects the elastic recovery aspect of the spring-like samples via the Nanovea Mechanical Tester’s multi-loading option.
For more information on this testing method, feel free to contact us at [email protected] and for additional application notes please browse our extensive Application Note digital library.
References
[1] “Introduction and Application Areas for MEMS.” EEHerald, 1 Mar. 2017, www.eeherald.com/section/design-guide/mems_application_introduction.html.
[2] Louizos, Louizos-Alexandros; Athanasopoulos, Panagiotis G.; Varty, Kevin (2012). “Microelectromechanical Systems and Nanotechnology. A Platform for the Next Stent Technological Era”. Vasc Endovascular Surg.46 (8): 605–609. doi:10.1177/1538574412462637. PMID 23047818.
[3] Hajati, Arman; Sang-Gook Kim (2011). “Ultra-wide bandwidth piezoelectric energy harvesting”. AppliedPhysics Letters. 99 (8): 083105. doi:10.1063/1.3629551.
[4] Fu, Haoran, et al. “Morphable 3D mesostructures and microelectronic devices by multistable bucklingmechanics.” Nature materials 17.3 (2018): 268.

Viscoelastic Analysis of Rubber


Tires are subjected to cyclical high deformations when vehicles are running on the road. When exposed to harsh road conditions, the service lifetime of the tires is jeopardized by many factors, such as the wear of the thread, the heat generated by friction, rubber aging, and others.
As a result, tires usually have composite layer structures made of carbon-filled rubber, nylon cords, and steel wires, etc. In particular, the composition of rubber at different areas of the tire systems is optimized to provide different functional properties, including but not limited to wear resistant thread, cushion rubber layer, and hard rubber base layer.
A reliable and repeatable test of the viscoelastic behavior of rubber is critical in quality control and R&D of new tires, as well as evaluation of the life span of old tires. Dynamic Mechanical Analysis(DMA) during Nanoindentation is a technique of characterizing the viscoelasticity. When controlled oscillatory stress is applied, the resulting strain is measured, allowing users to determine the complex modulus of the tested materials.

A BETTER Look at Polycarbonate Lens
Scratch Testing on Multi-Layered Thin Film
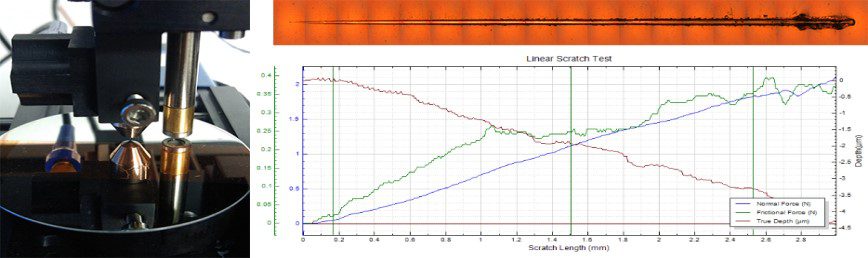
Coatings used extensively throughout multiple industries to preserve the underlying layers, to create electronic devices, or to improve surface properties of materials. Due to their numerous uses coatings are extensively studied, but their mechanical properties can be difficult to understand. Failure of coatings can occur in the micro/nanometer range from surface-atmosphere interaction, cohesive failure, and poor substrate-interface adhesion. A consistent method to test for coating failures is scratch testing. By applying a progressively increasing load, cohesive (e.g. cracking) and adhesive (e.g. delamination) failures of coatings can be quantitatively compared.
Dynamic Mechanical Analysis With Nanoindentation
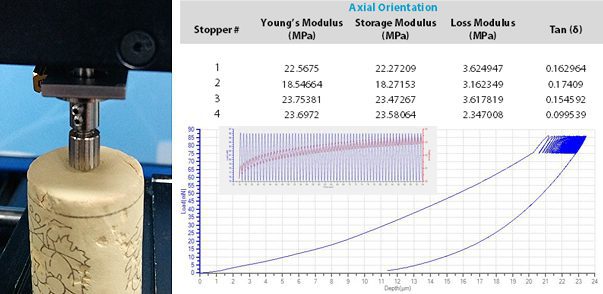
The quality of corks depends heavily on its mechanical and physical property. Its ability to seal wine can be identified as these important factors: flexibility, insulation, resilience, and impermeability to gas and liquids. By conducting dynamic mechanical analysis (DMA) testing, its flexibility and resilience properties can be gauged with a quantifiable method. These properties are characterized with Nanovea Mechanical Tester’s Nanoindentaion in the form of Young’s modulus, storage modulus, loss modulus, and tan delta (tan (δ)). Other data that can be gathered from DMA testing are phase shift, hardness, stress, and strain of the material.

Mechanical Properties of Silicon Carbide Wafer Coatings
Understanding the mechanical properties of silicon carbide wafer coatings is critical. The fabrication process for microelectronic devices can have over 300 different processing steps and can take anywhere from six to eight weeks. During this process, the wafer substrate must be able to withstand the extreme conditions of manufacturing, since a failure at any step would result in the loss of time and money. The testing of hardness, adhesion/scratch resistance and COF/wear rate of the wafer must meet certain requirements in order to survive the conditions imposed during the manufacturing and application process to insure a failure will not occur.
Micro Scrape Test Of Polymeric Coating
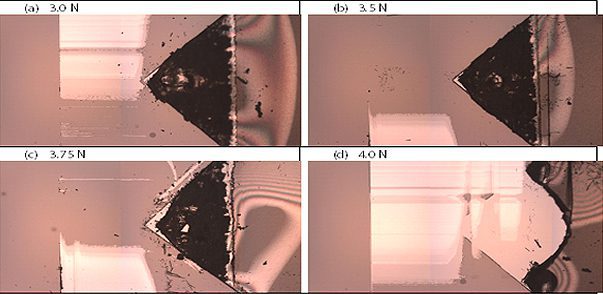
Scratch testing has developed to be one of the most widely applied methods to evaluate the cohesive and adhesive strength of the coatings. The critical load, at which a certain type of coating failure occurs as the applied load progressively increases, is widely regarded as a reliable tool to determine and compare the adhesive and cohesive properties of the coatings. The most commonly used indenter for scratch testing is the conical Rockwell diamond indenter. However, when the scratch test is performed on the soft polymeric coating deposited on a brittle substrate such as silicon wafer, the conical indenter tends to plough through the coating forming grooves rather than creating cracks or delamination. Cracking of the brittle silicon wafer takes place when the load further increases. Therefore, it is vital to develop a new technique to evaluate the cohesion or adhesion properties of soft coatings on a brittle substrate.

ASTM D7187 Temperature Effect Using Nanoscratching
ASTM D7187, the resistance of the paint to scratch and mar plays a vital role in its end use. Automotive paint susceptible to scratches makes it difficult and costly to maintain and repair. Different coating architectures of the primer, basecoat, and clearcoat have been developed to achieve the best scratch/mar resistance. Nanoscratch testing has been developed as a standard test method to measure the mechanistic aspects of scratch/mar behavior of paint coatings as described in ASTM D7187. Different elementary deformation mechanisms, namely elastic deformation, plastic deformation and fracture, occur at different loads during the scratch test. It provides a quantitative assessment of the plastic resistance and fracture resistance of the paint coatings.

Self Cleaning Glass Coating Friction Measurement
Self cleaning glass coating possesses a low surface energy that repels both water and oils. Such a coating creates an easy-clean and non-stick glass surface that protects it against grime, dirt and staining. The easy-clean coating substantially cuts the water and energy usage on glass cleaning. It does not require harsh and toxic chemical detergents, making it an eco-friendly choice for a wide variety of residential and commercial applications, such as mirrors, shower glasses, windows and windshields.
Cyclical Nanoindentation Stress-Strain Measurement
Importance of Nanoindentation
Continuous stiffness measurements (CSM) obtained by nanoindentation reveals the stress-strain relationship of materials with minimally invasive methods. Unlike traditional tensile testing methods, nanoindentation provides stress-strain data at the nanoscale without the need of a large instrument. The stress-strain curve provides crucial information on the threshold between elastic and plastic behavior as the sample is subject to increasing loads. CSM gives the capability to determine the yield stress of a material without dangerous equipment.
Nanoindentation provides a reliable and user-friendly method to quickly investigate stress-strain data. Furthermore, measuring stress-strain behavior on the nanoscale makes it possible to study important properties on small coatings and particles in materials as they get more advanced. Nanoindentation provides information on elastic limit and yield strength in addition to hardness, elastic modulus, creep, fracture toughness, etc. making it a versatile metrology instrument.
The stress-strain data provided by nanoindentation in this study identifies the elastic limit of the material while only going 1.2 microns into the surface. We use CSM to determine how mechanical properties of materials develop as an indenter travels deeper into the surface. This is especially useful in thin film applications where properties can be depth dependent. Nanoindentation is a minimally invasive method of confirming material properties in test samples.
The CSM test is useful in measuring material properties versus depth. Cyclical tests can be performed at constant loads to determine more complex material properties. This can be useful to study fatigue or eliminate the effect of porosity to obtain true elastic modulus.
Measurement Objective
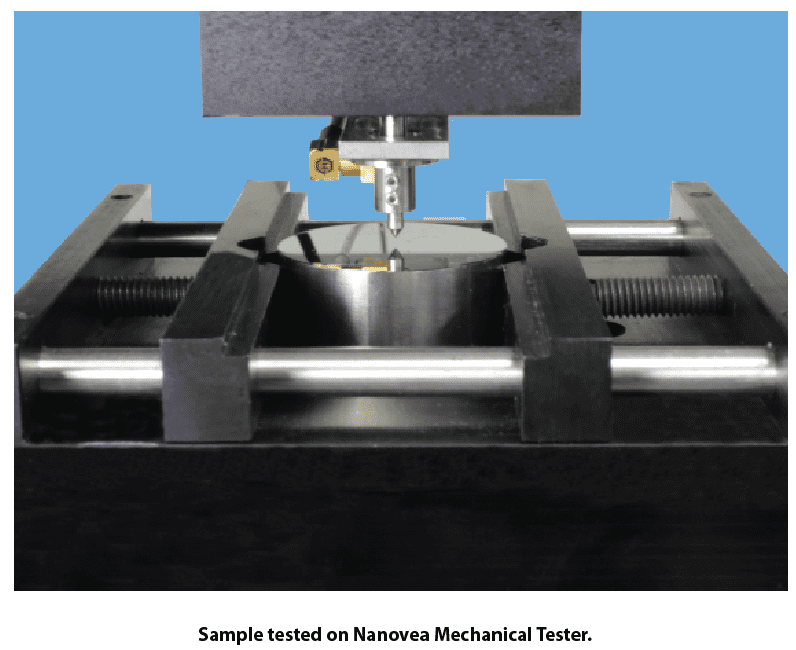
In this application, the Nanovea mechanical tester uses CSM to study hardness and elastic modulus versus depth and stress-strain data on a standard steel sample. Steel was chosen for its commonly recognized characteristics to display the control and accuracy of the nanoscale stress-strain data. A spherical tip with a 5-micron radius was used to reach high enough stresses beyond the elastic limit for steel.
Test Conditions & Procedures
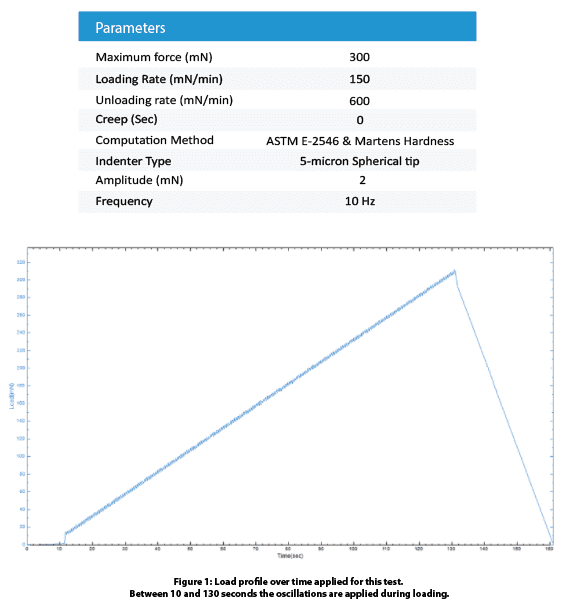
The following indentation parameters were used:
Results:
Increase in load during oscillations provide the following depth versus load curve. Over 100 oscillations were conducted during loading to find the stress-strain data as the indenter penetrates the material.
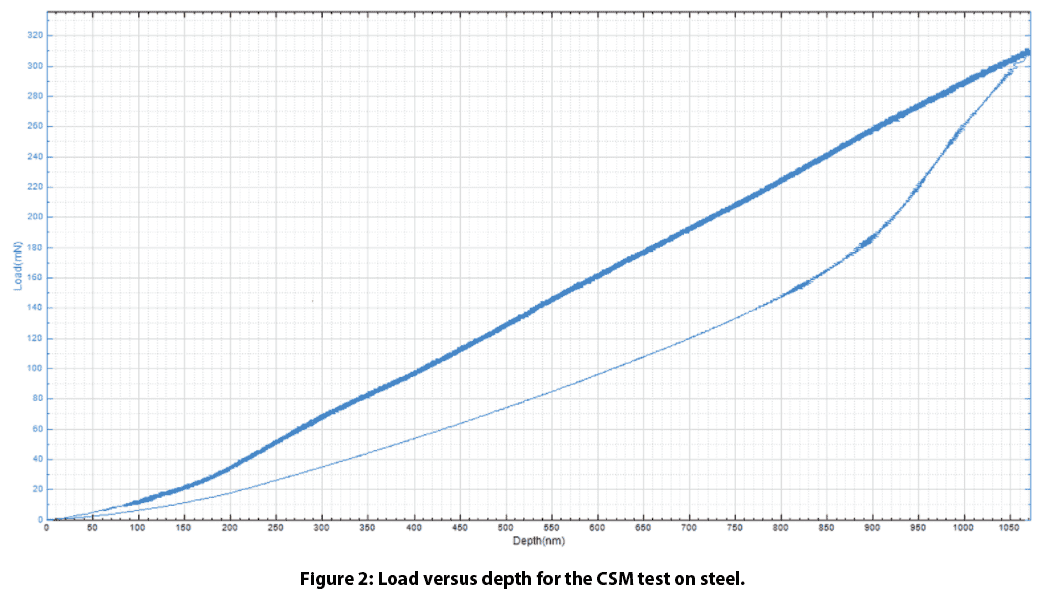
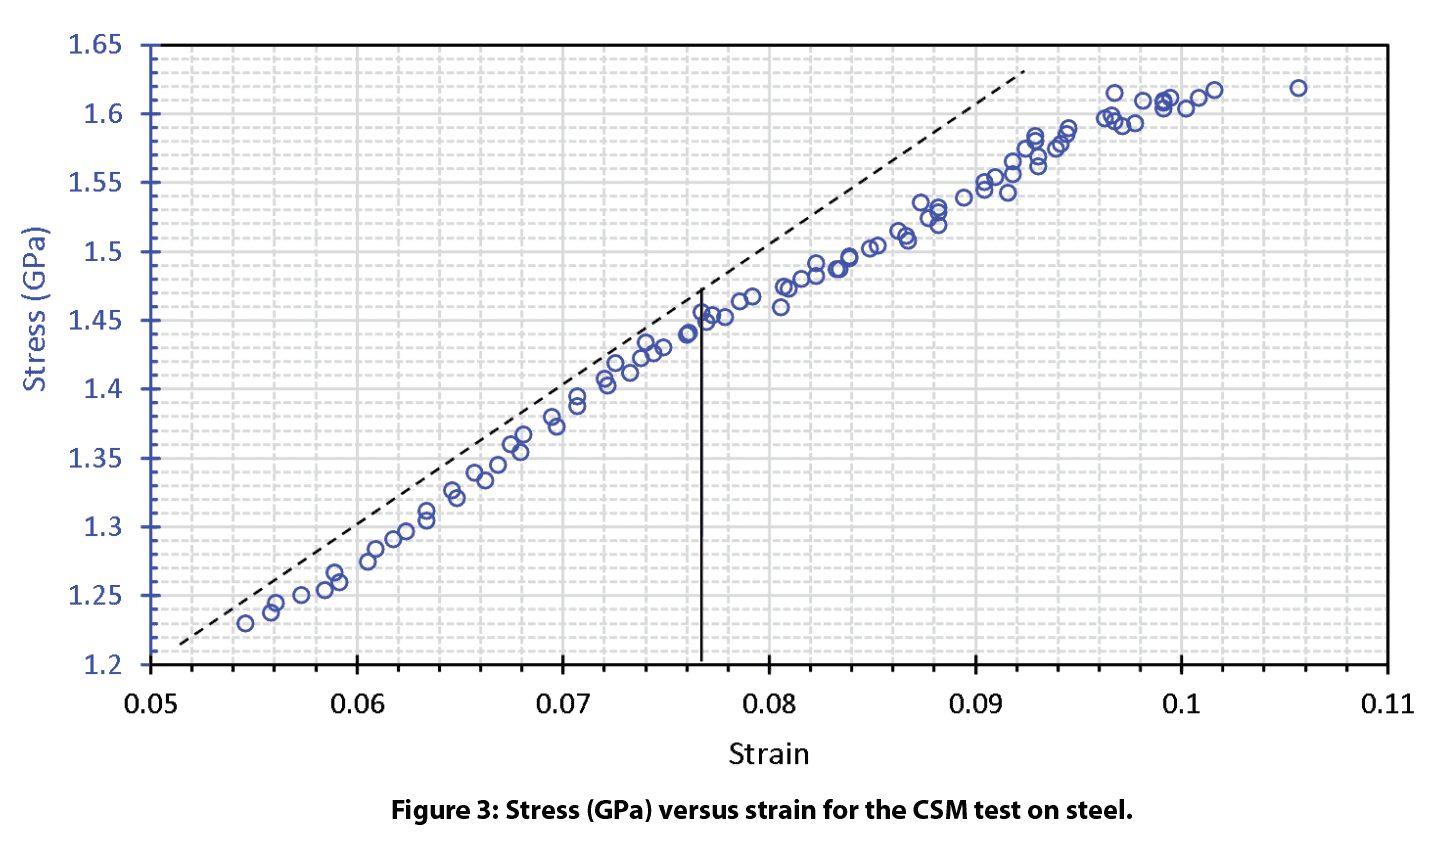
We determined stress and strain from the information obtained at each cycle. The maximum load and depth at each cycle allows us to calculate the maximum stress applied in each cycle to the material. Strain is calculated from the residual depth at each cycle from the partial unloading. This allows us to calculate the radius of the residual imprint by dividing the radius of the tip to give the strain factor. Plotting stress versus strain for the material shows the elastic and plastic zones with the corresponding elastic limit stress. Our tests determined the transition between the elastic and plastic zones of the material to be around 0.076 strain with an elastic limit of 1.45 GPa.
Each cycle acts as a single indent so as we increase load, we run tests at various controlled depths in the steel. So, hardness and elastic modulus versus depth can be plotted directly from the data obtained for each cycle.
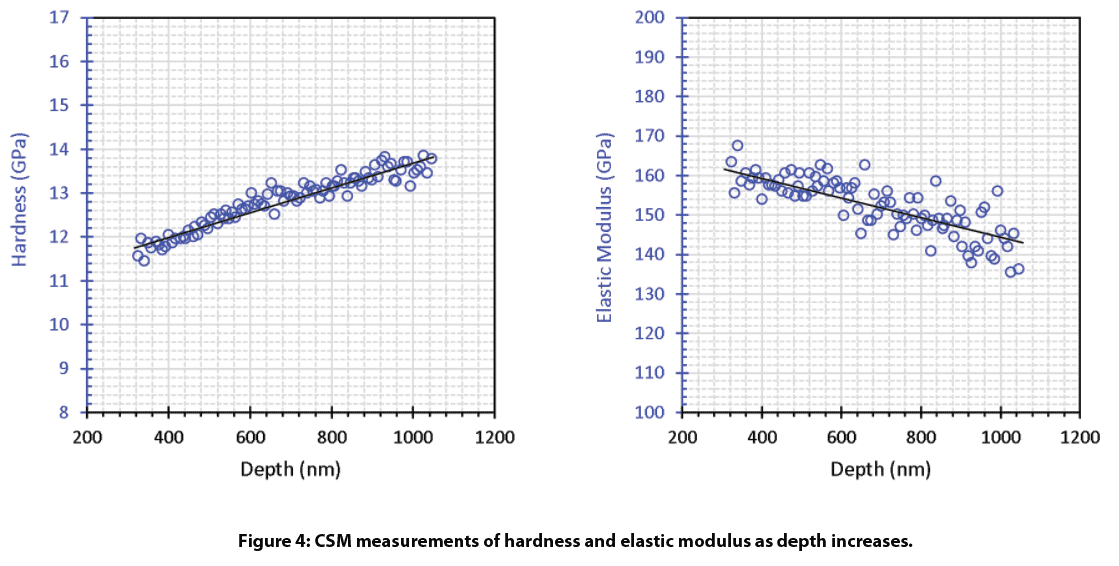
As the indenter travels into the material we see hardness increase and elastic modulus decrease.
Conclusion
We have shown the Nanovea mechanical tester provides reliable stress-strain data. Using a spherical tip with CSM indentation allows for material property measurement under increased stress. Load and indenter radius can be changed to test various materials at controlled depths. Nanovea mechanical testers provide these indentation tests from the sub mN range to 400N.