


INTRODUCTION
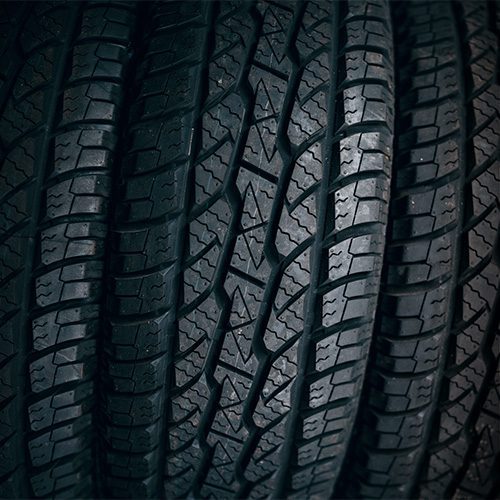
Self-cleaning glass coating creates an easy-clean glass surface that prevents buildup of grime, dirt and staining. Its self-cleaning feature significantly reduces the frequency, time, energy and cleaning costs, making it an attractive choice for a variety of residential and commercial applications, such as glass facade, mirrors, shower glasses, windows and windshields.
IMPORTANCE OF WEAR RESISTANCE OF SELF-CLEANING GLASS COATING
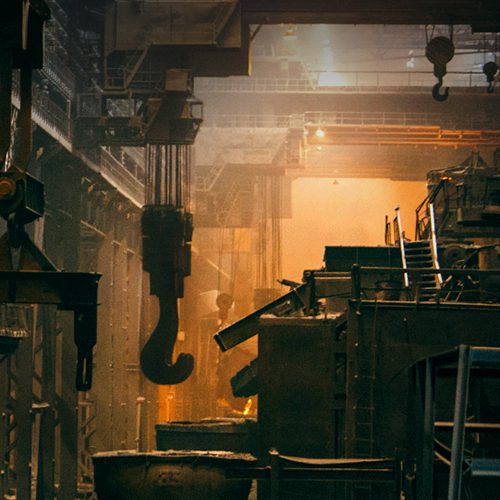
A major application of the self-cleaning coating is the exterior surface of the glass facade on skyscrapers. The glass surface is often attacked by high-speed particles carried by strong winds. The weather condition also plays a major role in the service lifetime of the glass coating. It can be very difficult and costly to surface treat the glass and apply the new coating when the old one fails. Therefore, the wear resistance of the glass coating under
different weather condition is critical.
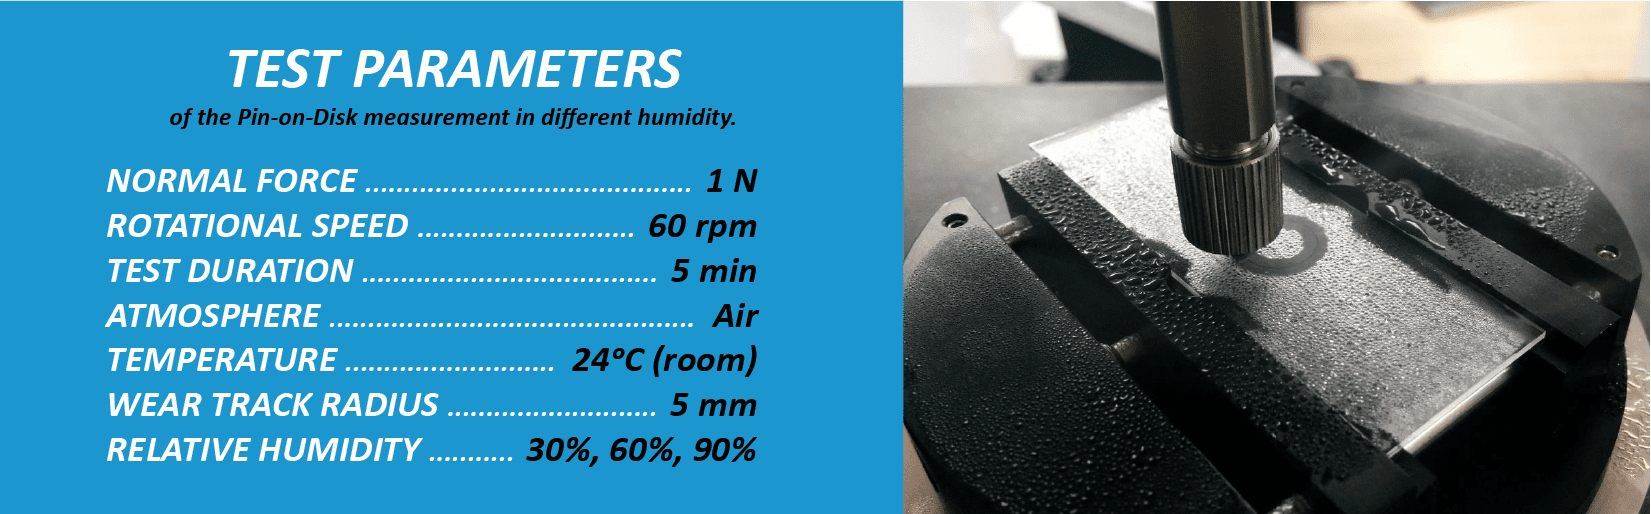
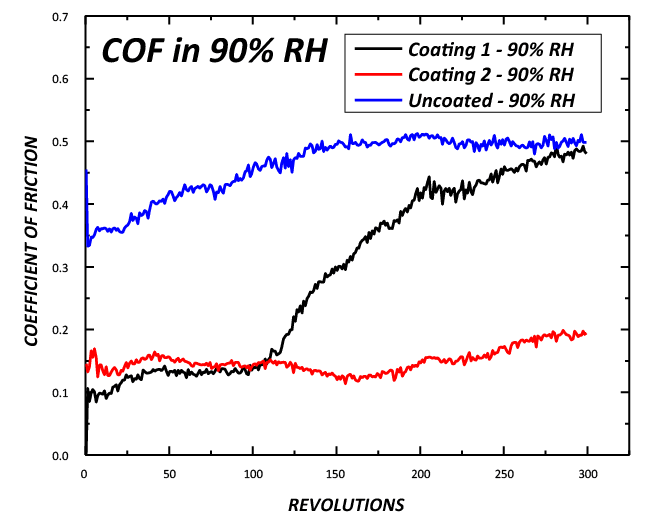
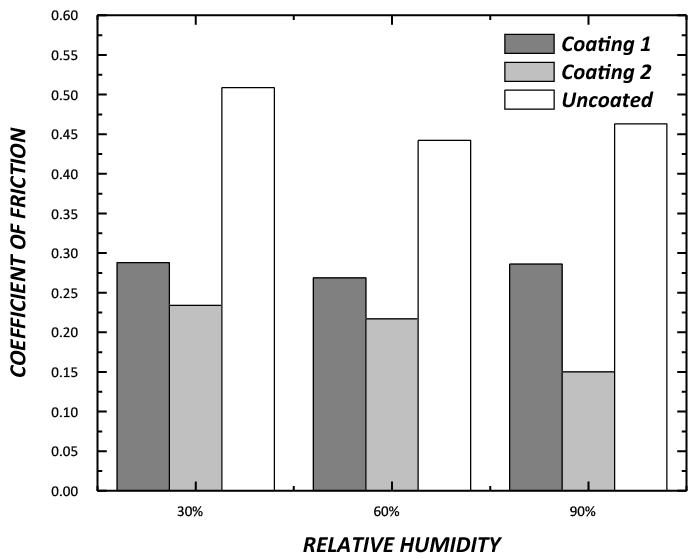
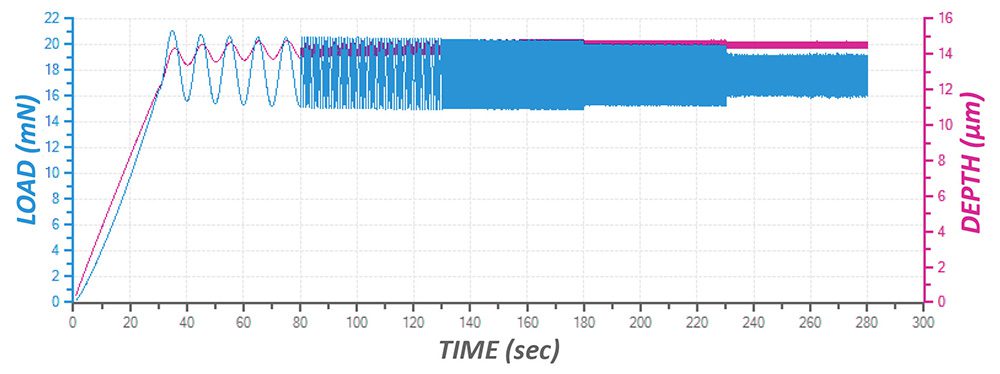
In order to simulate the realistic environmental conditions of the self-cleaning coating in different weather, repeatable wear evaluation in a controlled and monitored humidity is needed. It allows users to properly compare the wear resistance of the self-cleaning coatings exposed to different humidity and to select the best candidate for the targeted application.