Category: Laboratory Testing

Fretting Wear Evaluation


Pharmaceutical Tablets Surface Roughness Inspection


Microparticles: Compression Strength and Micro Indentation


Ball Bearings: High Force Wear Resistance Study
INTRODUCTION
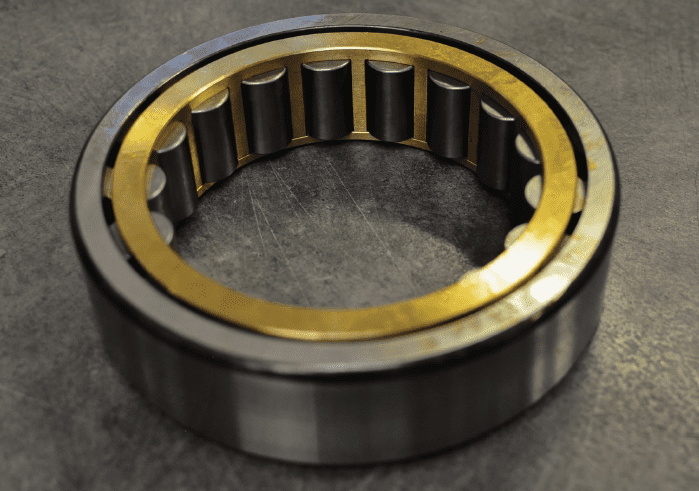
A ball bearing uses balls to reduce rotational friction and support radial and axial loads. The rolling balls between the bearing races produce much lower coefficient of friction (COF) compared to two flat surfaces sliding against each other. Ball bearings are often exposed to high contact stress levels, wear and extreme environmental conditions such as high temperatures. Therefore, wear resistance of the balls under high loads and extreme environmental conditions is critical for extending the lifetime of the ball bearing to cut down cost and time on repairs and replacements.
Ball bearings can be found in nearly all applications that involve moving parts. They are commonly used in transportation industries such as aerospace and automobile as well as the toy industry that manufactures items such as fidget spinner and skateboards.
BALL BEARING WEAR EVALUATION AT HIGH LOADS
Ball bearings can be made from an extensive list of materials. Commonly used materials range between metals like stainless steel and chrome steel or ceramics such as tungsten carbide (WC) and silicon nitride (Si3n4). To ensure that the manufactured ball bearings possess the required wear resistance ideal for the given application’s conditions, reliable tribological evaluations under high loads are necessary. Tribological testing aids in quantifying and contrasting the wear behaviors of different ball bearings in a controlled and monitored manner to select the best candidate for the targeted application.
MEASUREMENT OBJECTIVE
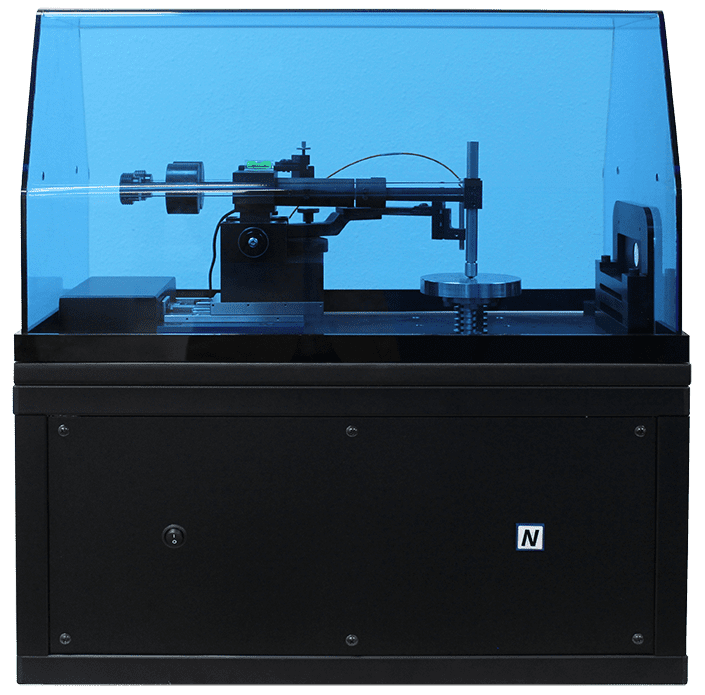
In this study, we showcase a Nanovea Tribometer as the ideal tool for comparing the wear resistance of different ball bearings under high loads.

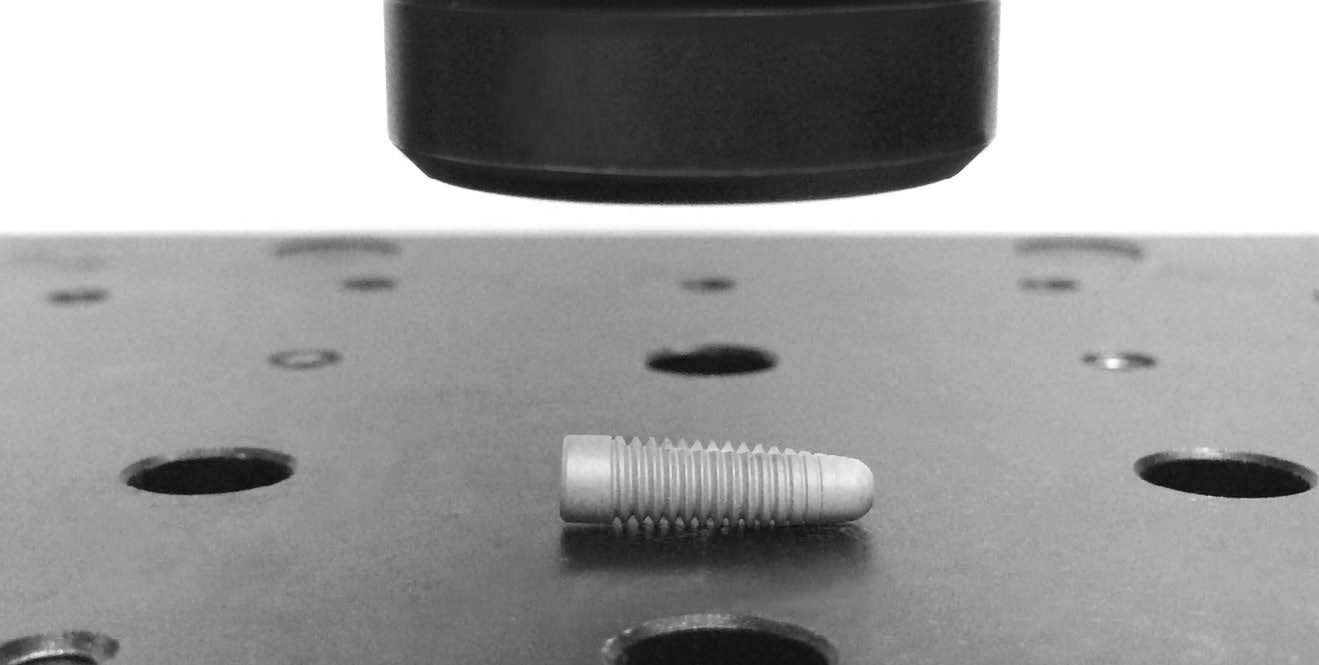
Figure 1: Setup of the bearing test.
TESTING PROCEDURE
The coefficient of friction, COF, and the wear resistance of the ball bearings made of different materials were evaluated by a Nanovea Tribometer. P100 grit sandpaper was used as the counter material. The wear scars of the ball bearings were examined using a Nanovea 3D Non-Contact Profiler after the wear tests concluded. The test parameters are summarized in Table 1. The wear rate, K, was evaluated using the formula K=V/(F×s), where V is the worn volume, F is the normal load and s is the sliding distance. Ball wear scars were evaluated by a Nanovea 3D Non-Contact Profiler to ensure precise wear volume measurement.
The automated motorized radial positioning feature allows the tribometer to decrease the radius of the wear track for the duration of a test. This test mode is called a spiral test and it ensures that the ball bearing always slides on a new surface of the sandpaper (Figure 2). It significantly improves the repeatability of the wear resistance test on the ball. The advanced 20bit encoder for internal speed control and 16bit encoder for external position control provide precise real-time speed and position information, allowing for a continuous adjustment of rotational speed to achieve constant linear sliding speed at the contact.
Please note that P100 Grit sandpaper was used to simplify the wear behavior between various ball materials in this study and can be substituted with any other material surface. Any solid material can be substituted to simulate the performance of a wide range of material couplings under actual application conditions, such as in liquid or lubricant.
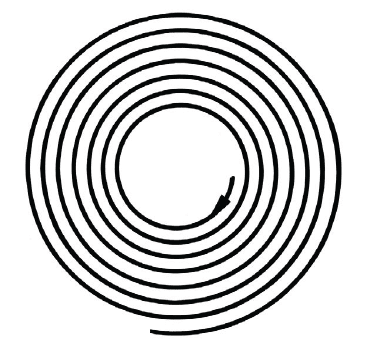
Figure 2: Illustration of the spiral passes for the ball bearing on the sandpaper.
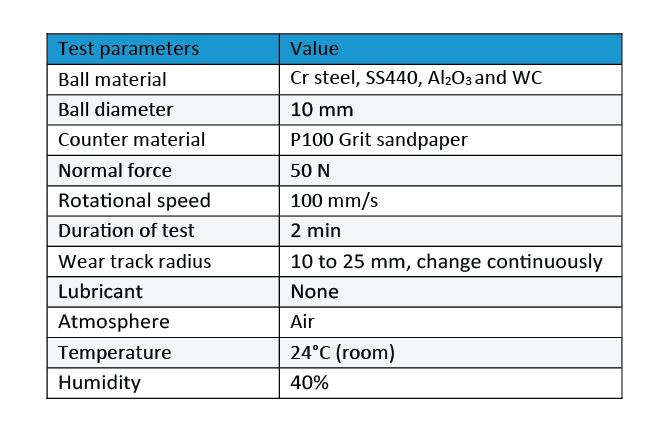
Table 1: Test parameters of the wear measurements.
RESULTS & DISCUSSION
Wear rate is a vital factor for determining the service lifetime of the ball bearing, while a low COF is desirable to improve the bearing performance and efficiency. Figure 3 compares the evolution of COF for different ball bearings against the sandpaper during the tests. The Cr Steel ball shows an increased COF of ~0.4 during the wear test, compared to ~0.32 and ~0.28 for SS440 and Al2O3 ball bearings. On the other hand, the WC ball exhibits a constant COF of ~0.2 throughout the wear test. Observable COF variation can be seen throughout each test which is attributed to vibrations caused by the sliding movement of the ball bearings against the rough sandpaper surface.

Figure 3: Evolution of COF during the wear tests.
Figure 4 and Figure 5 compare the wear scars of the ball bearings after they were measured by an optical microscope and Nanovea Non-Contact optical profiler, respectively, and Table 2 summarizes the results of the wear track analysis. The Nanovea 3D profiler precisely determines the wear volume of the ball bearings, making it possible to calculate and compare the wear rates of different ball bearings. It can be observed that the Cr Steel and SS440 balls exhibit much larger flattened wear scars compared to the ceramic balls, i.e. Al2O3 and WC after the wear tests. The Cr Steel and SS440 balls have comparable wear rates of 3.7×10⁻³ and 3.2×10⁻³ m3/N m, respectively. In comparison, the Al2O3 ball shows an enhanced wear resistance with a wear rate of 7.2×10⁻⁴ m3/N m. The WC ball barely exhibits minor scratches on the shallow wear track area, resulting in a significantly reduced wear rate of 3.3×10⁻⁶ mm3/N m.
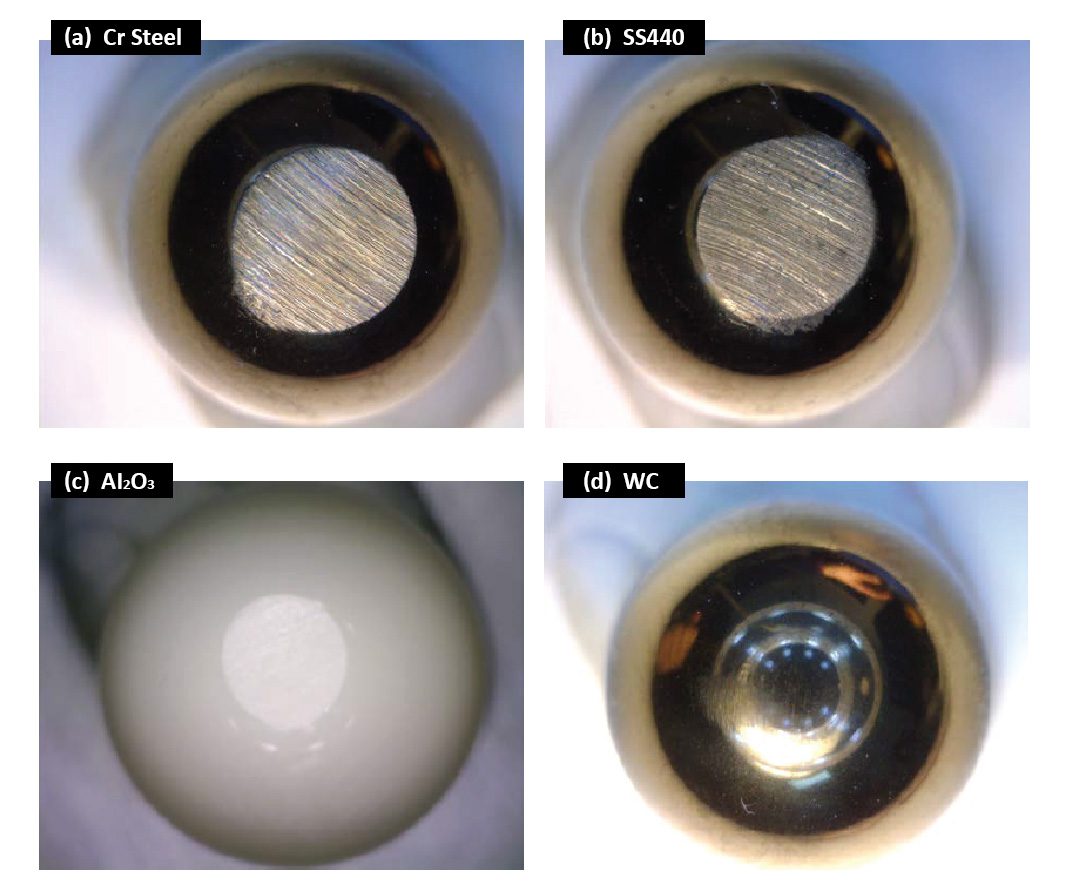
Figure 4: Wear scars of the ball bearings after the tests.
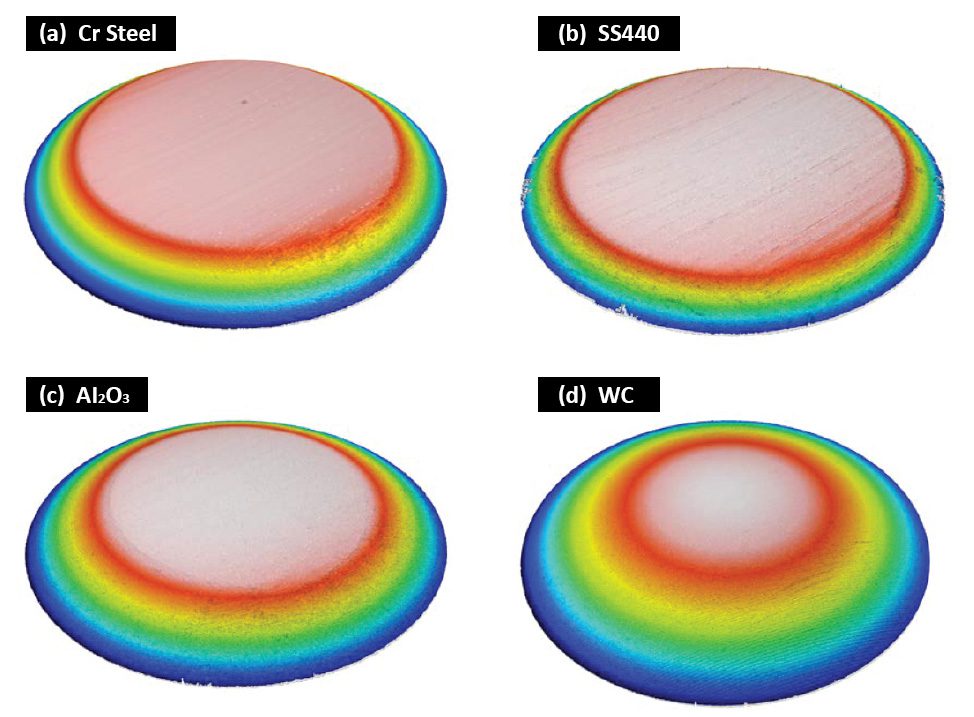
Figure 5: 3D morphology of the wear scars on the ball bearings.
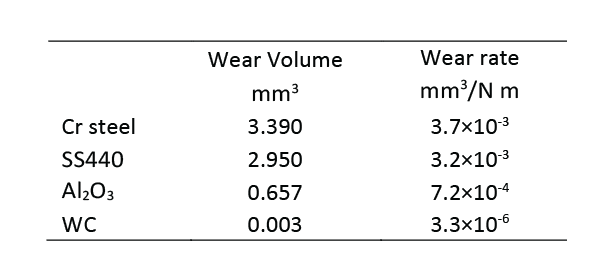
Table 2: Wear scar analysis of the ball bearings.
Figure 6 shows microscope images of the wear tracks produced on the sand paper by the four ball bearings. It is evident that the WC ball produced the most severe wear track (removing almost all sand particle in its path) and possesses the best wear resistance. In comparison, the Cr Steel and SS440 balls left a large amount of metal debris on the wear track of the sand paper.
These observations further demonstrate the importance of the benefit of a spiral test. It ensures that the ball bearing always slides on a new surface of the sandpaper, which significantly improves the repeatability of a wear resistance test.

Figure 6: Wear tracks on the sand paper against different ball bearings.

CONCLUSION
The wear resistance of the ball bearings under a high pressure plays a vital role in their service performance. The ceramic ball bearings possess significantly enhanced wear resistance under high stress conditions and reduce the time and cost due to bearing repairing or replacement. In this study, the WC ball bearing exhibits a substantially higher wear resistance compared to the steel bearings, making it an ideal candidate for bearing applications where severe wear takes place.
A Nanovea Tribometer is designed with high torque capabilities for loads up to 2000 N and precise and controlled motor for rotational speeds from 0.01 to 15,000 rpm. It offers repeatable wear and friction testing using ISO and ASTM compliant rotative and linear modes, with optional high temperature wear and lubrication modules available in one pre-integrated system. This unmatched range allows users to simulate different severe work environments of the ball bearings including high stress, wear and high temperature, etc. It also acts as an ideal tool to quantitatively assess the tribological behaviors of superior wear resistant materials under high loads.
A Nanovea 3D Non-Contact Profiler provides precise wear volume measurements and acts as a tool to analyze the detailed morphology of the wear tracks, providing additional insights in the fundamental understanding of wear mechanisms.
Prepared by
Duanjie Li, PhD, Jonathan Thomas, and Pierre Leroux
Dental Tools: Dimensional and Surface Roughness Analysis
INTRODUCTION
Having precise dimensions and optimal surface roughness are vital to the functionality of dental screws. Many dental screw dimensions require high precision such as radii, angles, distances, and step heights. Understanding local surface roughness is also highly important for any medical tool or part being inserted inside the human body to minimize sliding friction.
NON-CONTACT PROFILOMETRY FOR DIMENSIONAL STUDY
Nanovea 3D Non-Contact Profilers use a chromatic light-based technology to measure any material surface: transparent, opaque, specular, diffusive, polished or rough. Unlike a touch probe technique, the non-contact technique can measure inside tight areas and will not add any intrinsic errors due to deformation caused by the tip pressing on a softer plastic material. Chromatic light-based technology also offers superior lateral and height accuracies compared to focus variation technology. Nanovea Profilers can scan large surfaces directly without stitching and profile the length of a part in a few seconds. Nano through macro range surface features and high surface angles can be measured due to the profiler’s ability to measure surfaces without any complex algorithms manipulating the results.
MEASUREMENT OBJECTIVE
In this application, the Nanovea ST400 Optical Profiler was used to measure a dental screw along flat and thread features in a single measurement. The surface roughness was calculated from the flat area, and various dimensions of the threaded features were determined.
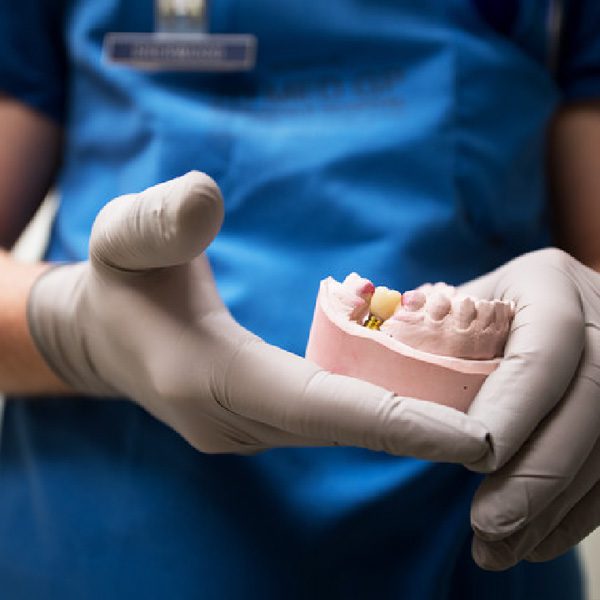
Sample of dental screw analyzed by NANOVEA Optical Profiler.
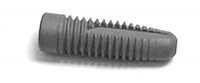
Dental screw sample analyzed.
RESULTS
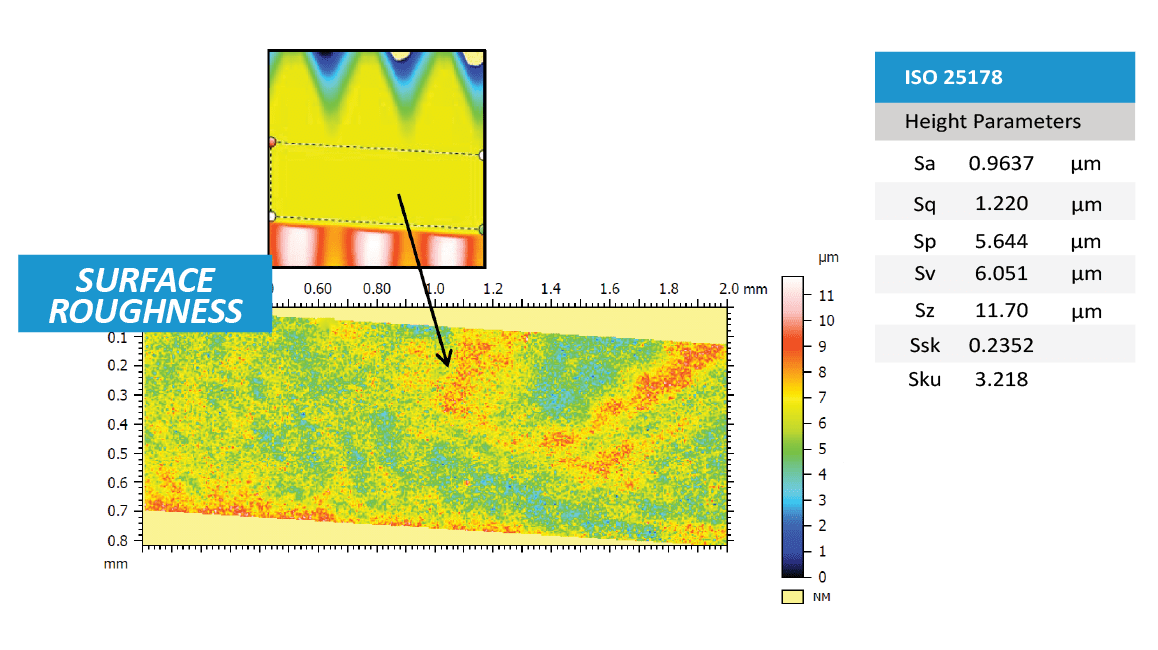
3D Surface
The 3D View and False Color View of the dental screw shows a flat area with threading starting on either side. It provides users a straightforward tool to directly observe the morphology of the screw from different angles. The flat area was extracted from the full scan to measure its surface roughness.


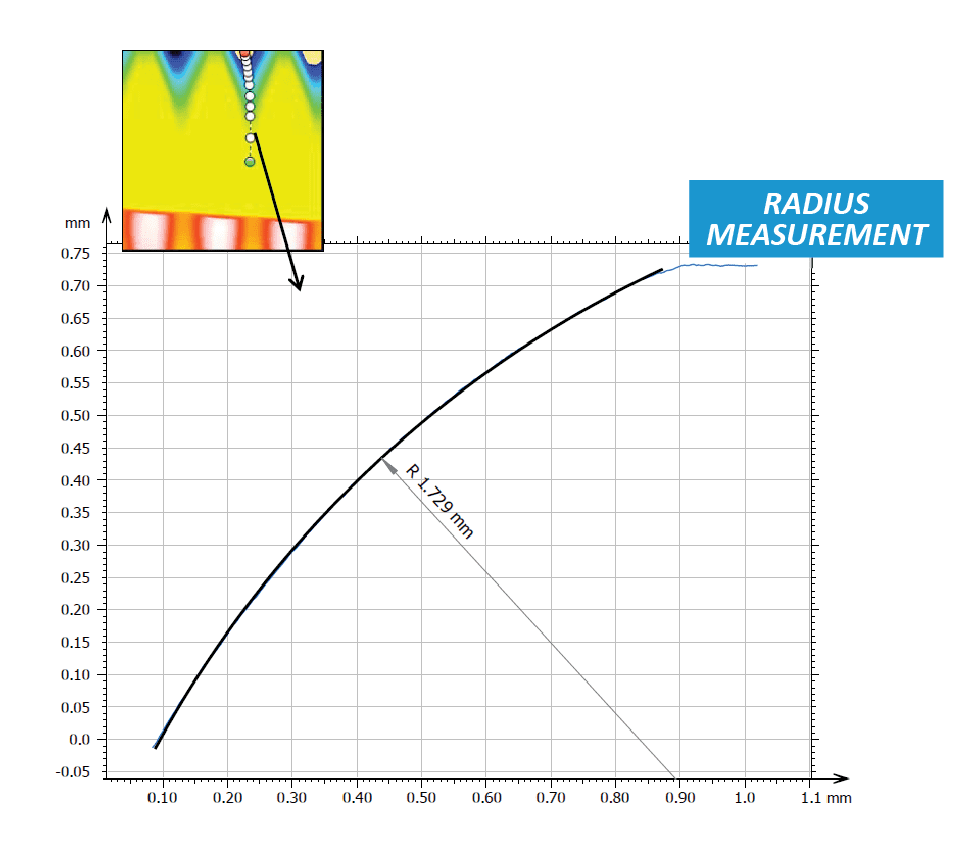
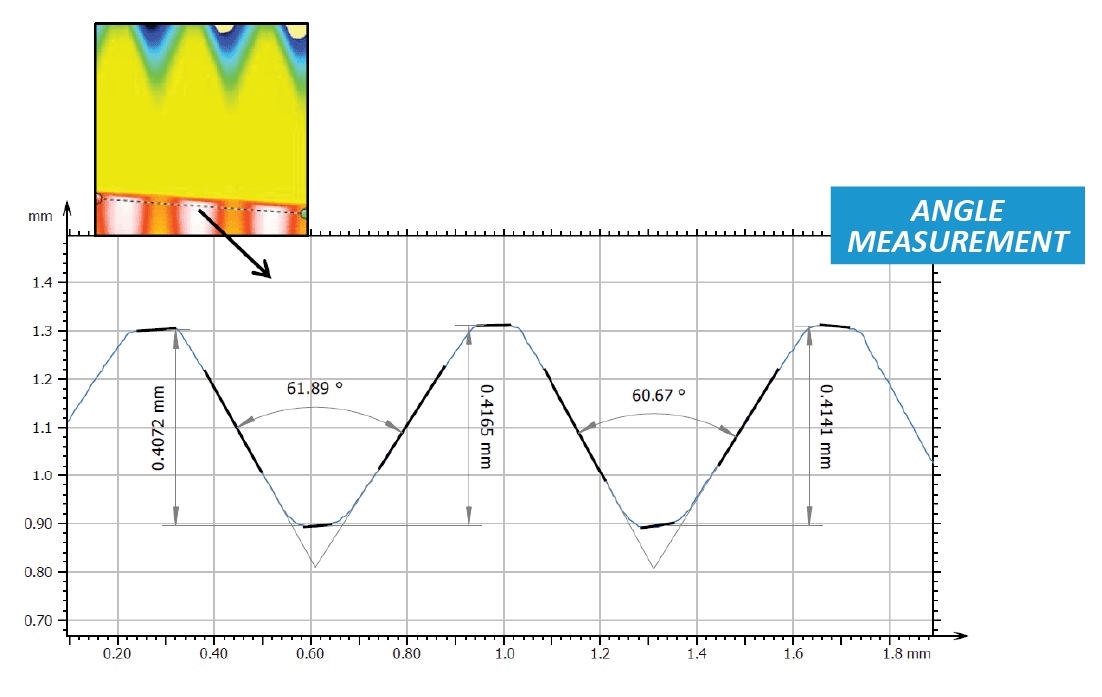
2D Surface Analysis
Line profiles can also be extracted from the surface to show a cross-sectional view of the screw. The Contour Analysis and step height studies were used to measure precise dimensions at a certain location on the screw.


CONCLUSION
In this application, we have showcase the Nanovea 3D Non-Contact Profiler’s ability to precisely calculate local surface roughness and measure large dimensional features in a single scan.
The data shows a local surface roughness of 0.9637 μm. The radius of the screw between threads was found to be 1.729 mm, and the threads had an average height of 0.413 mm. The average angle between the threads was determined to be 61.3°.
The data shown here represents only a portion of the calculations available in the analysis software.
Prepared by
Duanjie Li, PhD., Jonathan Thomas, and Pierre Leroux

Ceramics: Nanoindentation Fast Mapping for Grain Detection
INTRODUCTION
Nanoindentation has become a widely applied technique for measuring mechanical behaviors of materials at small scalesi ii. The high-resolution load-displacement curves from a nanoindentation measurement can provide a variety of physicomechanical properties, including hardness, Young’s modulus, creeping, fracture toughness and many others.
Importance of Fast Mapping Indentation
One significant bottleneck for further popularization of the nanoindentation technique is time consumption. A mechanical property mapping by conventional nanoindentation procedure can easily take hours which hinders the application of the technique in mass production industries, such as semiconductor, aerospace, MEMS, consumer products such as ceramic tiles and many others.
Fast mapping can prove to be essential in the ceramic tile manufacturing industry, Hardness and Young’s modulus mappings across a single ceramic tile can present a distribution of data that indicates how homogeneous the surface is. Softer regions on a tile can be outlined in this mapping and show locations more prone to failure from physical impacts that happen on a day to day basis in someone’s residence. Mappings can be made on different types of tiles for comparative studies and on a batch of similar tiles to measure tile consistency in a quality control processes. The combination of measurements setups can be extensive as well as accurate and efficient with the fast mapping method.
MEASUREMENT OBJECTIVE
In this study, the Nanovea Mechanical Tester, in FastMap mode is used to map the mechanical property of a floor tile at high speeds. We showcase the capacity of the Nanovea Mechanical Tester in performing two fast nanoindentation mappings with high precision and reproducibility.
Test Conditions
The Nanovea Mechanical Tester was used to perform a series of nanoindentations with the FastMap Mode on a floor tile using a Berkovich indenter. The test parameters are summarized below for the two indent matrices created.
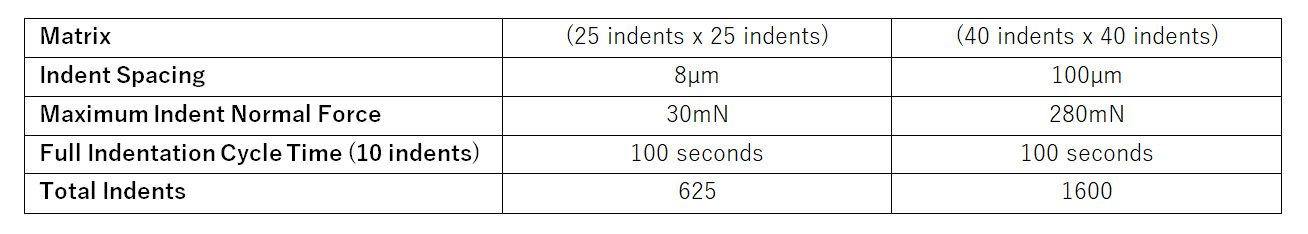
Table 1: Test parameter summary.
RESULTS & DISCUSSION
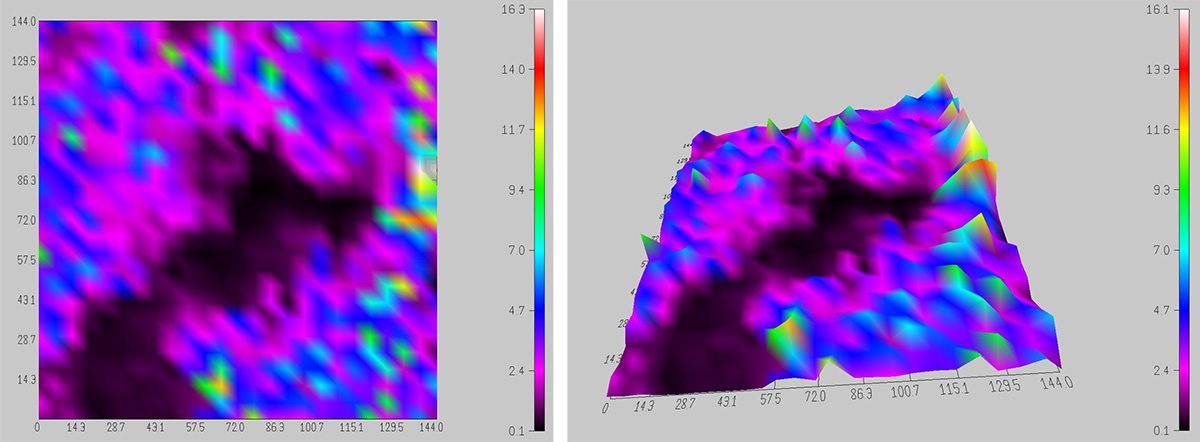
Figure 1: 2D and 3D view of 625-indent hardness mapping.
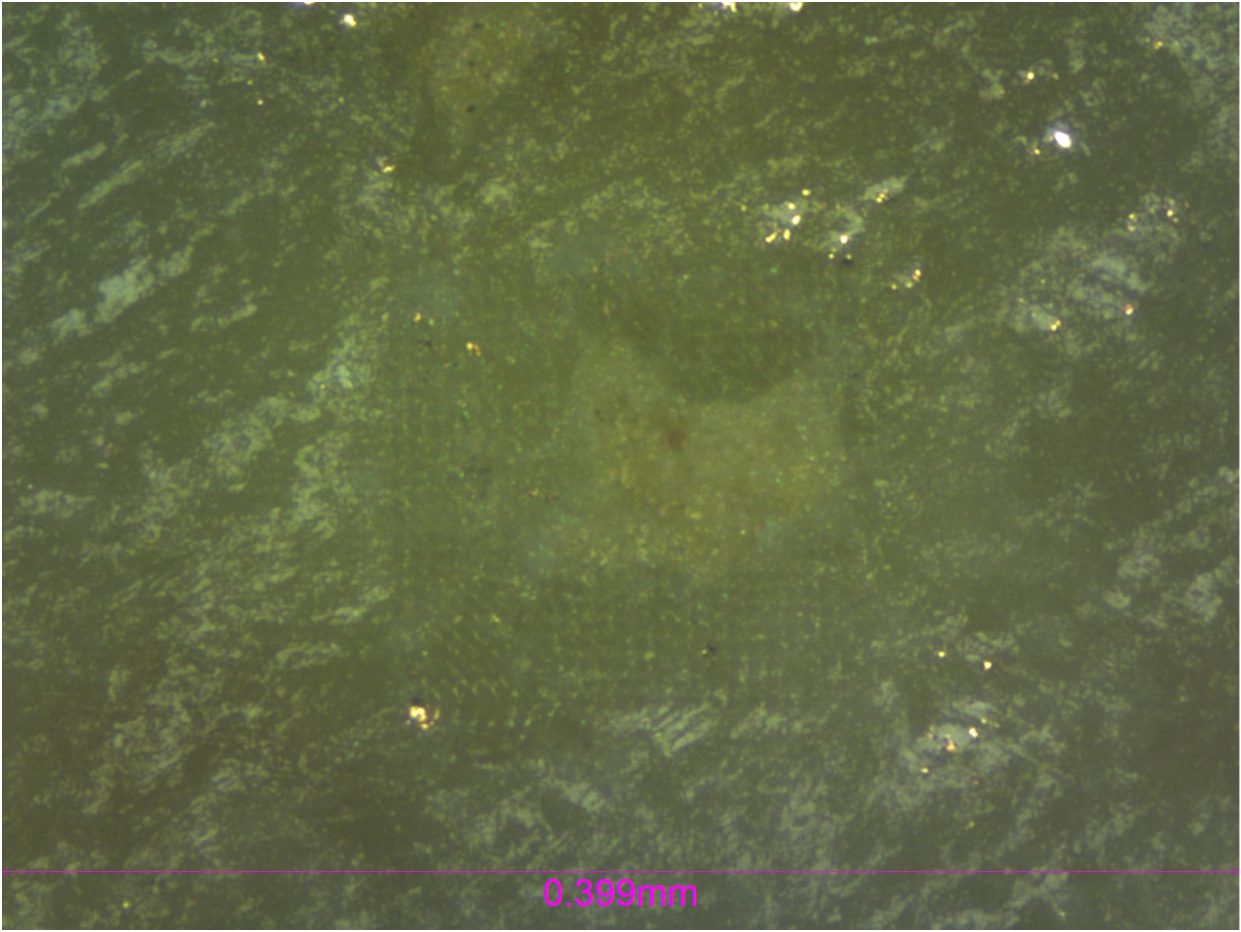
Figure 2: Micrograph of 625-indent matrix showcasing grain.
A 625-indent matrix was conducted on a 0.20mm2 area with a large visible grain present. This grain (Figure 2) had an average hardness lower than the overall surface of the tile. The Nanovea Mechanical Software allows the user to see the hardness distribution map in 2D and 3D mode which are depicted in Figure 1. Using the high-precision position control of the sample stage, the software allows users to target areas such as these for in depth mechanical properties mapping.
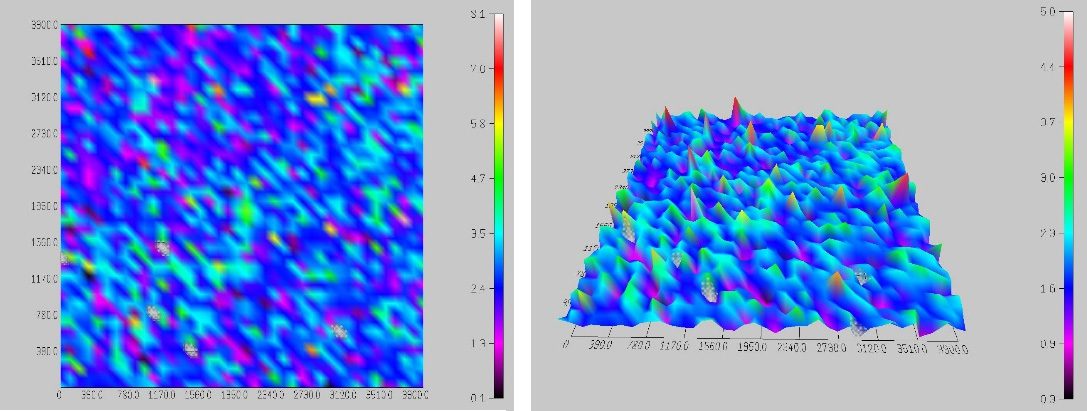
Figure 3: 2D and 3D view of 1600-indent hardness mapping.
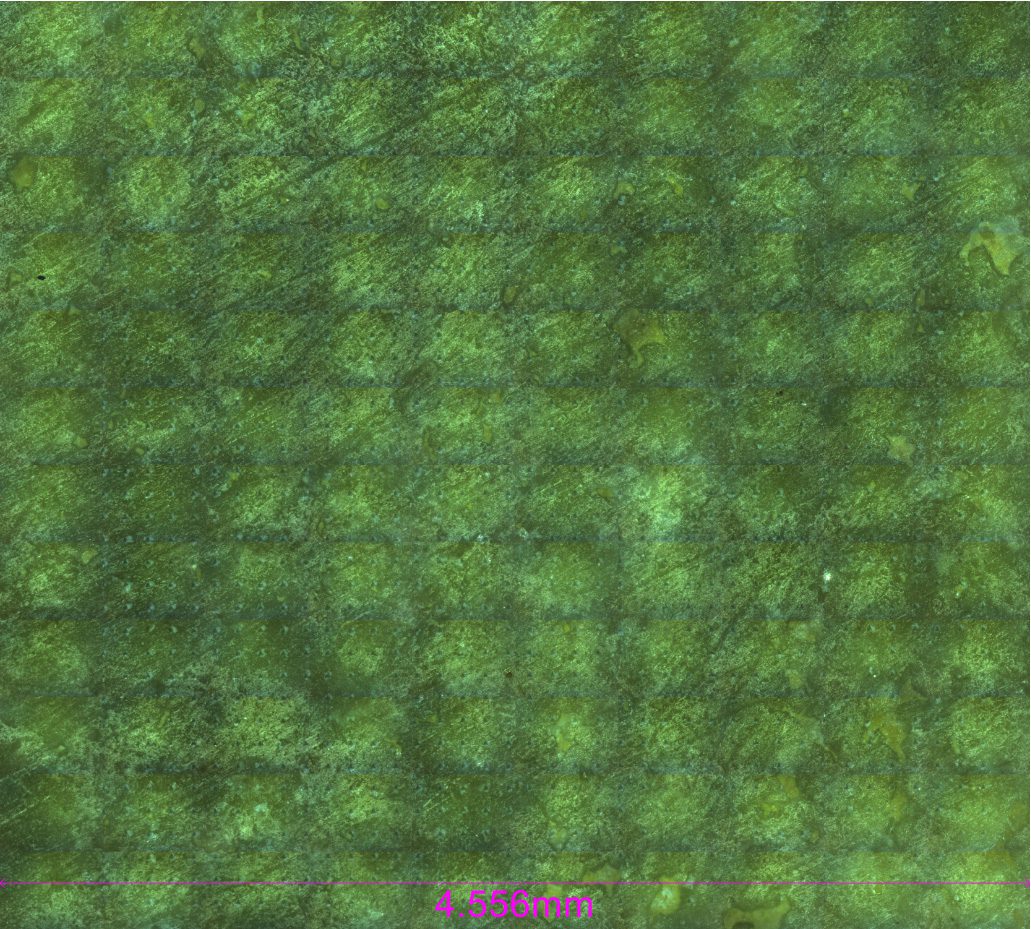
Figure 4: Micrograph of 1600-indent matrix.
A 1600-indent matrix was also created on the same tile to measure the homogeneity of the surface. Here again the user has the ability to see the hardness distribution in 3D or 2D mode (Figure 3) as well as the microscope image of the indented surface. Based on the hardness distribution presented, it can be concluded that the material is porous due to the even scattering of high and low hardness data points.
Compared to conventional nanoindentation procedures, FastMap mode in this study is substantially less time-consuming and more cost-effective. It enables speedy quantitative mapping of mechanical properties including Hardness and Young’s Modulus and provides a solution for grain detection and material consistency which is critical for quality control of a variety of materials in mass production.

CONCLUSION
In this study, we showcased the capacity of the Nanovea Mechanical Tester in performing speedy and precise nanoindentation mapping using FastMap mode. The mechanical property maps on the ceramic tile utilize the position control (with 0.2µm accuracy) of the stages and force module sensitivity to detect surface grains and measure homogeneity of a surface at high speed.
The test parameters used in this study were determined based on the size of the matrix and sample material. A variety of test parameters can be chosen to optimize the total indentation cycle time to 3 seconds per indent (or 30 seconds for every 10 indentations).
The Nano and Micro modules of the Nanovea Mechanical Tester all include ISO and ASTM compliant indentation, scratch and wear tester modes, providing the widest and most user-friendly range of testing available in a single system. Nanovea’s unmatched range is an ideal solution for determining the full range of mechanical properties of thin or thick, soft or hard coatings, films and substrates, including hardness, Young’s Modulus, fracture toughness, adhesion, wear resistance and many others.
In addition, optional 3D non-contact profiler and AFM Module are available for high resolution 3D imaging of indentation, scratch and wear track in addition to other surface measurements such as roughness.
Author: Duanjie Li, PhD Revised by Pierre Leroux & Jocelyn Esparza

Improve Mining Procedures With Microindendation
MICROINDENTATION RESEARCH AND QUALITY CONTROL
Rock mechanics is the study of the mechanical behavior of rock masses and is applied in mining, drilling, reservoir production, and civil construction industries. Advanced instrumentation with precise measurement of mechanical properties allows for part and procedure improvement within these industries. Successful quality control procedures are ensured by understanding rock mechanics at the micro scale.
Microindentation is a crucial tool used for rock mechanics related studies. These techniques advance excavation techniques by providing further understanding of rock mass properties. Microindentation is used to improve drill heads which improve mining procedures. Microindentation has been used to study chalk and powder formation from minerals. Microindentation studies can include hardness, Young’s modulus, creep, stress-strain, fracture toughness, and compression with a single instrument.
MEASUREMENT OBJECTIVE
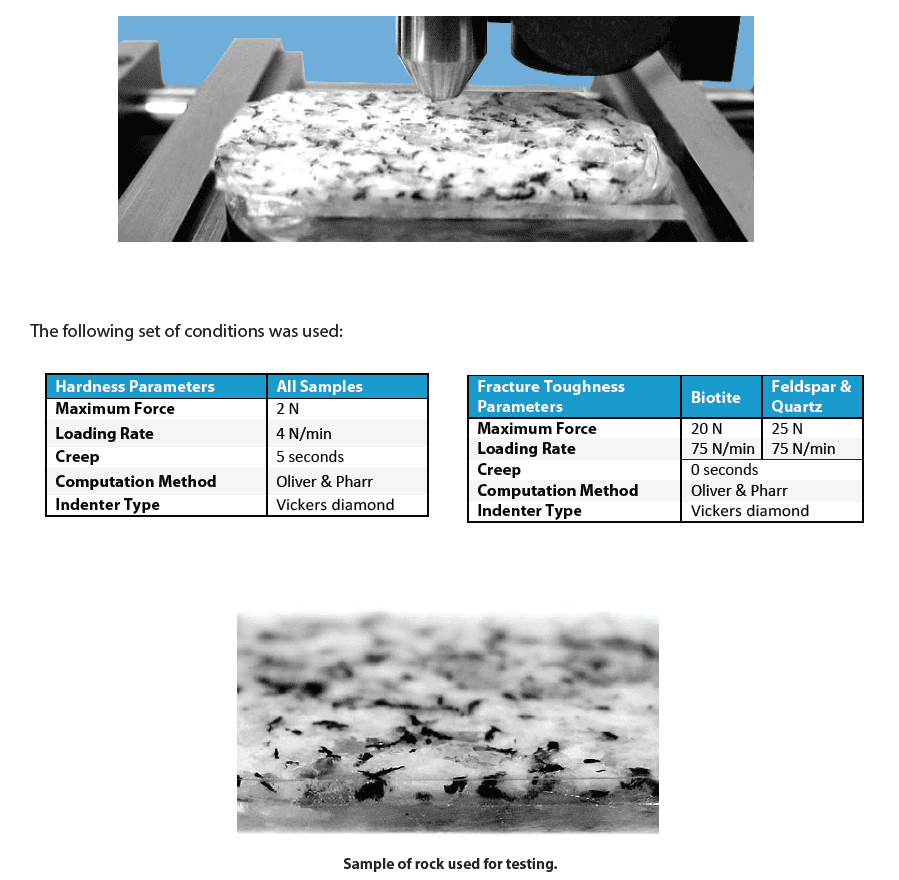
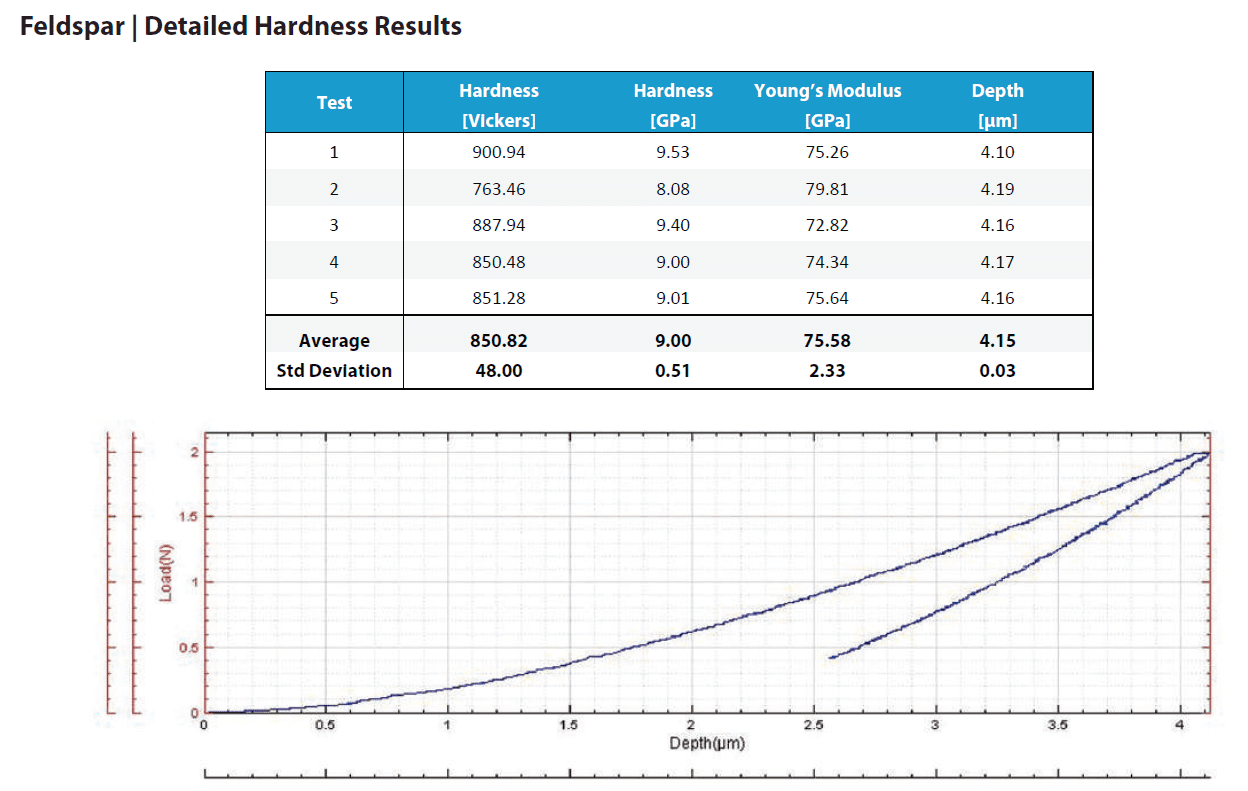
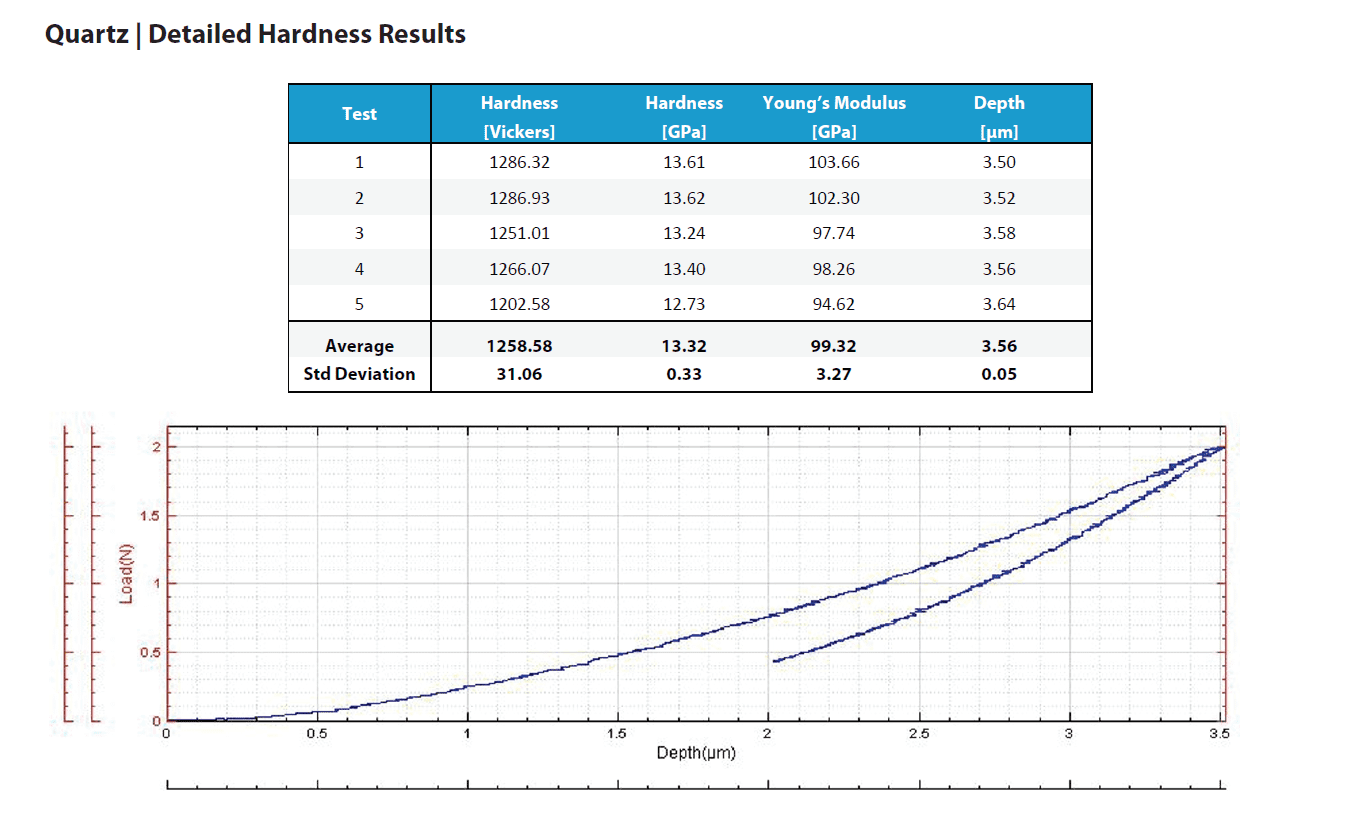
In this application the Nanovea mechanical tester measures the Vickers hardness (Hv), Young’s modulus, and fracture toughness of a mineral rock sample. The rock is made up of biotite, feldspar and quartz which form the standard granite composite. Each is tested separately.
RESULTS AND DISCUSSION
This section includes a summary table that compares the main numerical results for the different samples, followed by the full result listings, including each indentation performed, accompanied by micrographs of the indentation, when available. These full results present the measured values of Hardness and Young’s modulus as the penetration depth (Δd) with their averages and standard deviations. It should be considered that large variation in the results can occur in the case that the surface roughness is in the same size range as the indentation.
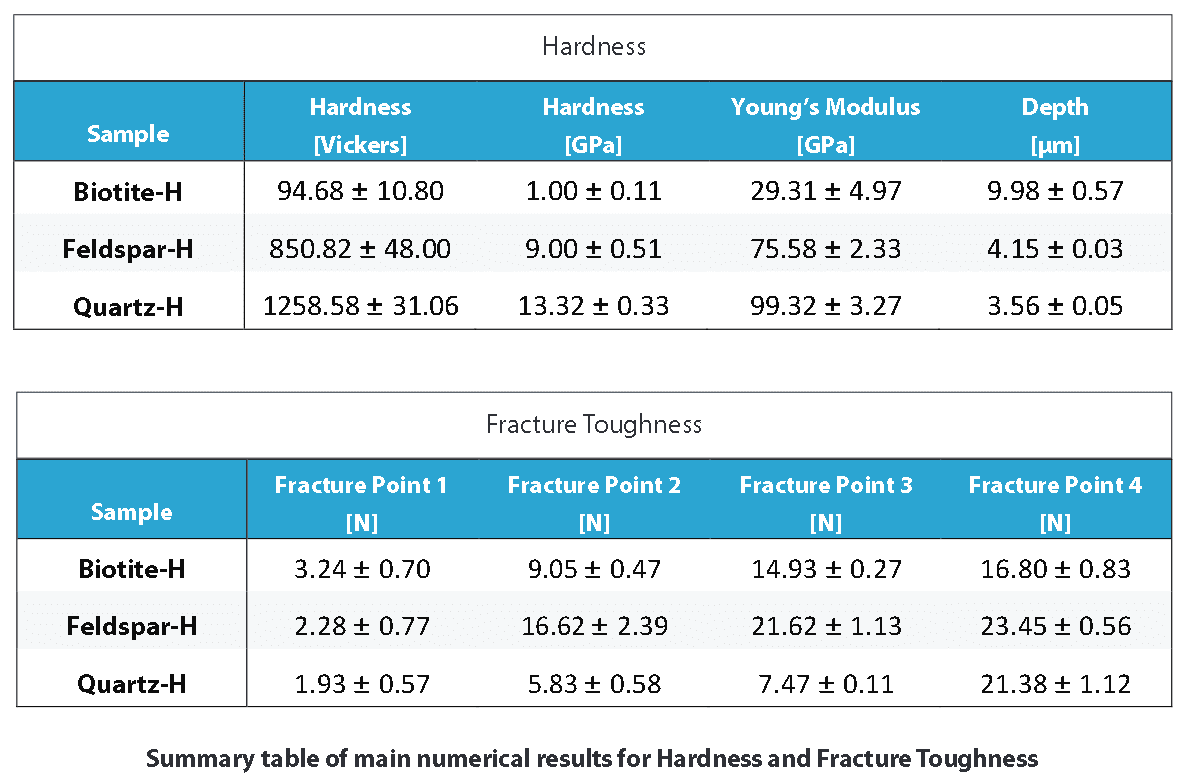
Summary table of main numerical results for Hardness and Fracture Toughness

CONCLUSION
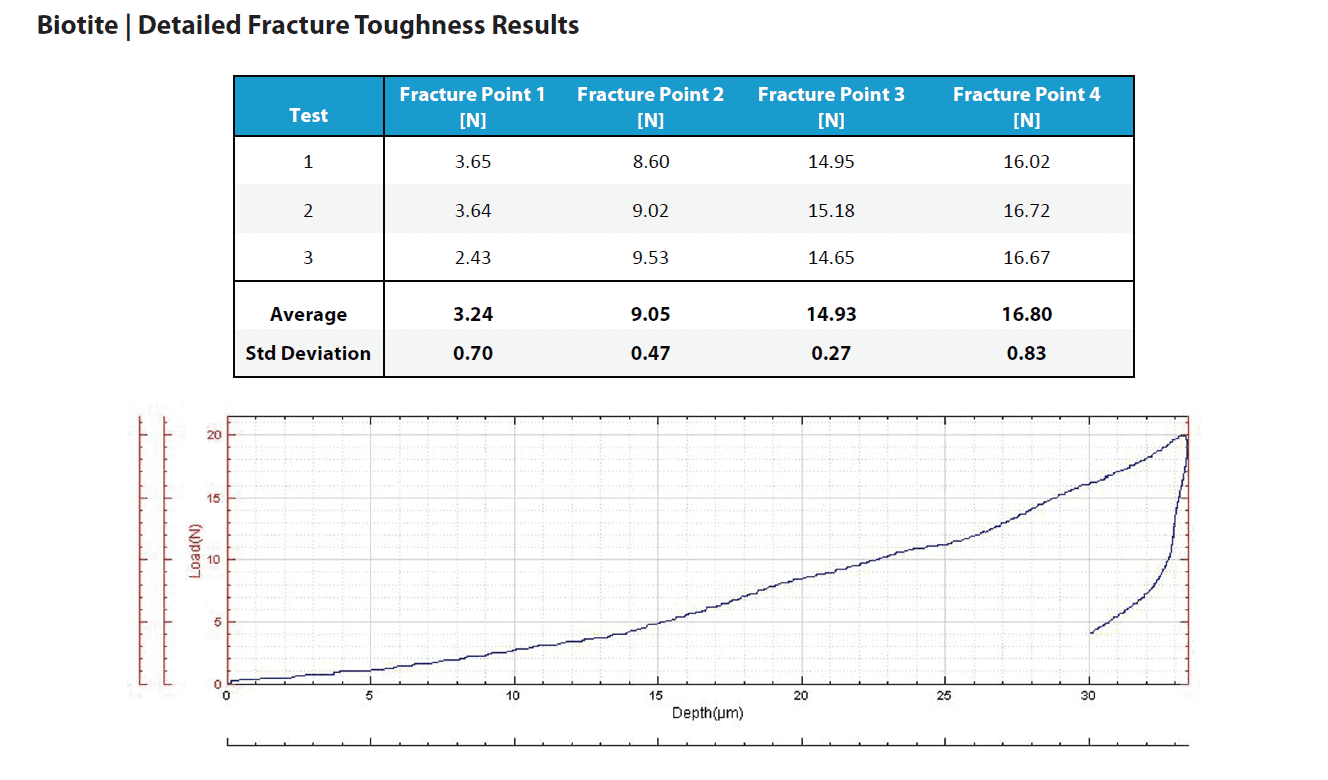
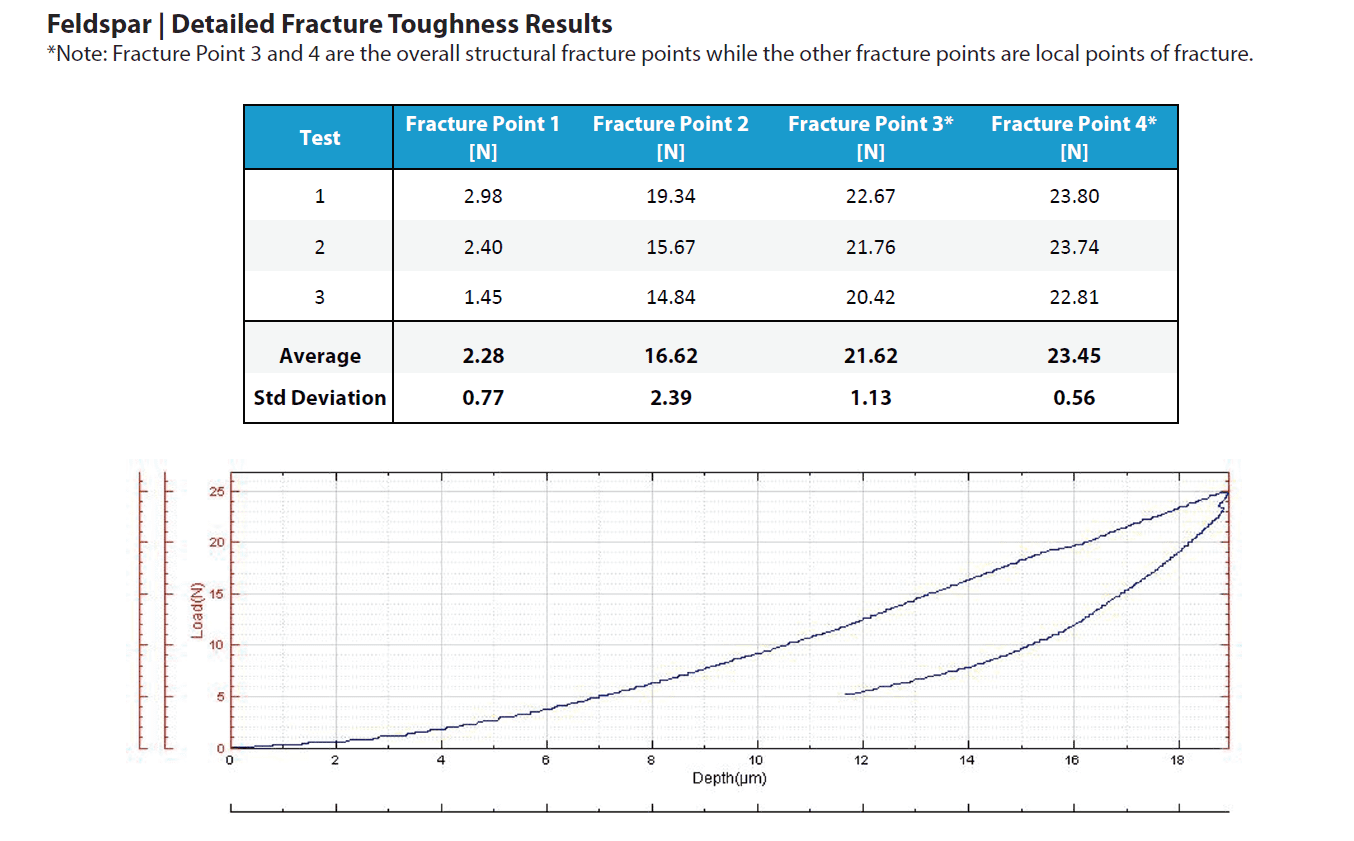
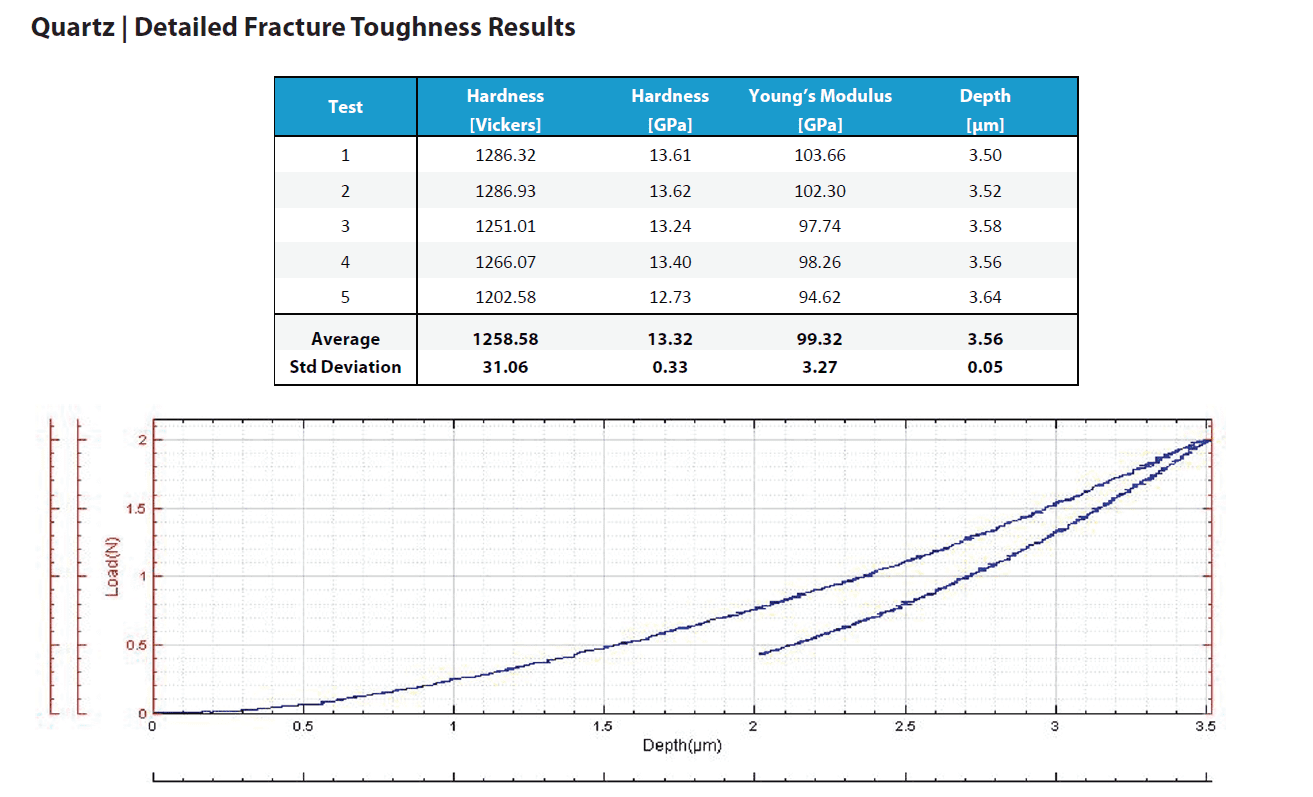
The Nanovea mechanical tester demonstrates reproducibility and precise indentation results on the hard surface of mineral rock. Hardness and Young’s modulus of each material forming the granite was measured directly from depth versus load curves. The rough surface meant testing at higher loads that may have caused micro cracking. Micro cracking would explain some of the variations seen in measurements. Cracks were not perceivable through standard microscopy observation because of a rough sample surface. Therefore, it is not possible to calculate traditional fracture toughness numbers that requires cracks length measurements. Instead, we used the system to detect initiation of cracks through the dislocations in the depth versus load curves while increasing loads.
Fracture threshold loads were reported at loads where failures occurred. Unlike traditional fracture toughness tests that simply measure crack length, a load is obtained at which threshold fracture starts. Additionally, the controlled and closely monitored environment allows the measurement of hardness to use as a quantitative value for comparing a variety of samples.
In-line Roughness Inspection
Surface defects derive from materials processing and product manufacturing. In-line surface quality inspection ensures the tightest quality control of the end products. The Nanovea 3D Non-Contact Profilometers utilize chromatic confocal technology with a unique capability to determine the roughness of a sample with-out contact. Multiple profiler sensors can be installed to monitor the roughness and texture of different areas of the product at the same time. The roughness threshold calculated in real-time by the analysis software serves as a fast and reliable pass/fail tool.
MEASUREMENT OBJECTIVE
In this study, the Nanovea roughness inspection conveyor system equipped with a point sensor is used to inspect the surface roughness of the acrylic and sandpaper samples. We showcase the capacity of Nanovea non-contact profilometer in providing fast and reliable in-line roughness inspection in a production line in real-time.

RESULTS AND DISCUSSION
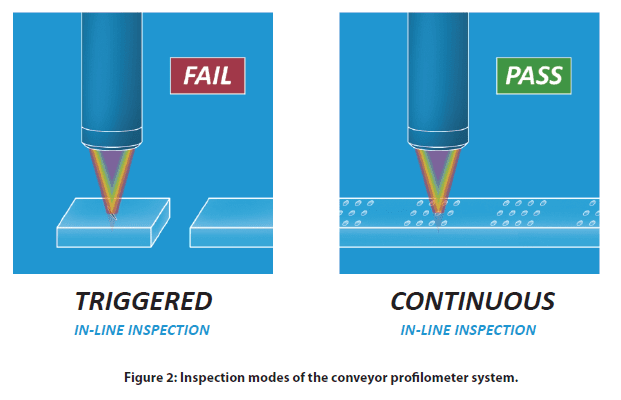
The conveyor profilometer system can operate in two modes, namely Trigger Mode and Continuous Mode. As illustrated in Figure 2, the surface roughness of the samples are measured when they are passing under the optical profiler heads under the Trigger Mode. In comparison, Continuous Mode provides non-stop measurement of the surface roughness on the continuous sample, such as metal sheet and fabric. Multiple optical profiler sensors can be installed to monitor and record the roughness of different sample areas.
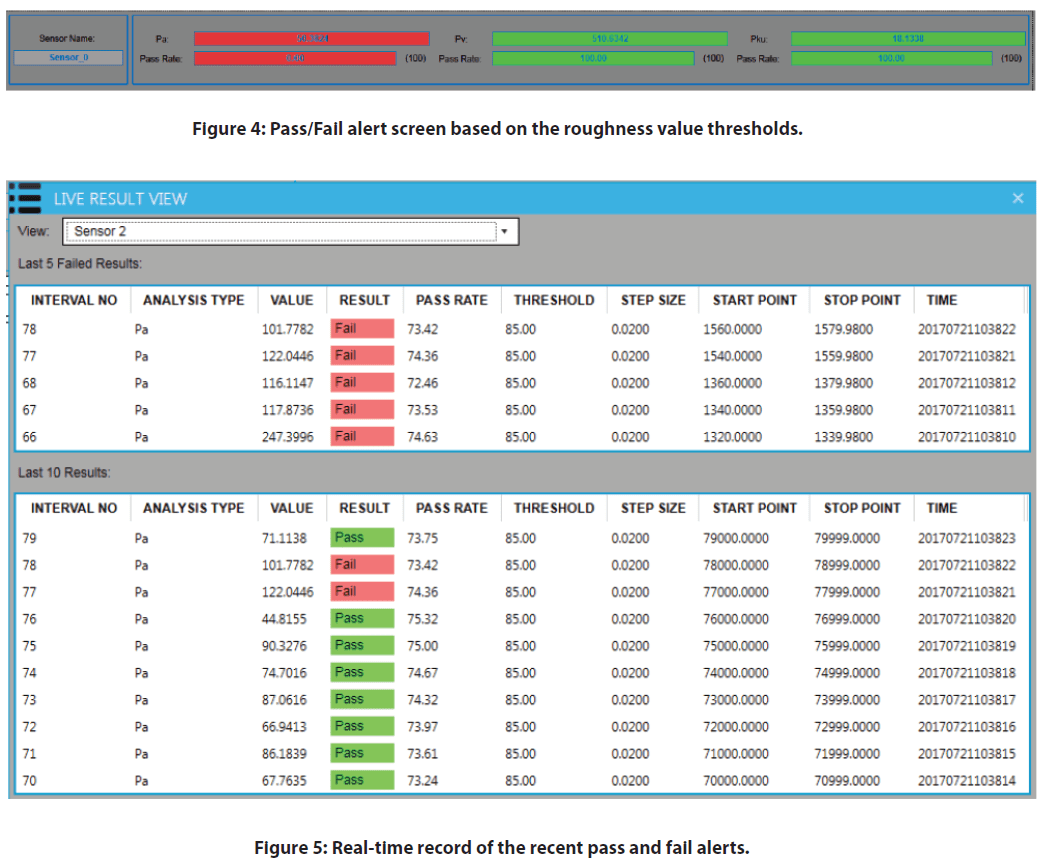
During the real-time roughness inspection measurement, the pass and fail alerts are displayed on the software windows as shown in Figure 4 and Figure 5. When the roughness value is within the given thresholds, the measured roughness is highlighted in green color. However, the highlight turns red when the measured surface roughness is out of the range of the set threshold values. This provides a tool for the user to determine the quality of a product’s surface finish.
In the following sections, two types of samples, e.g. Acrylic and Sandpaper are used to demonstrate the Trigger and Continuous Modes of the Inspection system.


Trigger Mode: Surface inspection of the Acrylic Sample
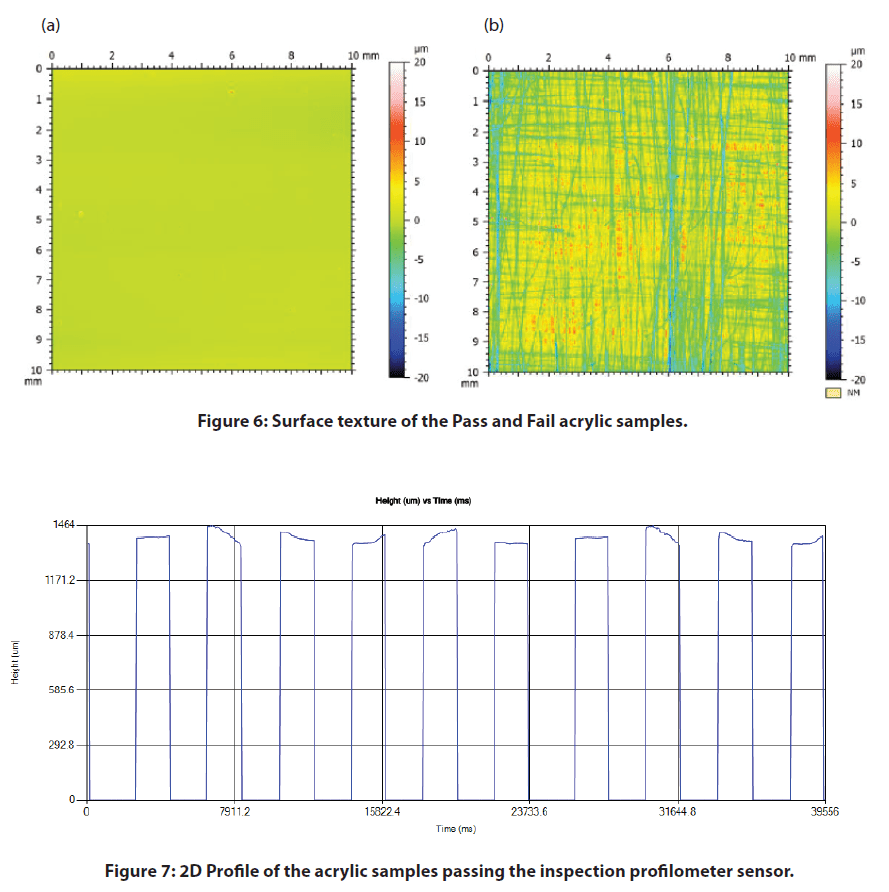
A series of Acrylic samples are aligned on the conveyor belt and move under the optical profiler head as shown in Figure 1. The false color view in Figure 6 shows the change of the surface height. Some of the mirror-like finished Acrylic samples had been sanded to create a rough surface texture as shown in Figure 6b.
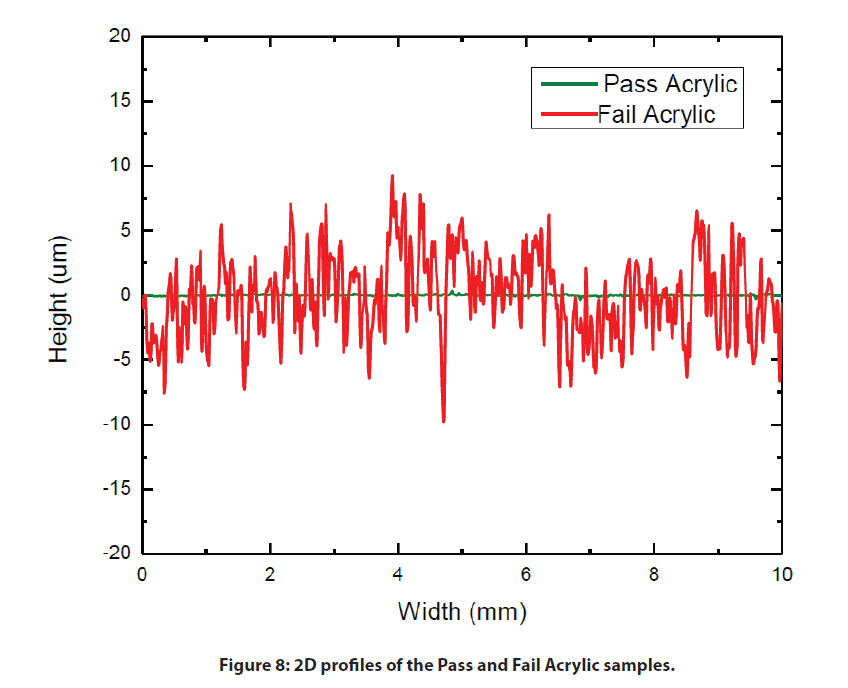
As the Acrylic samples move at a constant speed under the optical profiler head, the surface profile is measured as shown in Figure 7 and Figure 8. The roughness value of the measured profile is calculated at the same time and compared to the threshold values. The red fail alert is launched when the roughness value is over the set threshold, allowing users to immediately detect and locate the defective product on the production line.
Continuous Mode: Surface Inspection of the sandpaper sample
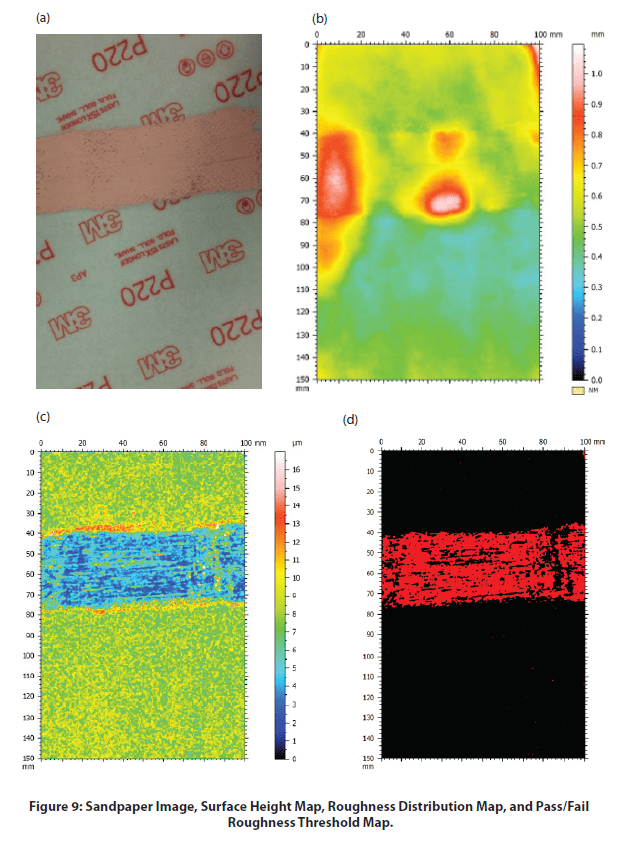
Surface Height Map, Roughness Distribution Map, and Pass / Fail Roughness Threshold Map of the sandpaper sample surface as shown in Figure 9. The sandpaper sample has a couple of higher peaks in the used part as shown in the surface height map. The different colors in the pallet of Figure 9C represent the roughness value of the local surface. The Roughness Map exhibits a homogeneous roughness in the intact area of the sandpaper sample, while the used area is highlighted in dark blue color, indicating the reduced roughness value in this region. A Pass/Fail roughness threshold can be set up to locate such regions as shown in Figure 9D.
As the sandpaper continuously passes under the in-line profiler sensor, the real-time local roughness value is calculated and recorded as plotted in Figure 10. The pass/fail alerts are displayed on the software screen based on the set roughness threshold values, serving as a fast and reliable tool for quality control. The product surface quality in the production line is inspected in situ to discover defective areas in time.

CONCLUSION
In this application, we have shown the Nanovea Conveyor Profilometer equipped with an optical non-contact profiler sensor works as a reliable in-line quality control tool effectively and efficiently.
The inspection system can be installed in the production line to monitor the surface quality of the products in situ. The roughness threshold works as a dependable criteria to determine the surface quality of the products, allowing users to notice the defective products in time. Two inspection modes, namely Trigger Mode and Continuous Mode, are provided to meet the requirement for inspection on different types of products.
The data shown here represent only a portion of the calculations available in the analysis software. Nanovea Profilometers measure virtually any surface in fields including Semiconductor, Microelectronics, Solar, Fiber, Optics, Automotive, Aerospace, Metallurgy, Machining, Coatings, Pharmaceutical, Biomedical, Environmental and many others.
Block-On-Ring Wear Test
IMPORTANCE OF BLOCK-ON-RING WEAR EVALUATION
Sliding wear is the progressive loss of material that results from two materials sliding against each other at the contact area under load. It occurs inevitably in a wide variety of industries where machines and engines are in operation, including automotive, aerospace, oil & gas and many others. Such sliding motion causes serious mechanical wear and material transfer at the surface, which may lead to reduced production efficiency, machine performance or even damage to the machine.
Sliding wear often involves complex wear mechanisms taking place at the contact surface, such as adhesion wear, two-body abrasion, three-body abrasion and fatigue wear. The wear behavior of materials is significantly influenced by the work environment, such as normal loading, speed, corrosion and lubrication. A versatile tribometer that can simulate the different realistic work conditions will be ideal for wear evaluation.
Block-on-Ring (ASTM G77) test is a widely used technique that evaluates the sliding wear behaviors of materials in different simulated conditions, allows reliable ranking of material couples for specific tribological applications.
Block-on-Ring (ASTM G77) test is a widely used technique that evaluates the sliding wear behaviors of materials in different simulated conditions, allows reliable ranking of material couples for specific tribological applications.
MEASUREMENT OBJECTIVE
In this application, the Nanovea Mechanical Tester measures the YS and UTS of stainless steel SS304 and aluminum Al6061 metal alloy samples. The samples were chosen for their commonly recognized YS and UTS values showing the reliability of Nanovea’s indentation methods.
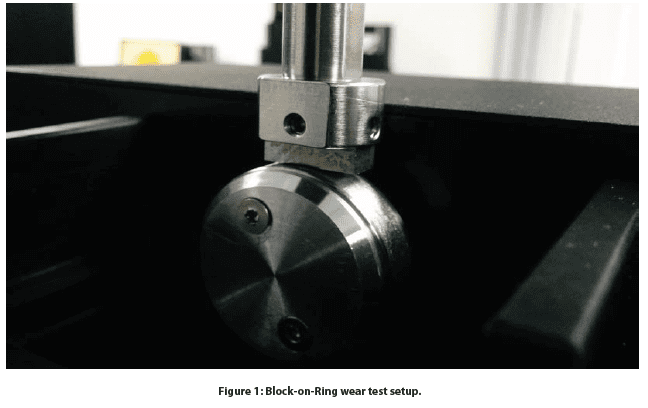
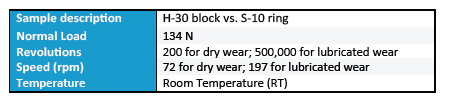
The sliding wear behavior of an H-30 block on an S-10 ring was evaluated by Nanovea’s tribometer using the Block-on-Ring module. The H-30 block is made of 01 tool steel of 30HRC hardness, while the S-10 ring is steel type 4620 of surface hardness 58 to 63 HRC and ring diameter of ~34.98 mm. Block-on-Ring tests were performed in dry and lubricated environments to investigate the effect on wear behavior. Lubrication tests were performed in USP heavy mineral oil. The wear track was examined using Nanovea’s 3D non-contact profilometer. Test parameters are summarized in Table 1. The wear rate (K), was evaluated using the formula K=V/(F×s), where V is the worn volume, F is the normal load, s is the sliding distance.
RESULTS AND DISCUSSION
Figure 2 compares the coefficient of friction (COF) of the Block-on-Ring tests in dry and lubricated environments. The block has significantly more friction in a dry environment than a lubricated environment. COF
fluctuates during the run-in period in the first 50-revolution and reaches a constant COF of ~0.8 for the rest of the 200-revolution wear test. In comparison, the Block-on-Ring test performed in the USP heavy mineral oil lubrication exhibits constant low COF of 0.09 throughout the 500,000-revolution wear test. The lubricant significantly reduces the COF between the surfaces by ~90 times.
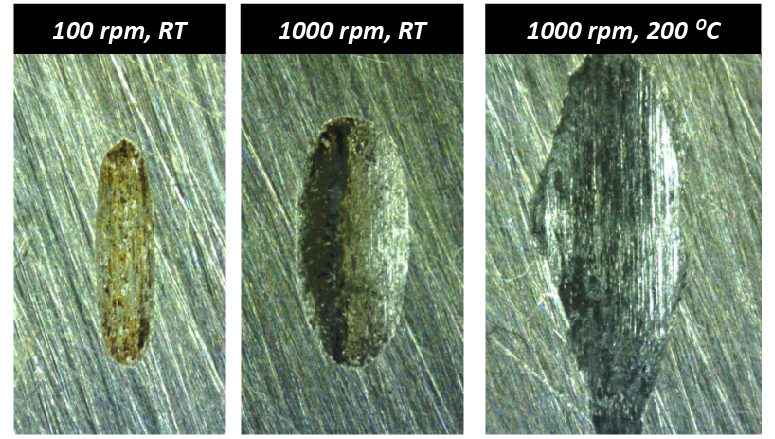
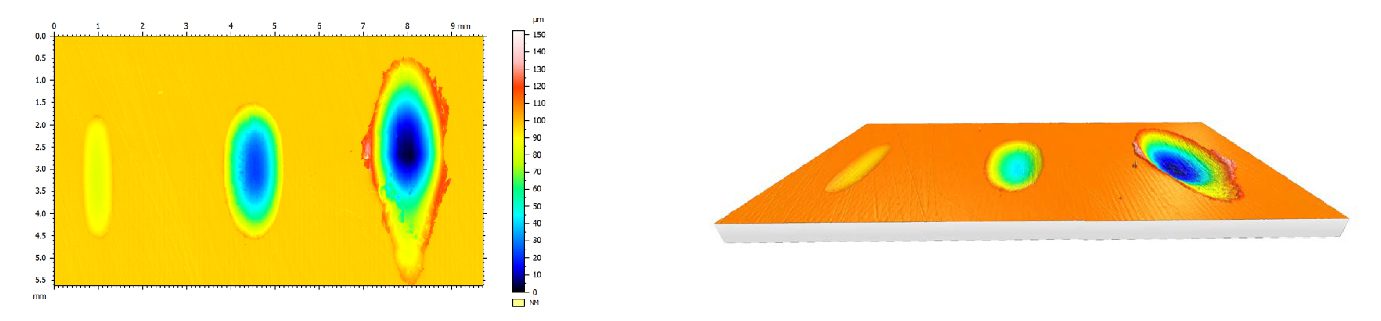
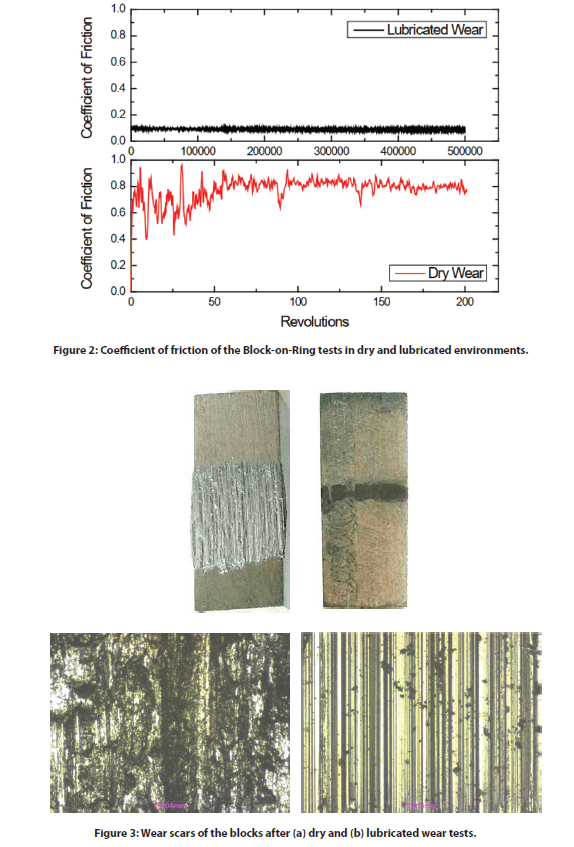
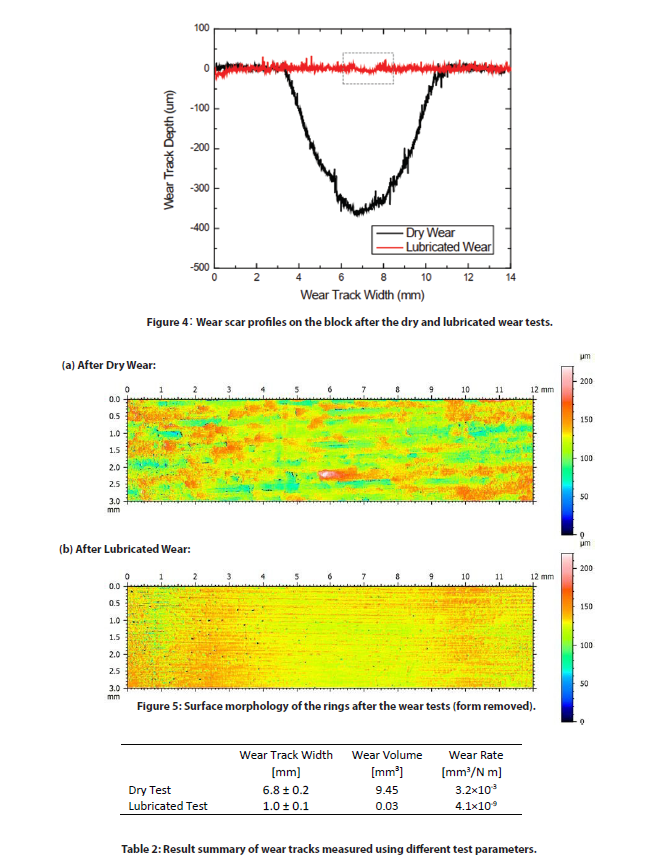
Figures 3 and 4 show the optical images and cross-section 2D profiles of the wear scars on the blocks after dry and lubricated wear tests. The wear track volumes and wear rates are listed in Table 2. The steel block after the dry wear test at a lower rotational speed of 72 rpm for 200 revolutions exhibits a large wear scar volume of 9.45 mm˙. In comparison, the wear test carried out at a higher speed of 197 rpm for 500,000 revolutions in the mineral oil lubricant creates a substantially smaller wear track volume of 0.03 mm˙.
The images in ÿgure 3 show severe wear takes place during tests in the dry conditions compared to the mild wear from the lubricated wear test. High heat and intense vibrations generated during the dry wear test promotes oxidation of metallic debris resulting in severe three-body abrasion. In the lubricated test the mineral oil reduces friction and cools the contact face as well as transporting abrasive debris created during wear away. This leads to signiÿcant reduction of wear rate by a factor of ~8×10ˆ. Such a substantial di˛erence in wear resistance in di˛erent environments shows the importance of proper sliding wear simulation in realistic service conditions.
Wear behavior can change drastically when small changes in test conditions are introduced. The versatility of Nanovea’s tribometer allows wear measurement in high temperature, lubrication, and tribocorrosion conditions. The accurate speed and position control by the advanced motor enables wear tests to be performed at speeds ranging from 0.001 to 5000 rpm, making it an ideal tool for research/testing labs to investigate the wear in di˛erent tribological conditions.
The surface condition of the samples was examined by Nanovea’s non-contact optical proÿlometer. Figure 5 shows the surface morphology of the rings after the wear tests. The cylinder form is removed to better present the surface morphology and roughness created by the sliding wear process. Signiÿcant surface roughening took place due to the three-body abrasion process during the dry wear test of 200 revolutions. The block and ring after the dry wear test exhibit a roughness Ra of 14.1 and 18.1 µm, respectively, compared to 5.7 and 9.1 µm for the long-term 500,000 – revolution lubricated wear test at a higher speed. This test demonstrates the importance of proper lubrication of piston ring-cylinder contact. Severe wear quickly damages the contact surface without lubrication and leads to irreversible deterioration of the service quality and even breakage of the engine.
CONCLUSION
In this study we showcase how Nanovea’s Tribometer is used to evaluate the sliding wear behavior of a steel metal couple using the Block-on-Ring module following the ASTM G77 Standard. The lubricant plays a critical role in the wear properties of the material couple. The mineral oil reduces the wear rate of the H-30 block by a factor of ~8×10ˆ and the COF by ~90 times. The versatility of Nanovea’s Tribometer makes it an ideal tool for measuring wear behavior under various lubrication, high temperature, and tribocorrosion conditions.
Nanovea’s Tribometer o˛ers precise and repeatable wear and friction testing using ISO and ASTM compliant rotative and linear modes, with optional high-temperature wear, lubrication, and tribo-corrosion modules available in one pre-integrated system. Nanovea’s unmatched range is an ideal solution for determining the full range of tribological properties of thin or thick, soft, or hard coatings, ÿlms, and substrates.

Composite Material Analysis using 3D Profilometry
Importance of Non-Contact Profilometry for Composite Materials
It is crucial defects are minimized so composite materials are as strong as possible in reinforcement applications. As an anisotropic material, it is critical weave direction is consistent to maintain high performance predictability. Composite materials have one of the highest strength to weight ratios making it stronger than steel in some cases. It is important to limit exposed surface area in composites to minimize chemical vulnerability and thermal expansion effects. Profilometry surface inspection is critical to quality control production of composites to ensure strong performance over a long service time.
Nanovea’s 3D Non-Contact Profilometer is unlike other surface measurement techniques such as touch probes or interferometry. Our profilometers use axial chromatism to measure nearly any surface and open staging allows for samples of any size with no preparation needed. Nano through macro measurements are obtained during surface profile measurement with zero influence from sample reflectivity or absorption. Our profilometers easily measure any material: transparent, opaque, specular, diffusive, polished, and rough with the advanced ability to measure high surface angles with no software manipulation. The Non-Contact Profilometer technique provides the ideal and user-friendly capability to maximize composite material surface studies; along with the benefits of combined 2D & 3D capability.
Measurement Objective
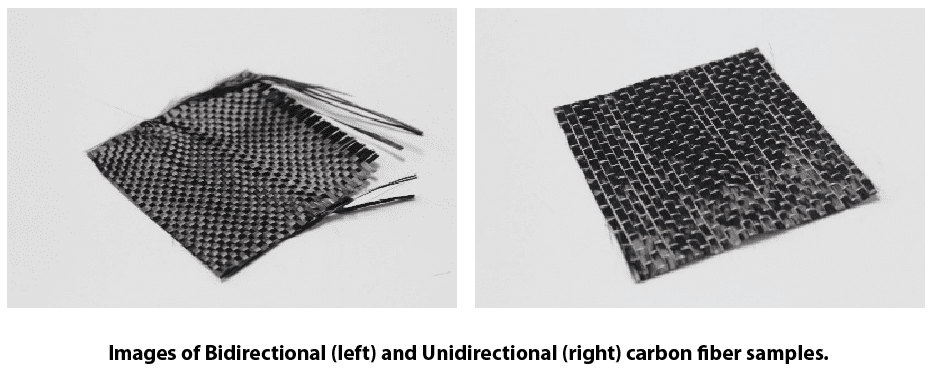
The Nanovea HS2000L Profilometer used in this application measured the surface of two weaves of carbon fiber composites. Surface roughness, weave length, isotropy, fractal analysis, and other surface parameters are used to characterize the composites. The area measured was randomly selected and assumed large enough that property values can be compared using Nanovea’s powerful surface analysis software.
Results and Discussion
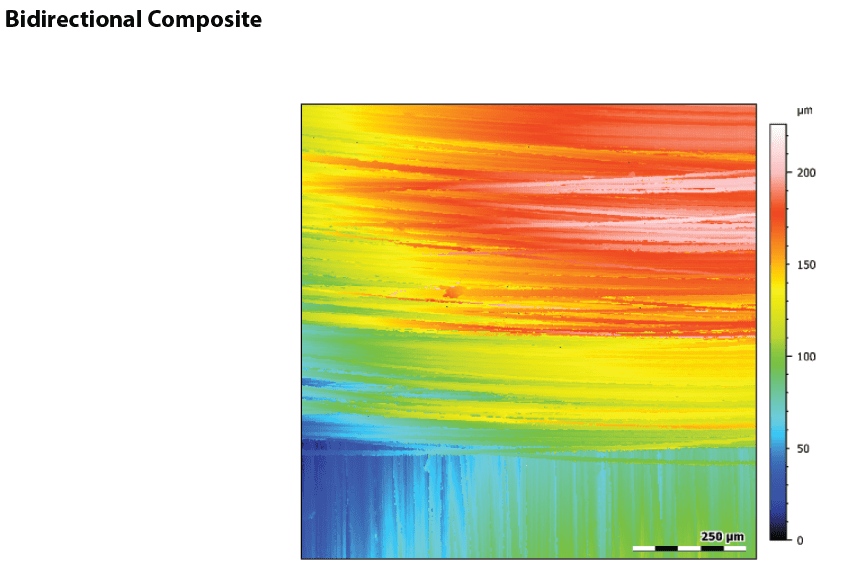
Surface Analysis
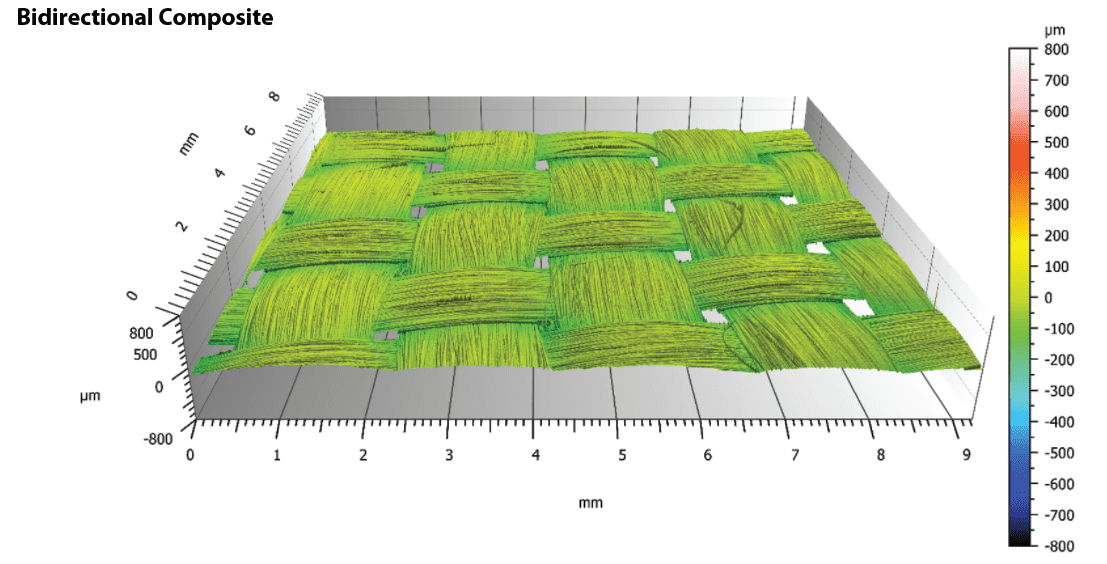
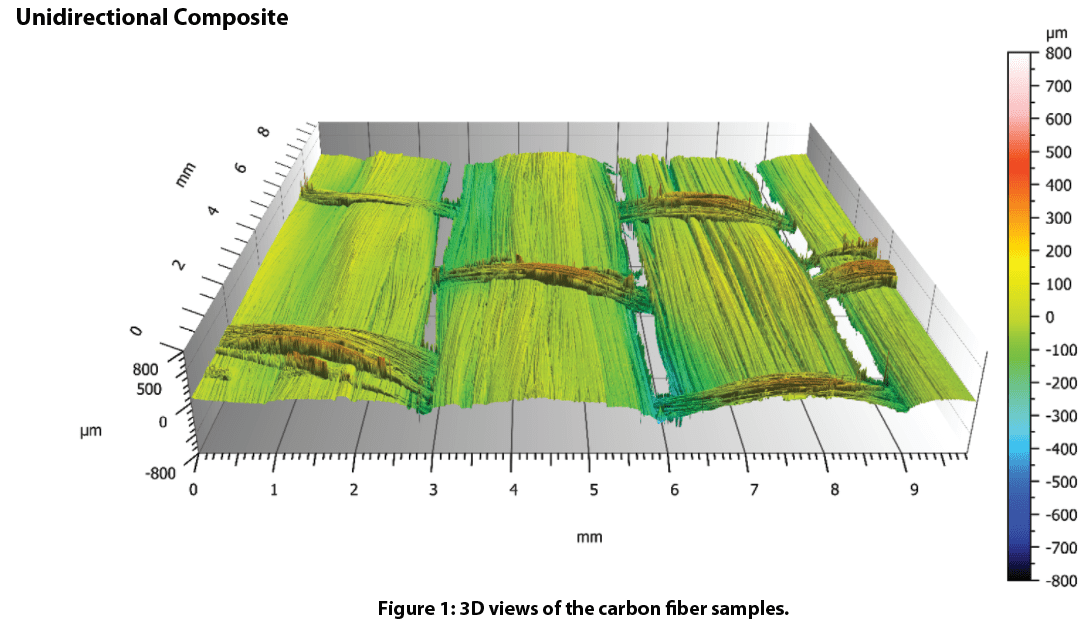
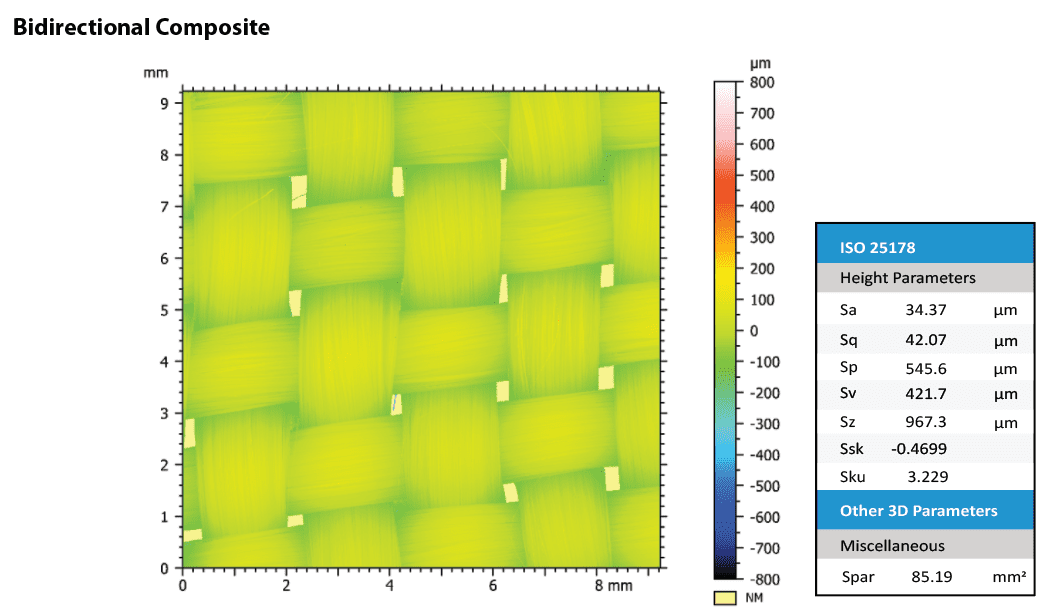
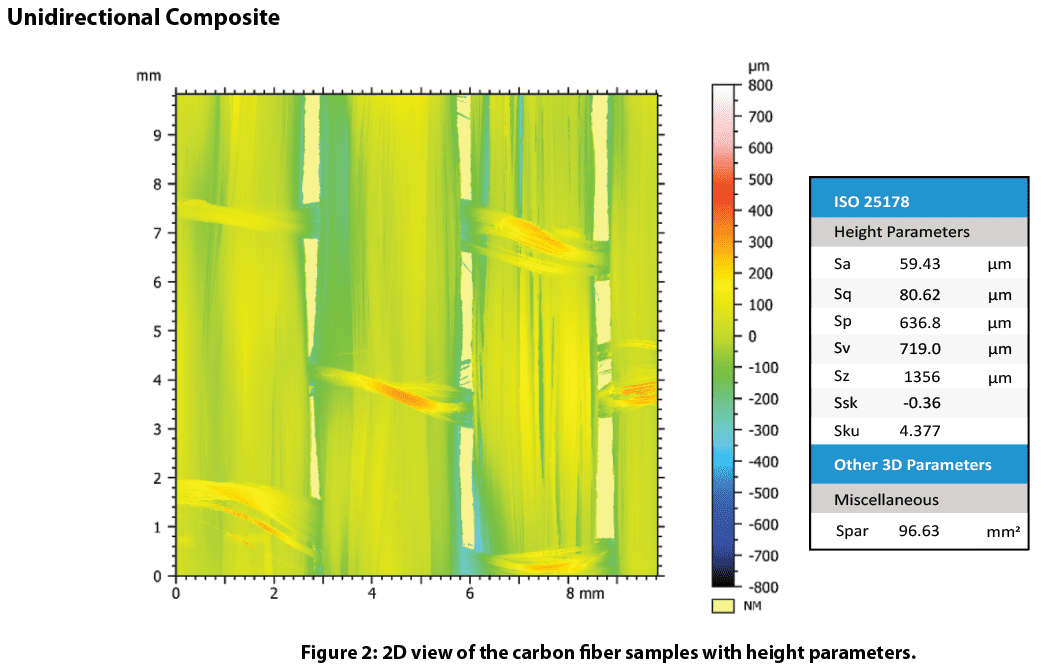
Height parameters determine how rough composite parts will be with a low fiber to matrix ratio. Our results compare different weave types and fabric to determine surface finish post-processing. Surface finish becomes critical in applications where aerodynamics may become involved.
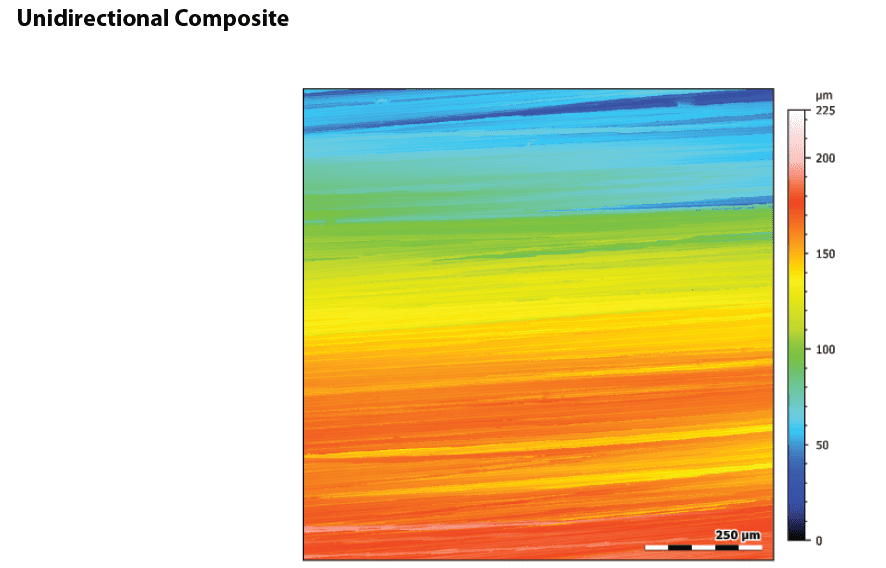
Isotropy
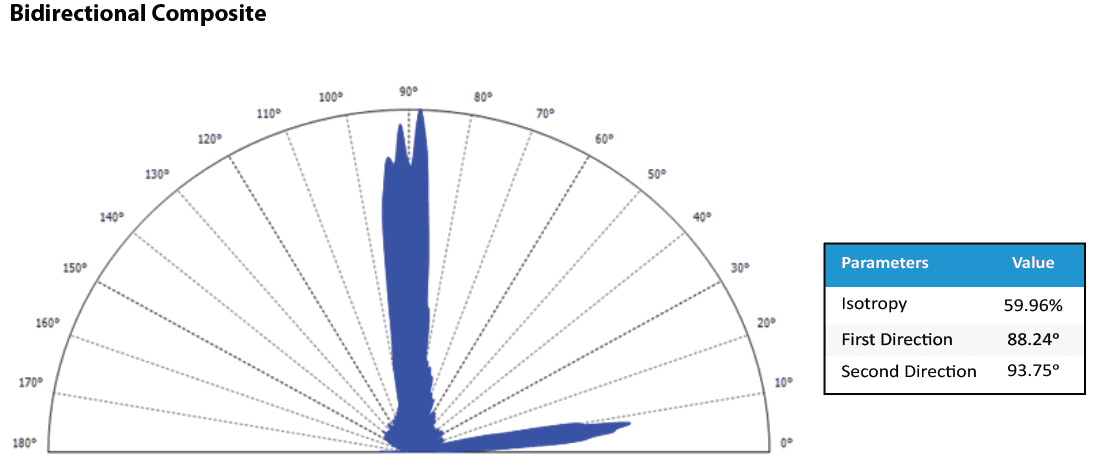
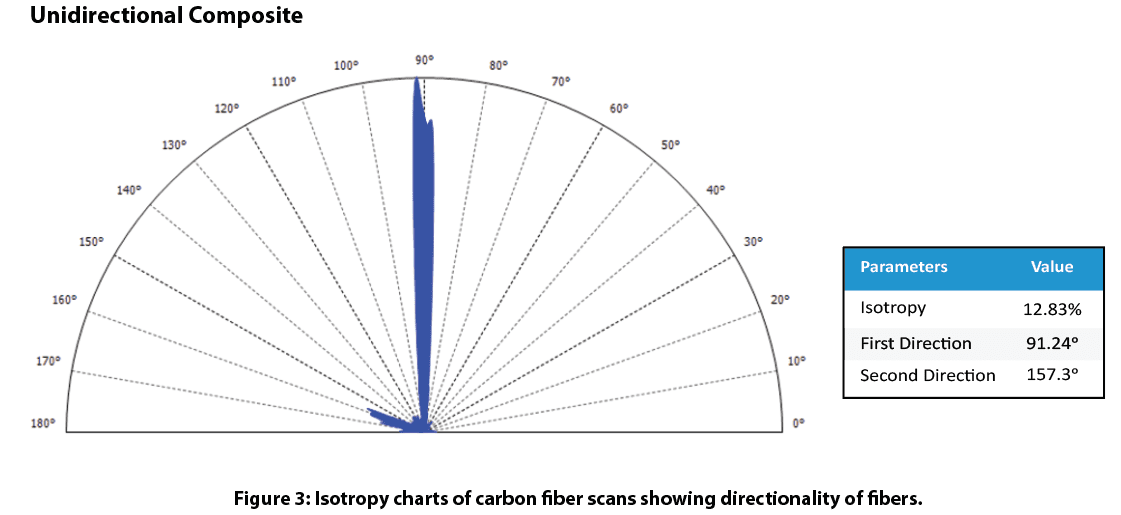
Isotropy shows directionality of the weave to determine expected property values. Our study shows how the bidirectional composite is ~60% isotropic as expected. Meanwhile, the unidirectional composite is ~13% isotropic due to the strong single fiber path direction fiber.
Weave Analysis
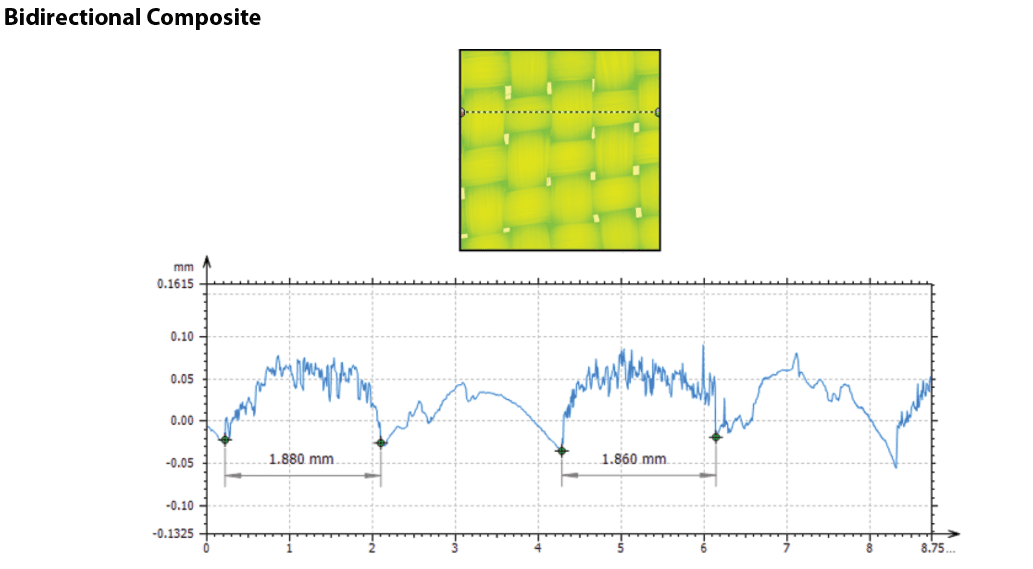
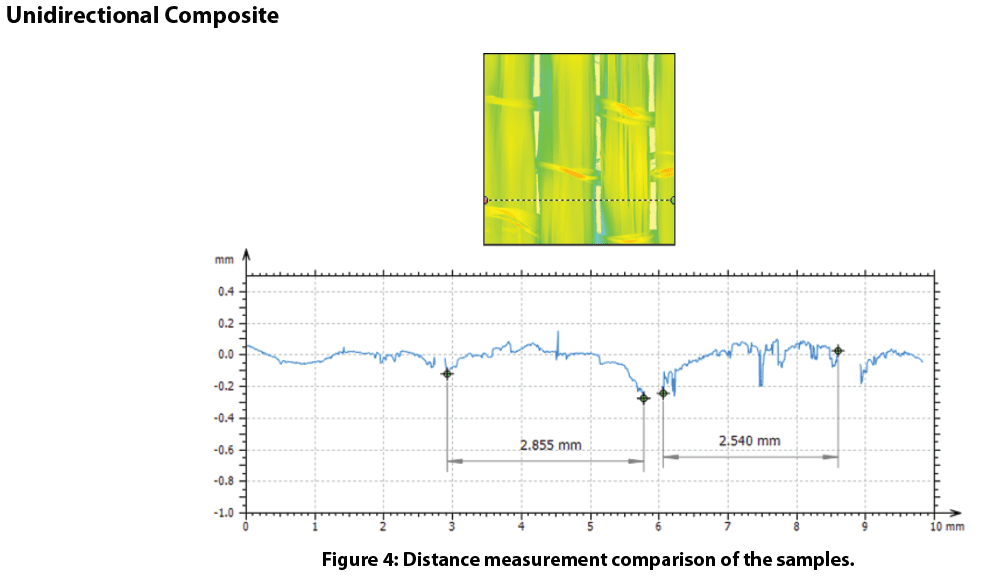
Weave size determines the consistency of packing and width of fibers used in the composite. Our study shows how easily we can measure weave size down to micron accuracy to ensure quality parts.
Texture Analysis
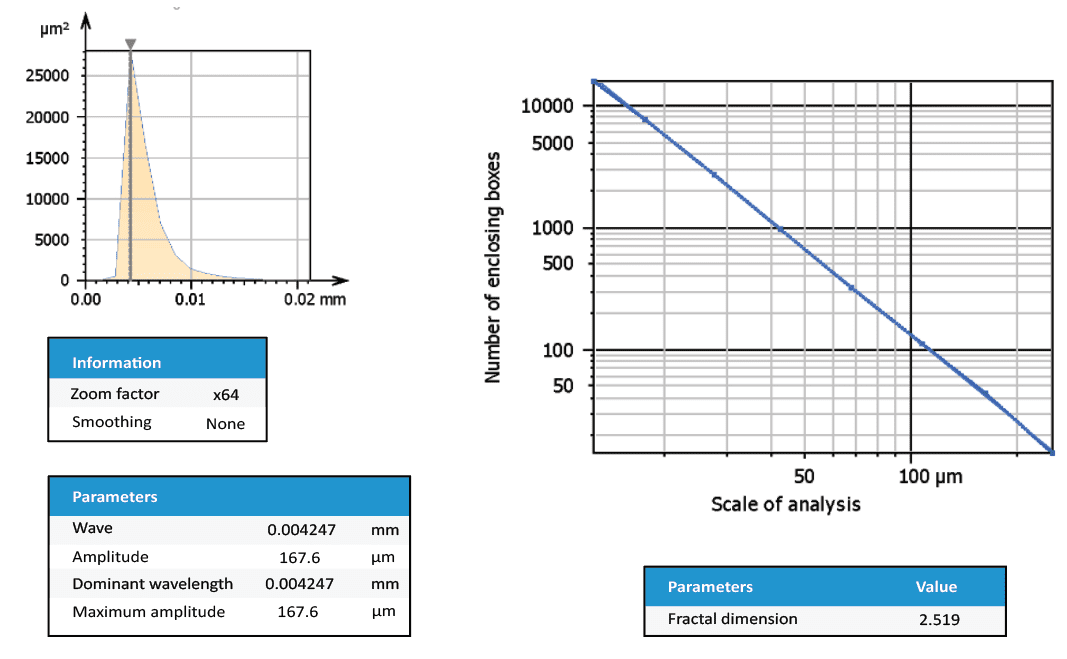

Texture analysis of the dominant wavelength suggests strand size for both composites are 4.27 microns thick. Fractal dimension analysis of the fiber surface determines smoothness to find how easily fibers will set in a matrix. The fractal dimension of the unidirectional fiber is higher than the bidirectional fiber which may affect the processing of composites.
Conclusion

In this application, we have shown the Nanovea HS2000L Non-Contact Profilometer precisely characterizes the fibrous surface of composite materials. We distinguished differences between weave types of carbon fiber with height parameters, isotropy, texture analysis, and distance measurements along with much more.
Our profilometer surface measurements precisely and quickly mitigate composite damage which decreases defects in parts, maximizing composite material capability. Nanovea’s 3D profilometer speed ranges from <1mm/s to 500mm/s for suitability in research applications to the needs of high-speed inspection. The Nanovea profilometer is the solution
to any composite measurement need.


