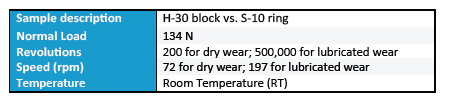
Category: Profilometry | Volume and Area

Machined Parts Inspection


Block-On-Ring Wear Test
IMPORTANCE OF BLOCK-ON-RING WEAR EVALUATION
Sliding wear is the progressive loss of material that results from two materials sliding against each other at the contact area under load. It occurs inevitably in a wide variety of industries where machines and engines are in operation, including automotive, aerospace, oil & gas and many others. Such sliding motion causes serious mechanical wear and material transfer at the surface, which may lead to reduced production efficiency, machine performance or even damage to the machine.
Sliding wear often involves complex wear mechanisms taking place at the contact surface, such as adhesion wear, two-body abrasion, three-body abrasion and fatigue wear. The wear behavior of materials is significantly influenced by the work environment, such as normal loading, speed, corrosion and lubrication. A versatile tribometer that can simulate the different realistic work conditions will be ideal for wear evaluation.
Block-on-Ring (ASTM G77) test is a widely used technique that evaluates the sliding wear behaviors of materials in different simulated conditions, allows reliable ranking of material couples for specific tribological applications.
Block-on-Ring (ASTM G77) test is a widely used technique that evaluates the sliding wear behaviors of materials in different simulated conditions, allows reliable ranking of material couples for specific tribological applications.
MEASUREMENT OBJECTIVE
In this application, the Nanovea Mechanical Tester measures the YS and UTS of stainless steel SS304 and aluminum Al6061 metal alloy samples. The samples were chosen for their commonly recognized YS and UTS values showing the reliability of Nanovea’s indentation methods.
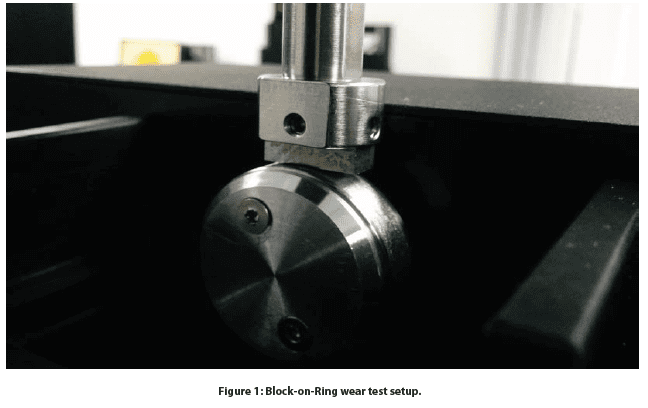
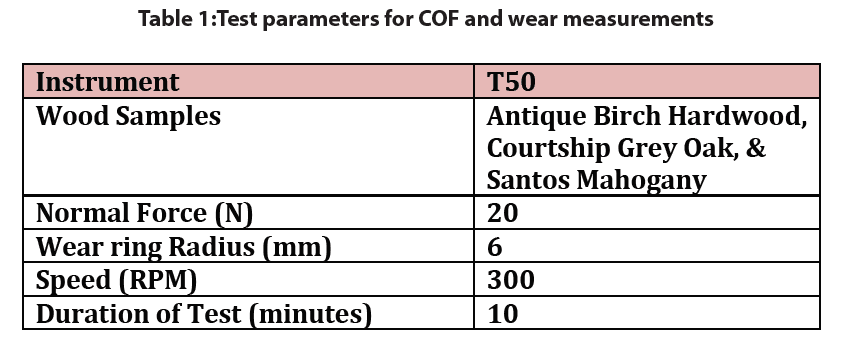
The sliding wear behavior of an H-30 block on an S-10 ring was evaluated by Nanovea’s tribometer using the Block-on-Ring module. The H-30 block is made of 01 tool steel of 30HRC hardness, while the S-10 ring is steel type 4620 of surface hardness 58 to 63 HRC and ring diameter of ~34.98 mm. Block-on-Ring tests were performed in dry and lubricated environments to investigate the effect on wear behavior. Lubrication tests were performed in USP heavy mineral oil. The wear track was examined using Nanovea’s 3D non-contact profilometer. Test parameters are summarized in Table 1. The wear rate (K), was evaluated using the formula K=V/(F×s), where V is the worn volume, F is the normal load, s is the sliding distance.
RESULTS AND DISCUSSION
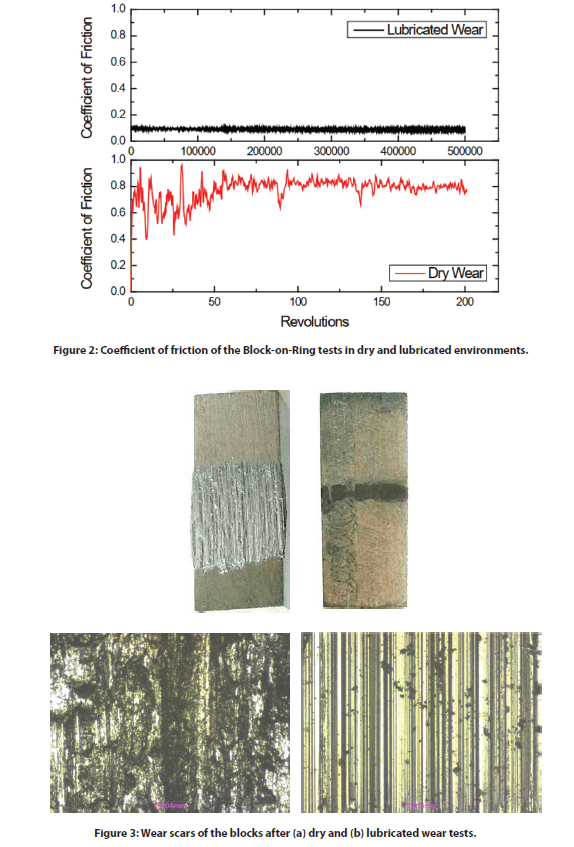
Figure 2 compares the coefficient of friction (COF) of the Block-on-Ring tests in dry and lubricated environments. The block has significantly more friction in a dry environment than a lubricated environment. COF
fluctuates during the run-in period in the first 50-revolution and reaches a constant COF of ~0.8 for the rest of the 200-revolution wear test. In comparison, the Block-on-Ring test performed in the USP heavy mineral oil lubrication exhibits constant low COF of 0.09 throughout the 500,000-revolution wear test. The lubricant significantly reduces the COF between the surfaces by ~90 times.
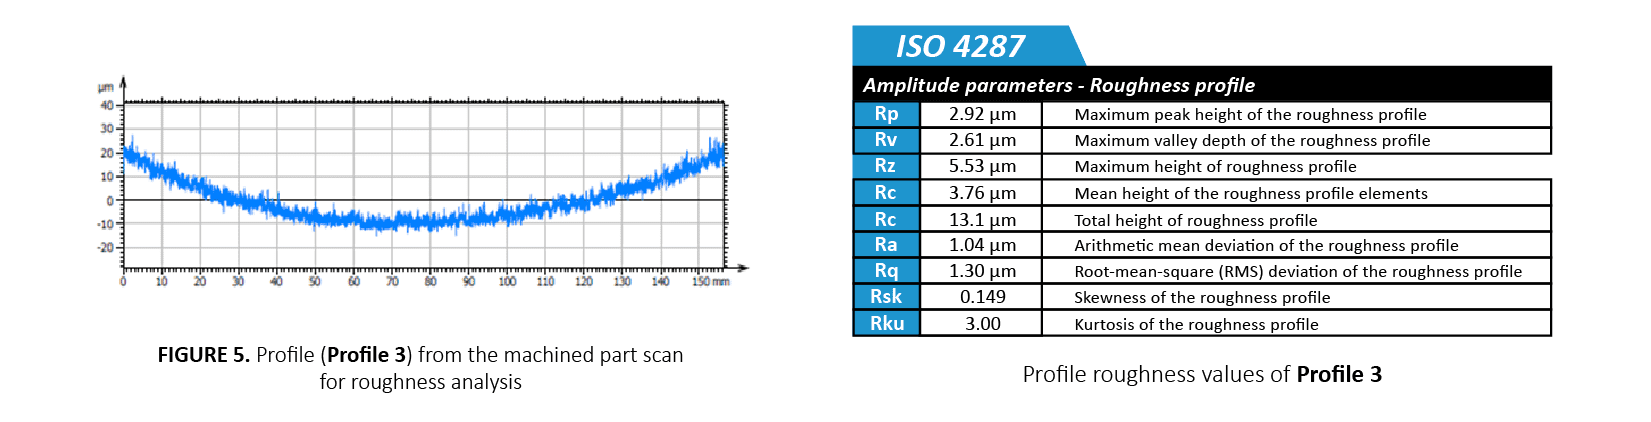
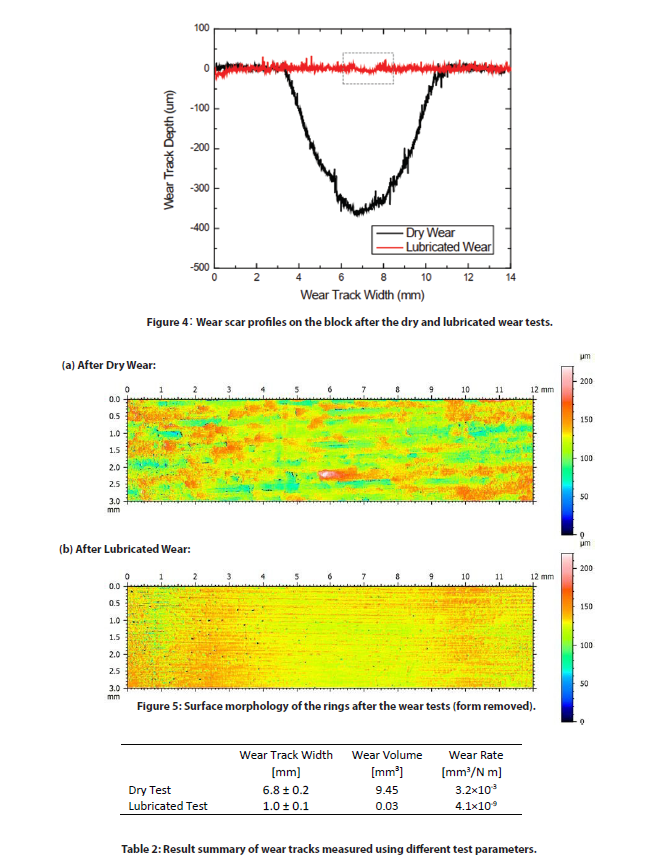
Figures 3 and 4 show the optical images and cross-section 2D profiles of the wear scars on the blocks after dry and lubricated wear tests. The wear track volumes and wear rates are listed in Table 2. The steel block after the dry wear test at a lower rotational speed of 72 rpm for 200 revolutions exhibits a large wear scar volume of 9.45 mm˙. In comparison, the wear test carried out at a higher speed of 197 rpm for 500,000 revolutions in the mineral oil lubricant creates a substantially smaller wear track volume of 0.03 mm˙.
The images in ÿgure 3 show severe wear takes place during tests in the dry conditions compared to the mild wear from the lubricated wear test. High heat and intense vibrations generated during the dry wear test promotes oxidation of metallic debris resulting in severe three-body abrasion. In the lubricated test the mineral oil reduces friction and cools the contact face as well as transporting abrasive debris created during wear away. This leads to signiÿcant reduction of wear rate by a factor of ~8×10ˆ. Such a substantial di˛erence in wear resistance in di˛erent environments shows the importance of proper sliding wear simulation in realistic service conditions.
Wear behavior can change drastically when small changes in test conditions are introduced. The versatility of Nanovea’s tribometer allows wear measurement in high temperature, lubrication, and tribocorrosion conditions. The accurate speed and position control by the advanced motor enables wear tests to be performed at speeds ranging from 0.001 to 5000 rpm, making it an ideal tool for research/testing labs to investigate the wear in di˛erent tribological conditions.
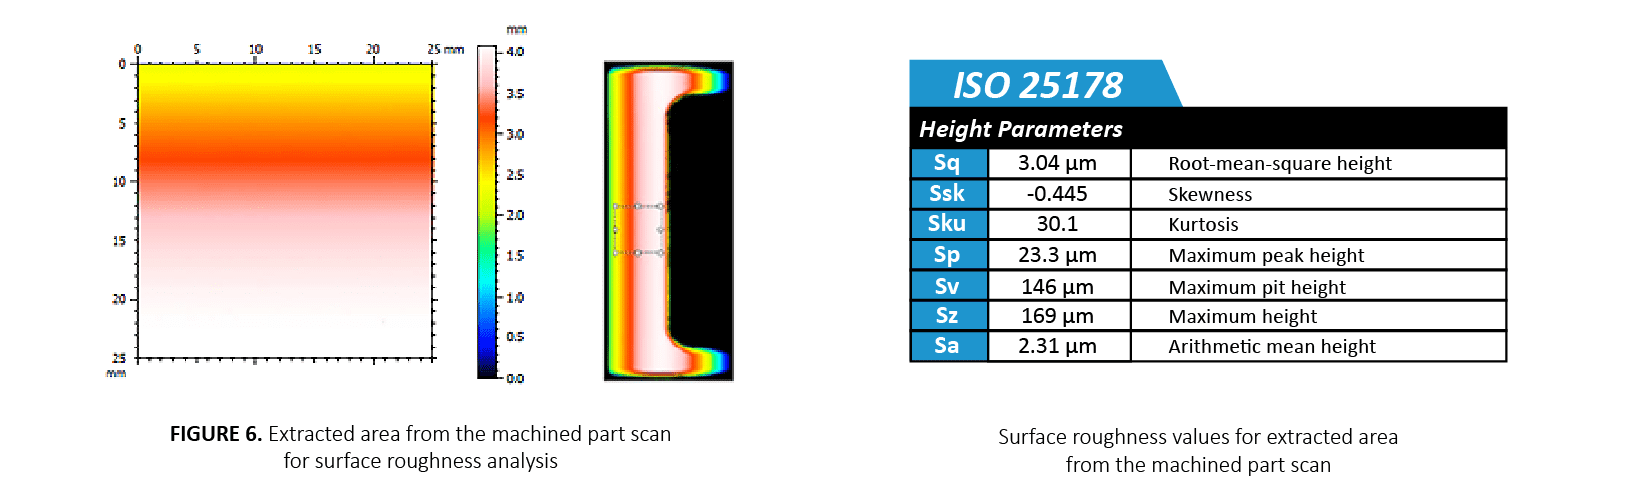
The surface condition of the samples was examined by Nanovea’s non-contact optical proÿlometer. Figure 5 shows the surface morphology of the rings after the wear tests. The cylinder form is removed to better present the surface morphology and roughness created by the sliding wear process. Signiÿcant surface roughening took place due to the three-body abrasion process during the dry wear test of 200 revolutions. The block and ring after the dry wear test exhibit a roughness Ra of 14.1 and 18.1 µm, respectively, compared to 5.7 and 9.1 µm for the long-term 500,000 – revolution lubricated wear test at a higher speed. This test demonstrates the importance of proper lubrication of piston ring-cylinder contact. Severe wear quickly damages the contact surface without lubrication and leads to irreversible deterioration of the service quality and even breakage of the engine.
CONCLUSION
In this study we showcase how Nanovea’s Tribometer is used to evaluate the sliding wear behavior of a steel metal couple using the Block-on-Ring module following the ASTM G77 Standard. The lubricant plays a critical role in the wear properties of the material couple. The mineral oil reduces the wear rate of the H-30 block by a factor of ~8×10ˆ and the COF by ~90 times. The versatility of Nanovea’s Tribometer makes it an ideal tool for measuring wear behavior under various lubrication, high temperature, and tribocorrosion conditions.
Nanovea’s Tribometer o˛ers precise and repeatable wear and friction testing using ISO and ASTM compliant rotative and linear modes, with optional high-temperature wear, lubrication, and tribo-corrosion modules available in one pre-integrated system. Nanovea’s unmatched range is an ideal solution for determining the full range of tribological properties of thin or thick, soft, or hard coatings, ÿlms, and substrates.
Dynamic Load Tribology
Introduction
Wear takes place in virtually every industrial sector and imposes costs of ~0.75% of the GDP1. Tribology research is vital in improving production efficiency, application performance, as well as conservation of material, energy, and the environment. Vibration and oscillation inevitably occur in a wide range of tribological applications. Excessive external vibration accelerates the wear process and reduces service performance which leads to catastrophic failures to the mechanical parts.
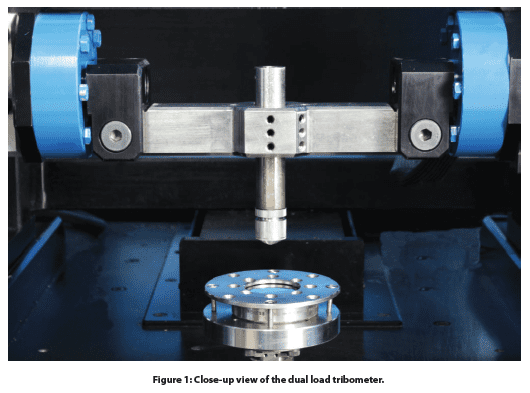
Conventional dead load tribometers apply normal loads by mass weights. Such a loading technique not only limits the loading options to a constant load, but it also creates intense uncontrolled vibrations at high loads and speeds leading to limited and inconsistent wear behavior assessments. A reliable evaluation of the effect of controlled oscillation on the wear behavior of materials is desirable for R&D and QC in different industrial applications.
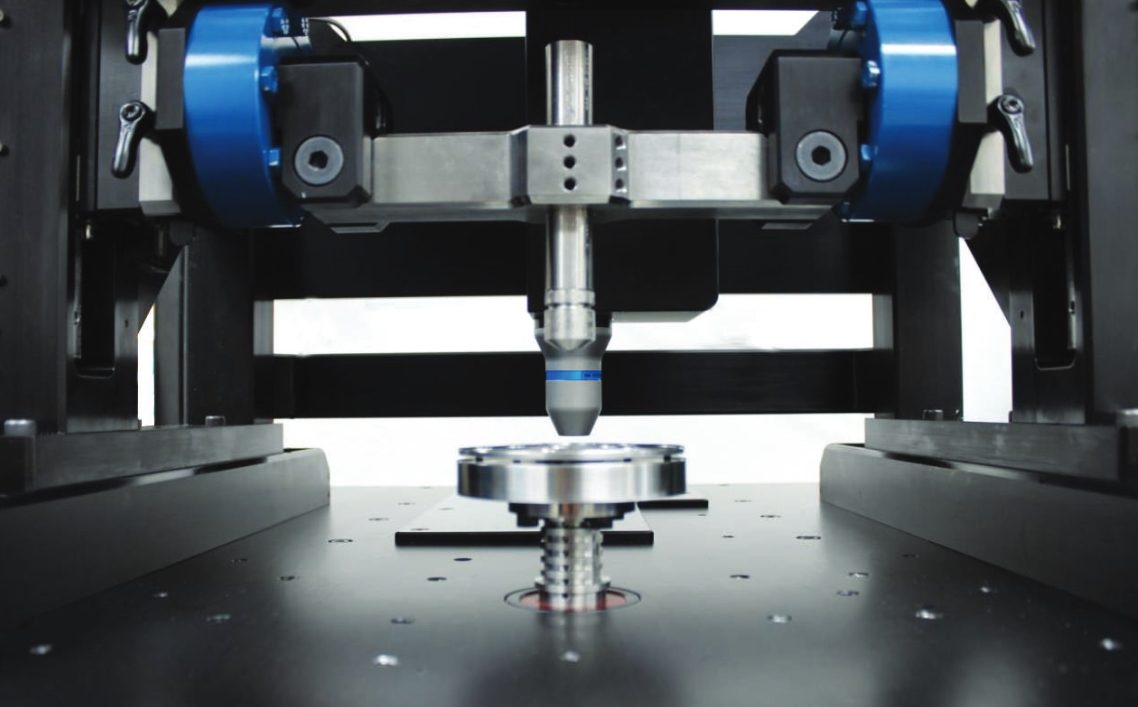
Nanovea’s groundbreaking high load tribometer has a maximum load capacity of 2000 N with a dynamic load control system. The advanced pneumatic compressed air loading system enables users to evaluate the tribological behavior of a material under high normal loads with the advantage of damping undesired vibration created during the wear process. Therefore, the load is measured directly with no need for buffer springs used in older designs. A parallel electromagnet oscillating loading module applies well-controlled oscillation of desired amplitude up to 20 N and frequency up to 150 Hz.
Friction is measured with high accuracy directly from the side force applied to the upper holder. The displacement is monitored in situ, providing insight into the evolution of the wear behavior of the test samples. The wear test under controlled oscillation loading can also be performed in corrosion, high temperature, humidity, and lubrication environments to simulate the real work conditions for the tribological applications. An integrated high-speed non-contact profilometer automatically measures the wear track morphology and wear volume in a few seconds.
Measurement Objective
In this study, we showcase the capacity of the Nanovea T2000 Dynamic Load Tribometer in studying the tribological behavior of different coating and metal samples under controlled oscillation loading conditions.
Test Procedure
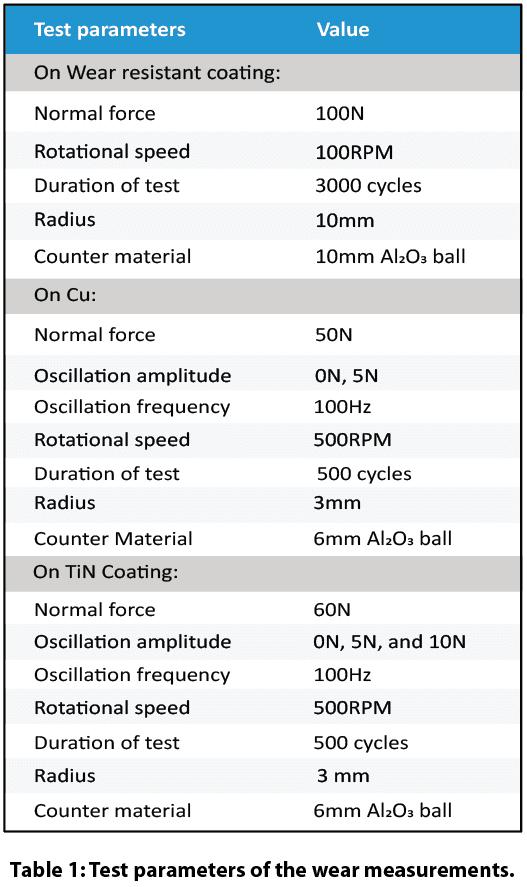
The tribological behavior, e.g. coefficient of friction, COF, and wear resistance of a 300 µm thick wear-resistant coating was assessed and compared by the Nanovea T2000 Tribometer with a conventional dead load tribometer using a pin on disk setup following ASTM G992.
Separate Cu and TiN coated samples against a 6 mm Al₂0₃ ball under controlled oscillation were evaluated by Dynamic Load Tribology Mode of the Nanovea T2000 Tribometer.
The test parameters are summarized in Table 1.
The integrated 3D profilometer equipped with a line sensor automatically scans the wear track after the tests, providing the most accurate wear volume measurement in seconds.
Results and Discussion
Pneumatic loading system vs. Dead load system
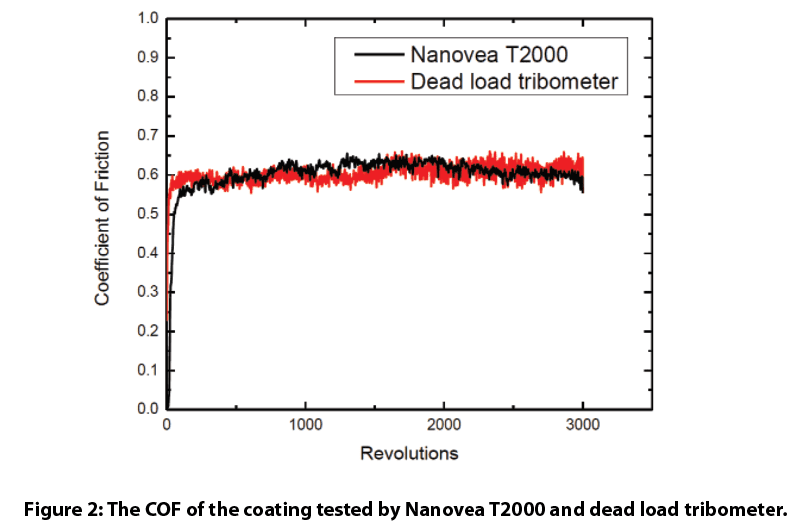
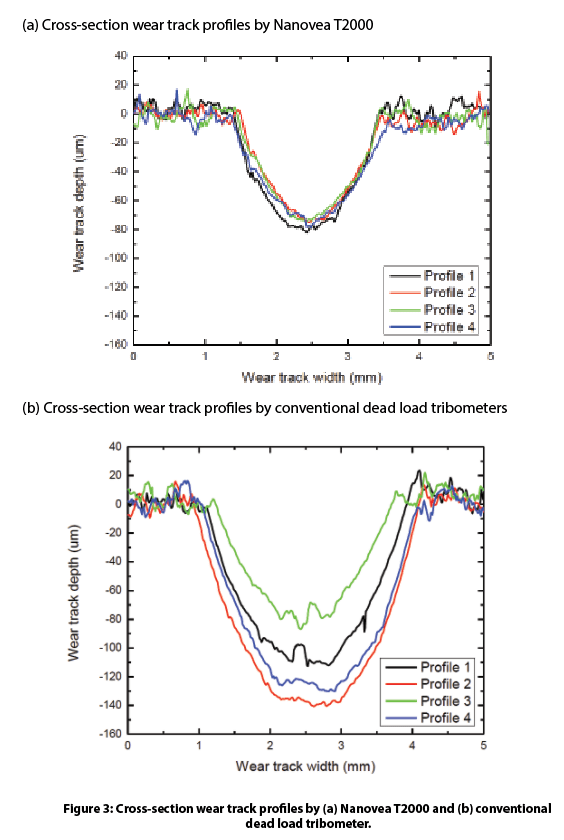
The tribological behavior of a wear-resistant coating using Nanovea T2000 Tribometer is compared to a conventional dead load (DL) tribometer. The evolution of the COF of the coating are shown in Fig. 2. We observe the coating exhibits a comparable COF value of ~0.6 during the wear test. However, the 20 cross-section profiles at different locations of the wear track in Fig. 3 indicate that the coating experienced much more severe wear under the dead load system.
Intense vibrations were generated by the wear process of the dead load system at high load and speed. The massive concentrated pressure at the contact face combined with a high sliding speed creates substantial weight and structure vibration leading to accelerated wear. The conventional dead load tribometer applies load using mass weights. This method is reliable at lower contact loads under mild wear conditions; however, under aggressive wear conditions at higher loads and speeds, the significant vibration causes the weights to bounce repeatedly, resulting in an uneven wear track causing unreliable tribological evaluation. The calculated wear rate is 8.0±2.4 x 10⁻⁴ mm3/N m, showing a high wear rate and large standard deviation.
The Nanovea T2000 tribometer is designed with a dynamic control loading system to dampen the oscillations. It applies the normal load with compressed air which minimizes undesired vibration created during the wear process. In addition, active closed loop loading control ensures a constant load is applied throughout the wear test and the stylus follows the depth change of the wear track. A significantly more consistent wear track profile is measured as shown in Fig. 3a, resulting in a low wear rate of 3.4±0.5 x 10⁻⁴ mm3/N m.
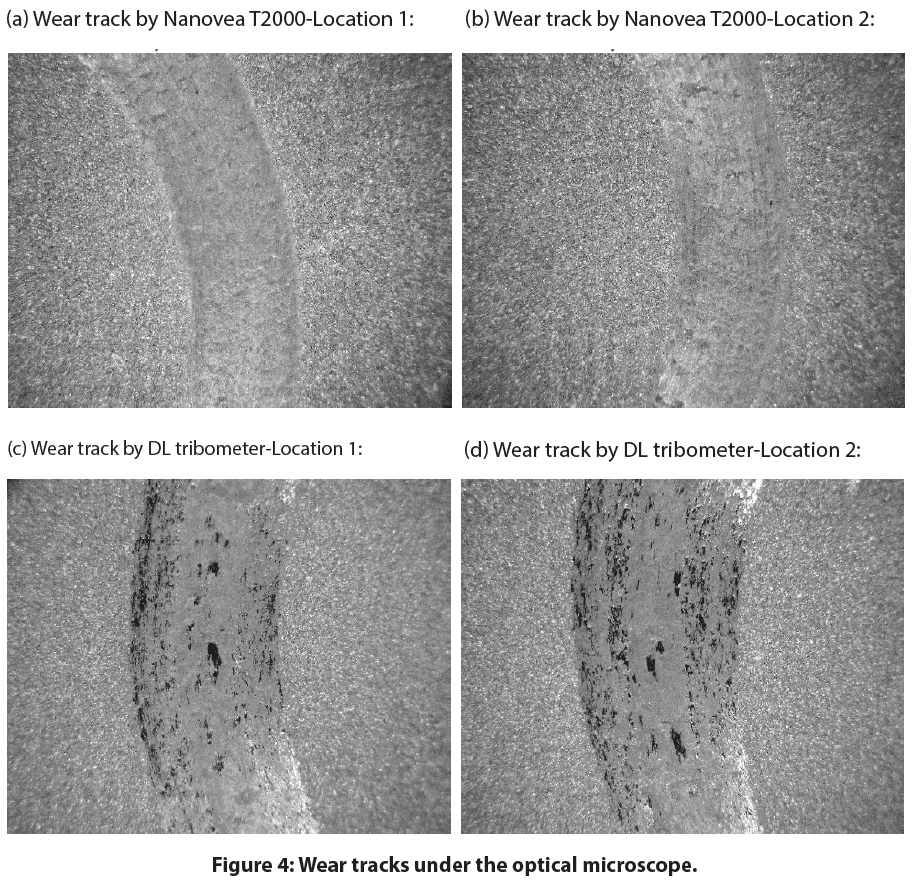
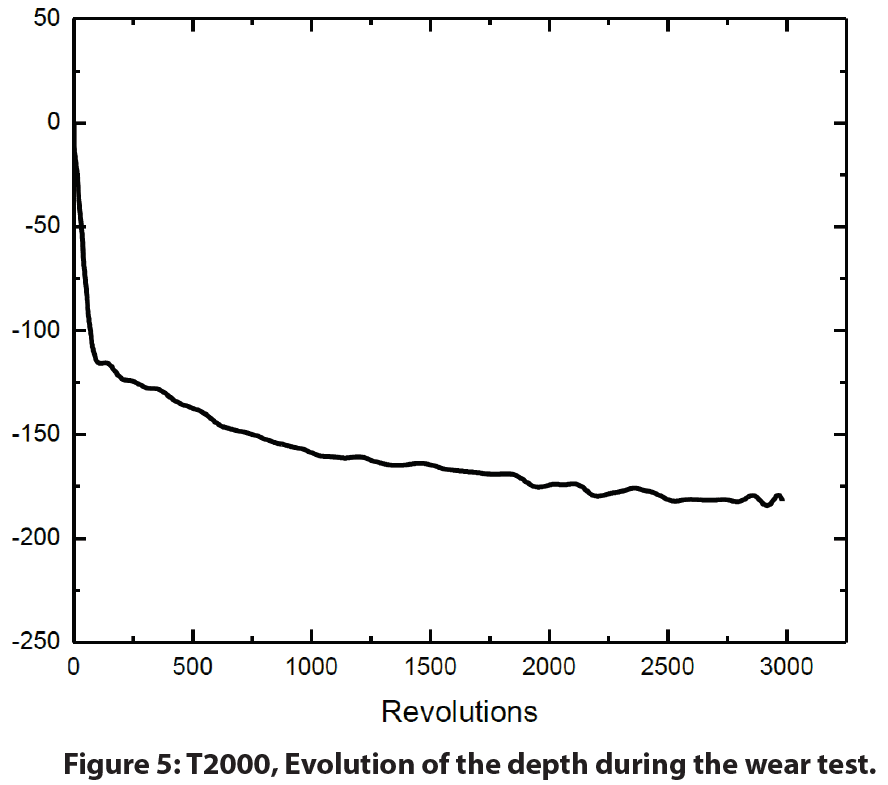
The wear track analysis shown in Fig. 4 confirms the wear test performed by the pneumatic compressed air loading system of the Nanovea T2000 Tribometer creates a smoother and more consistent wear track compared to the conventional dead load tribometer. In addition, the Nanovea T2000 tribometer measures stylus displacement during the wear process providing further insight into the progress of the wear behavior in situ.
Controlled Oscillation on Wear of the Cu sample
The parallel oscillating loading electromagnet module of the Nanovea T2000 Tribometer enables users to investigate the effect of controlled amplitude and frequency oscillations on the wear behavior of materials. The COF of the Cu samples is recorded in situ as shown in Fig. 6. The Cu sample exhibits a constant COF of ~0.3 during the first 330-revolution measurement, signifying the formation of a stable contact at the interface and relatively smooth wear track. As the wear test continues, the variation of the COF indicates a change in the wear mechanism. In comparison, the wear tests under a 5 N amplitude-controlled oscillation at 50 N exhibits a different wear behavior: the COF increases promptly at the beginning of the wear process, and shows significant variation throughout the wear test. Such behavior of COF indicates that the imposed oscillation in the normal load plays a role in the unstable sliding state at the contact.
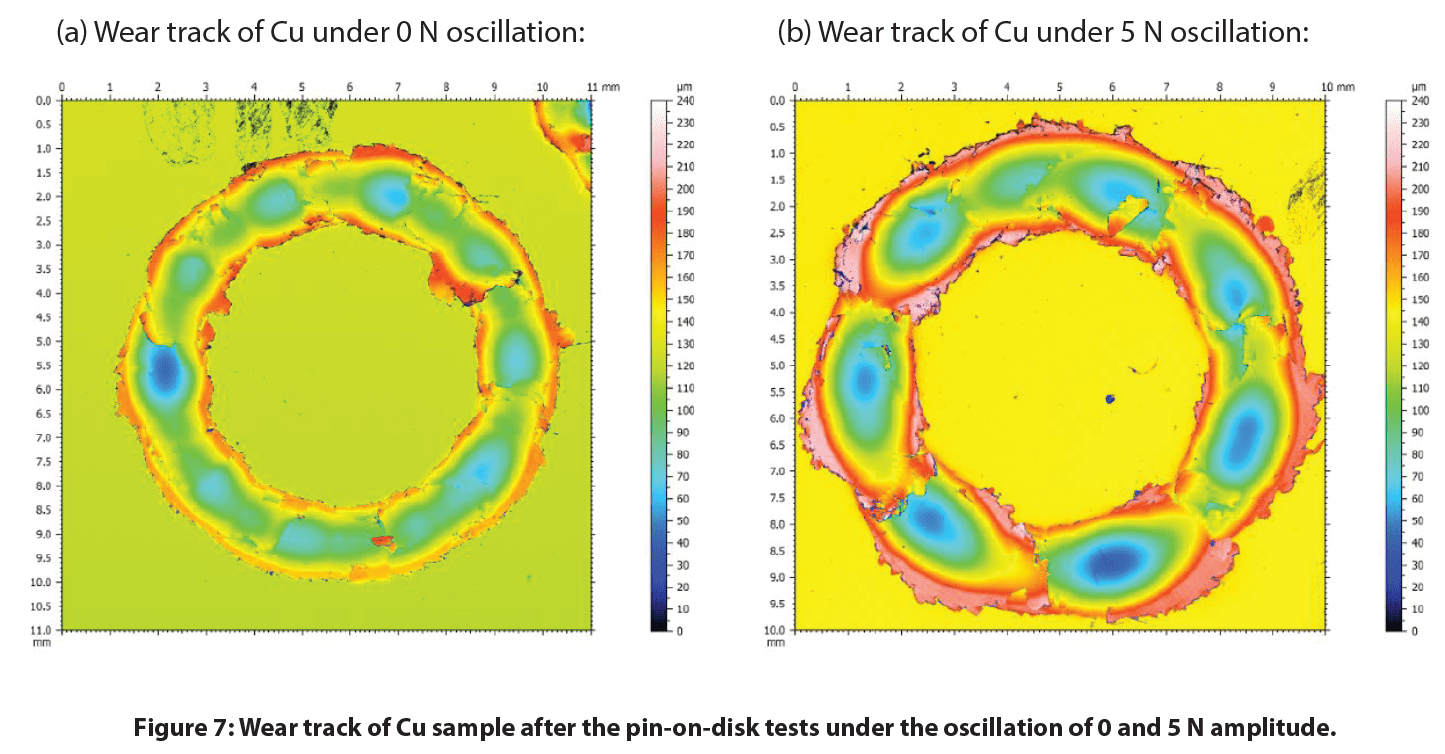
Fig. 7 compares the wear track morphology measured by the integrated non-contact optical profilometer. It can be observed that the Cu sample under a controlled oscillation amplitude of 5 N exhibits a much larger wear track with a volume of 1.35 x 109 µm3, compared to 5.03 x 108 µm3 under no imposed oscillation. The controlled oscillation significantly accelerates the wear rate by a factor of ~2.7, showing the critical effect of oscillation on wear behavior.

Controlled Oscillation on Wear of the TiN Coating
The COF and wear tracks of the TiN coating sample are shown in Fig. 8. The TiN coating exhibits significantly different wear behaviors under oscillation as indicated by the evolution of COF during the tests. The TiN coating shows a constant COF of ~0.3 following the run-in period at the beginning of the wear test, due to the stable sliding contact at the interface between the TiN coating and the Al₂O₃ ball. However, when the TiN coating starts to fail, the Al₂O₃ ball penetrates through the coating and slides against the fresh steel substrate underneath. A significant amount of hard TiN coating debris is generated in the wear track at the same time, turning a stable two-body sliding wear into three-body abrasion wear. Such a change of the material couple characteristics leads to the increased variations in the evolution of COF. The imposed 5 N and 10 N oscillation accelerates the TiN coating failure from ~400 revolutions to below 100 revolutions. The larger wear tracks on the TiN coating samples after the wear tests under the controlled oscillation is in agreement with such a change in COF.

Conclusion
The advanced pneumatic loading system of the Nanovea T2000 Tribometer possesses an intrinsic advantage as a naturally quick vibration damper compared to traditional dead load systems. This technological advantage of pneumatic systems is true compared to load-controlled systems that use a combination of servo motors and springs to apply the load. The technology ensures reliable and better-controlled wear evaluation at high loads as demonstrated in this study. In addition, the active closed loop loading system can change the normal load to a desired value during wear tests to simulate real-life applications seen in brake systems.
Instead of having influence from uncontrolled vibration conditions during tests, we have shown the Nanovea T2000 Dynamic-Load Tribometer enables users to quantitatively assess the tribological behaviors of materials under different controlled oscillation conditions. Vibrations play a significant role in the wear behavior of metal and ceramic coating samples.
The parallel electromagnet oscillating loading module provides precisely controlled oscillations at set amplitudes and frequencies, allowing users to simulate the wear process under real-life conditions when environmental vibrations are often an important factor. In the presence of imposed oscillations during wear, both the Cu and the TiN coating samples exhibit substantially increased wear rate. The evolution of the coefficient of friction and stylus displacement measured in situ are important indicators for the performance of the material during the tribological applications. The integrated 3D non-contact profilometer offers a tool to precisely measure the wear volume and analyze the detailed morphology of the wear tracks in seconds, providing more insight into the fundamental understanding of wear mechanism.
The T2000 is equipped with a self-tuned, high-quality, and high torque motor with a 20-bit internal speed and a 16-bit external position encoder. It enables the tribometer to provide an unmatched range of rotational speeds from 0.01 to 5000 rpm that can change in stepwise jumps or at continuous rates. Contrary to systems that use a bottom located torque sensor, the Nanovea Tribometer uses a top located high-precision load cell to accurately and separately measure friction forces.
Nanovea Tribometers offers precise and repeatable wear and friction testing using ISO and ASTM compliant rotative and linear modes (including 4ball, thrust washer, and block on ring tests), with optional high-temperature wear, lubrication and tribo-corrosion modules available in one pre-integrated system. Nanovea T2000’s unmatched range is an ideal solution for determining the full range of tribological properties of thin or thick, soft or hard coatings, films, and substrates.
Tribology of Polymers
Introduction
Polymers have been used extensively in a wide variety of applications and have become an indispensable part of everyday life. Natural polymers such as amber, silk, and natural rubber have played an essential role in human history. The fabrication process of synthetic polymers can be optimized to achieve unique physical properties such as toughness, viscoelasticity, self-lubrication, and many others.
Importance of Wear and Friction of Polymers
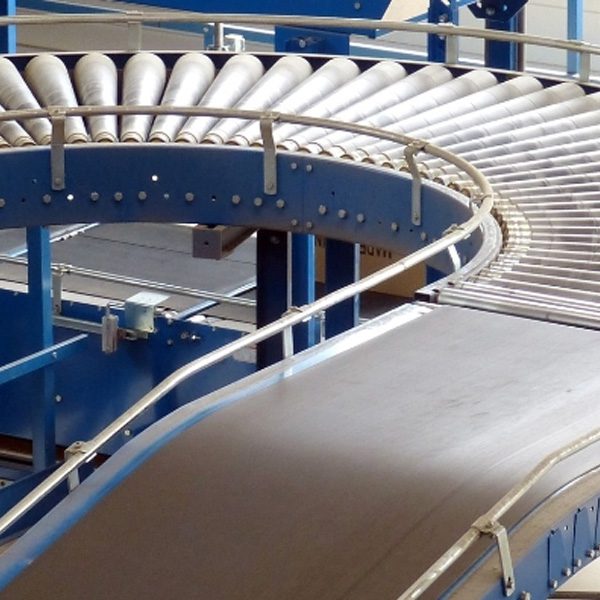
Polymers are commonly used for tribological applications, such as tires, bearings, and conveyor belts.
Different wear mechanisms occur depending on the mechanical properties of the polymer, the contact conditions, and the properties of the debris or transfer film formed during the wear process. To ensure that the polymers possess sufficient wear resistance under the service conditions, reliable and quantifiable tribological evaluation is necessary. Tribological evaluation allows us to quantitatively compare the wear behaviors of different polymers in a controlled and monitored manner to select the material candidate for the target application.
The Nanovea Tribometer offers repeatable wear and friction testing using ISO and ASTM compliant rotative and linear modes, with optional high-temperature wear and lubrication modules available in one pre-integrated system. This unmatched range allows users to simulate the different work environments of the polymers including concentrated stress, wear, and high temperature, etc.
MEASUREMENT OBJECTIVE
In this study, we showcased that the Nanovea Tribometer is an ideal tool for comparing the friction and wear resistance of different polymers in a well-controlled and quantitative manner.
TEST PROCEDURE
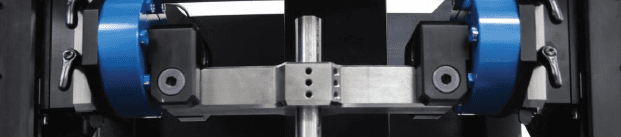
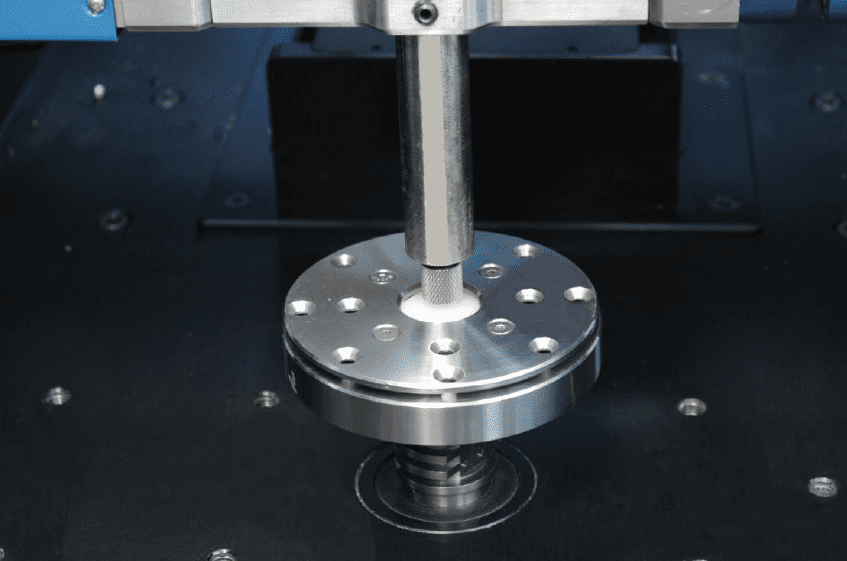
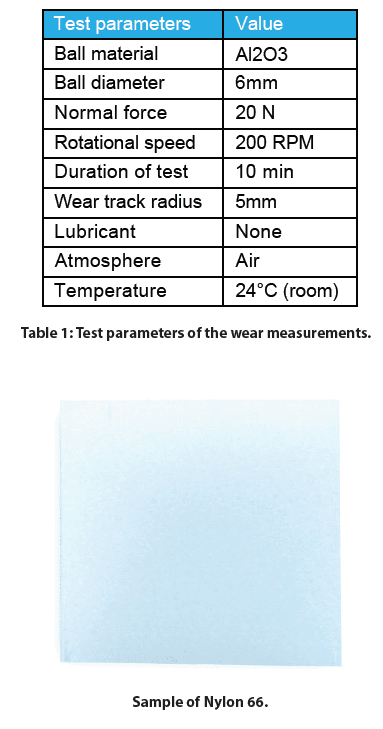
The coefficient of friction (COF) and the wear resistance of different common polymers were evaluated by the Nanovea Tribometer. An Al2O3 ball was used as the counter material (pin, static sample). The wear tracks on the polymers (dynamic rotating samples) were measured using a non-contact 3D profilometer and optical microscope after the tests concluded. It should be noted that a non-contact endoscopic sensor can be used to measure the depth the pin penetrates the dynamic sample during a wear test as an option. The test parameters are summarized in Table 1. The wear rate, K, was evaluated using the formula K=Vl(Fxs), where V is the worn volume, F is the normal load, and s is the sliding distance.
Please note that Al2O3 balls were used as the counter material in this study. Any solid material can be substituted to more closely simulate the performance of two specimens under actual application conditions.
RESULTS AND DISCUSSION
Wear rate is a vital factor for determining the service lifetime of the materials, while the friction plays a critical role during the tribological applications. Figure 2 compares the evolution of the COF for different polymers against the Al2O3 ball during the wear tests. COF works as an indicator of when failures occur and the wear process enters a new stage. Among the tested polymers, HDPE maintains the lowest constant COF of ~0.15 throughout the wear test. The smooth COF implies that a stable tribo-contact is formed.
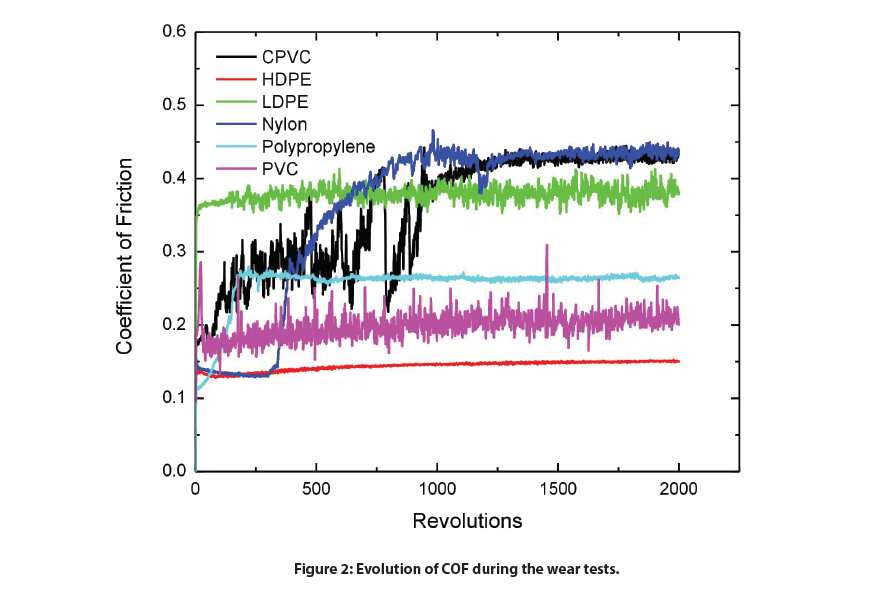
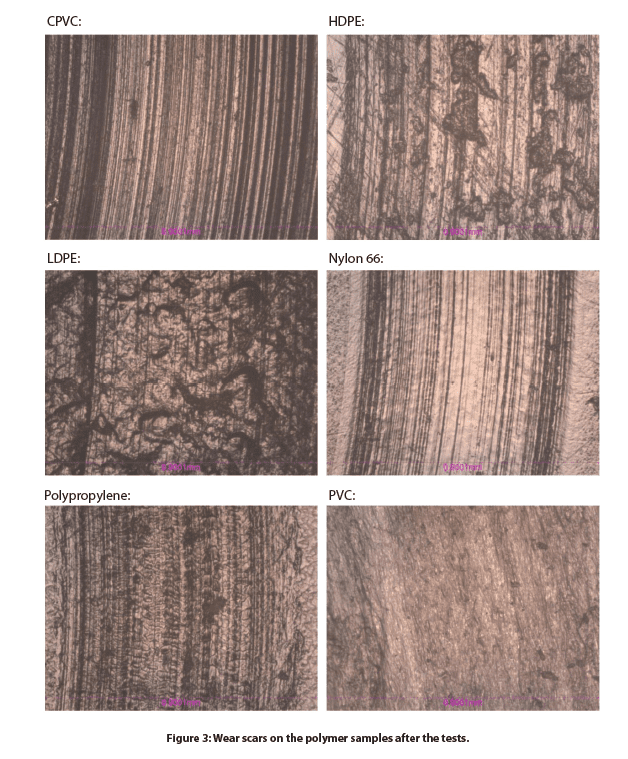
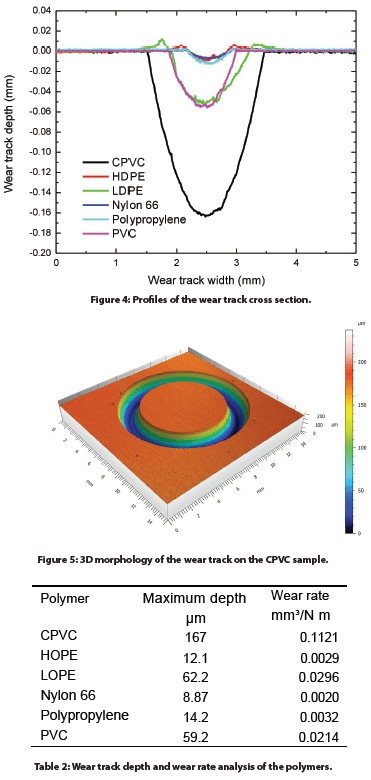
Figure 3 and Figure 4 compare the wear tracks of the polymer samples after the test is measured by the optical microscope. The In-situ non-contact 3D profilometer precisely determines the wear volume of the polymer samples, making it possible to accurately calculate wear rates of 0.0029, 0.0020, and 0.0032m3/N m, respectively. In comparison, the CPVC sample shows the highest wear rate of 0.1121m3/N m. Deep parallel wear scars are present in the wear track of CPVC.
CONCLUSION
The wear resistance of the polymers plays a vital role in their service performance. In this study, we showcased that the Nanovea Tribometer evaluates the coefficient of friction and wear rate of different polymers in a
well-controlled and quantitative manner. HDPE shows the lowest COF of ~0.15 among the tested polymers. HDPE, Nylon 66, and Polypropylene samples possess low wear rates of 0.0029, 0.0020 and 0.0032 m3/N m, respectively. The combination of low friction and great wear resistance makes HDPE a good candidate for polymer tribological applications.
The In-situ non-contact 3D profilometer enables precise wear volume measurement and offers a tool to analyze the detailed morphology of the wear tracks, providing more insight into the fundamental understanding of wear mechanisms

Honeycomb Panel Surface Finish with 3D Profilometry
INTRODUCTION
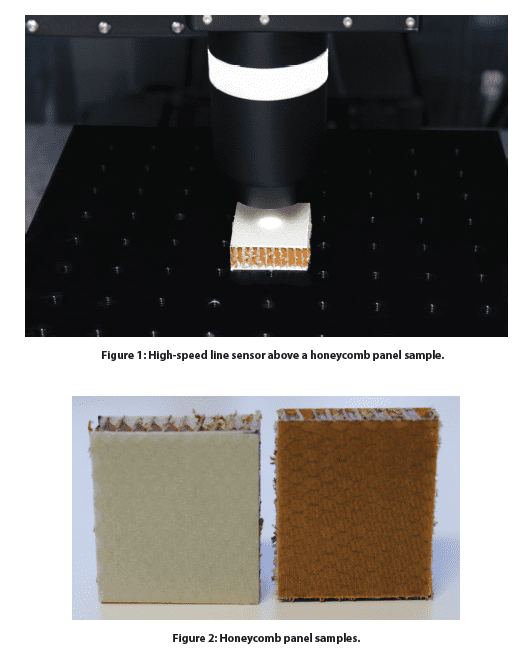
Roughness, porosity, and texture of the honeycomb panel surface are critical to quantify for the final panel design. These surface qualities can directly correlate to the aesthetics and functional characteristics of the panel surface. A better understanding of the surface texture and porosity can help optimize the panel surface processing and manufacturability. A quantitative, precise, and reliable surface measurement of the honeycomb panel is needed to control surface parameters for application and painting requirements. The Nanovea 3D Non-Contact sensors utilize unique chromatic confocal technology capable of precisely measuring these panel surfaces.
MEASUREMENT OBJECTIVE
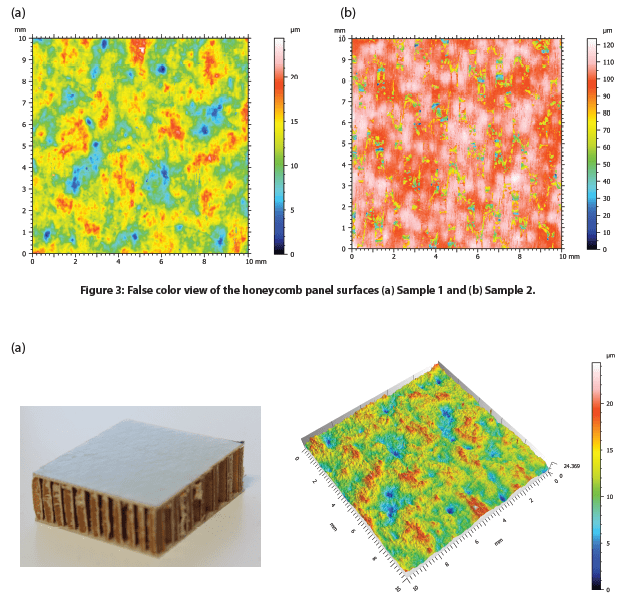
In this study, the Nanovea HS2000 platform equipped with a high-speed Line Sensor was used to measure and compare two honeycomb panels with different surface finishes. We showcase the Nanovea non-contact profilometer’s ability to provide fast and precise 3D profiling measurements and comprehensive in-depth analysis of the surface finish.
RESULTS AND DISCUSSION
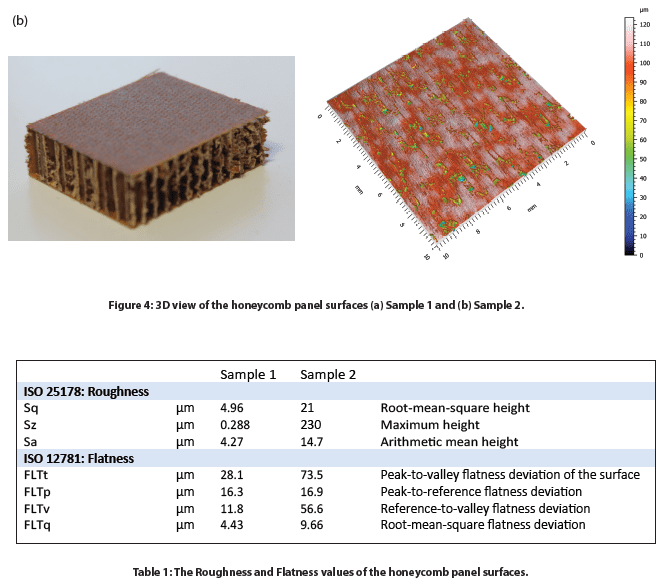
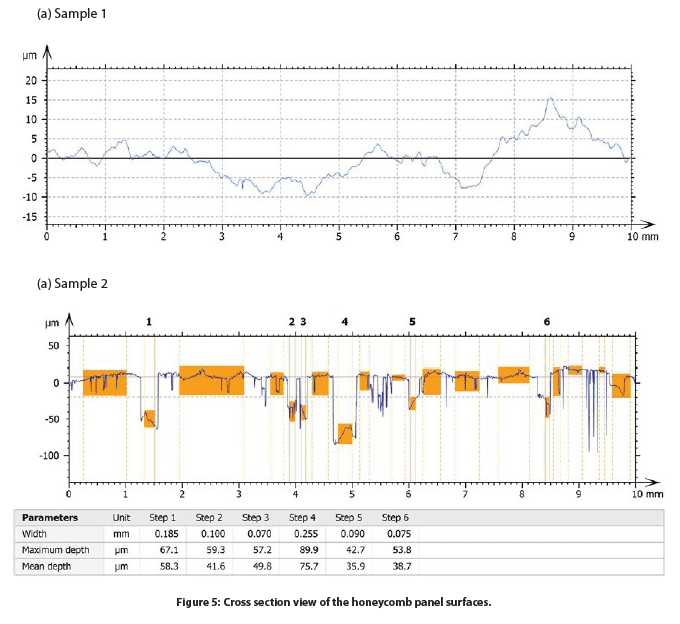
The surface of two honeycomb panel samples with varied surface finishes, namely Sample 1 and Sample 2, were measured. The false color and 3D view of the Samples 1 and 2 surfaces are shown in Figure 3 and Figure 4, respectively. The roughness and flatness values were calculated by advanced analysis software and are compared in Table 1. Sample 2 exhibits a more porous surface compared to Sample 1. As a result, Sample 2 possesses a higher roughness Sa of 14.7 µm, compared to an Sa value of 4.27 µm for Sample 1.
The 2D profiles of the honeycomb panel surfaces were compared in Figure 5, allowing users to have a visual comparison of the height change at different locations of the sample surface. We can observe that Sample 1 has a height variation of ~25 µm between the highest peak and lowest valley location. On the other hand, Sample 2 shows several deep pores across the 2D profile. The advanced analysis software has the ability to automatically locate and measure the depth of six relatively deep pores as shown in the table of Figure 4.b Sample 2. The deepest pore amongst the six possesses a maximum depth of nearly 90 µm (Step 4).
To further investigate the pore size and distribution of Sample 2, porosity evaluation was performed and discussed in the following section. The sliced view is displayed in Figure 5 and the results are summarized in Table 2. We can observe that the pores, marked in blue color in Figure 5, have a relatively homogeneous distribution on the sample surface. The projected area of the pores constitutes 18.9% of the whole sample surface. The volume per mm² of the total pores is ~0.06 mm³. The pores have an average depth of 42.2 µm, and the maximum depth is 108.1 µm.

CONCLUSION

In this application, we have showcased that the Nanovea HS2000 platform equipped with a high-speed Line Sensor is an ideal tool for analyzing and comparing the surface finish of honeycomb panel samples in a fast and accurate manner. The high-resolution profilometry scans paired with an advanced analysis software allow for a comprehensive and quantitative evaluation of the surface finish of honeycomb panel samples.
The data shown here represents only a small portion of the calculations available in the analysis software. Nanovea Profilometers measure virtually any surface for a wide range of applications in the Semiconductor, Microelectronic, Solar, Fiber Optics, Automotive, Aerospace, Metallurgy, Machining, Coatings, Pharmaceutical, Biomedical, Environmental and many other industries.
Understanding Coating Failures using Scratch Testing
Introduction:
Surface engineering of materials plays a significant role in a variety of functional applications, ranging from decorative appearance to protecting the substrates from wear, corrosion and other forms of attacks. An important and overriding factor that determines the quality and service lifetime of the coatings is their cohesive and adhesive strength.
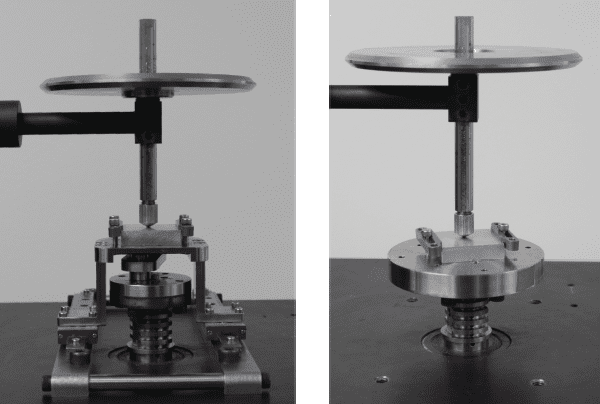
Rotative or Linear Wear & COF? (A Comprehensive Study Using the Nanovea Tribometer)
Wear is the process of removal and deformation of material on a surface as a result of the mechanical action of the opposite surface. It is influenced by a variety of factors, including unidirectional sliding, rolling, speed, temperature, and many others. The study of wear, tribology, spans many disciplines, from physics and chemistry to mechanical engineering and material science. The complex nature of wear requires isolated studies toward specific wear mechanisms or processes, such as adhesive wear, abrasive wear, surface fatigue, fretting wear, and erosive wear. However, “Industrial Wear” commonly involves multiple wear mechanisms occurring in synergy.
Linear reciprocating and Rotative (Pin on Disk) wear tests are two widely used ASTM-compliant setups for measuring sliding wear behaviors of materials. Since the wear rate value of any wear test method is often used to predict the relative ranking of material combinations, it is extremely important to confirm the repeatability of the wear rate measured using different test setups. This enables users to carefully consider the wear rate value reported in the literature, which is critical in understanding the tribological characteristics of materials.
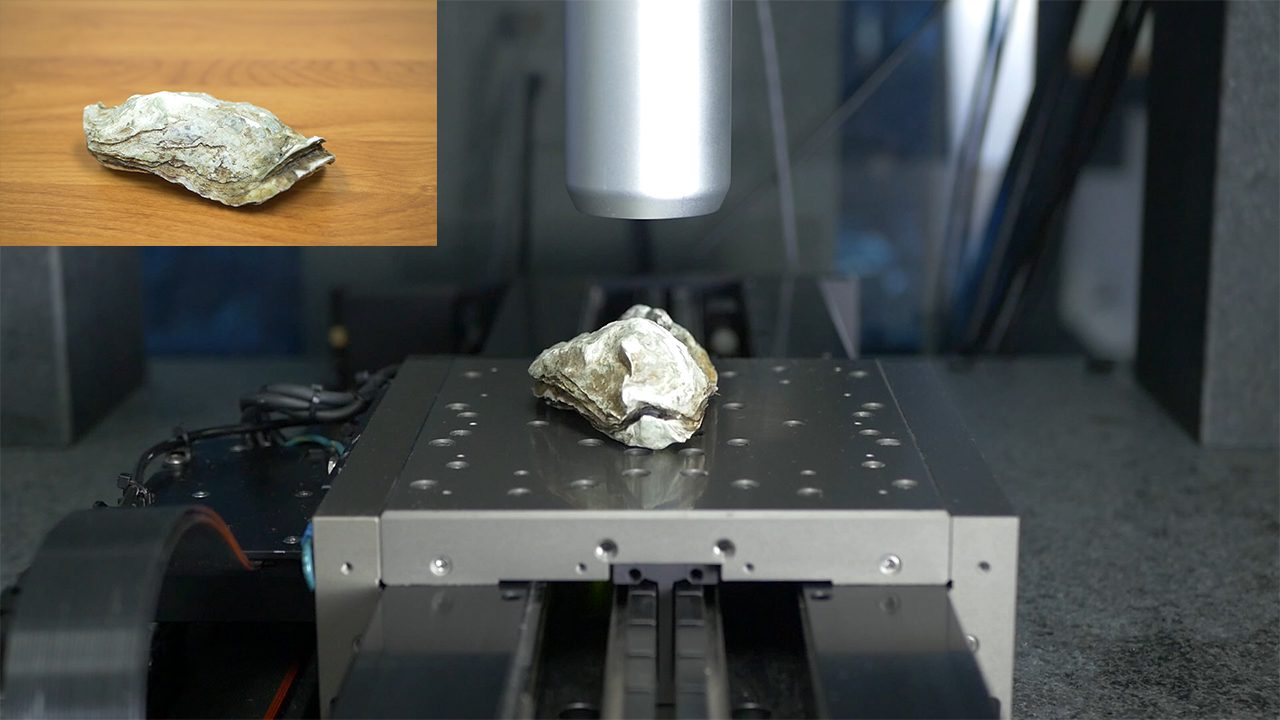
High Speed Characterization of an Oyster Shell
Large samples with complex geometries can prove difficult to work with due to sample preparation, size, sharp angles, and curvature. In this study an oyster shell will be scanned to demonstrate the Nanovea HS2000 Line Sensor’s capability to scan a large, biological sample with complex geometry. While a biological sample was used in this study, the same concepts can be applied to other samples.


Surface Finish Inspection of Wood Flooring
Importance of Profiling Wood Finishes
In various industries, the purpose of a wood finish is to protect the wooden surface from various types of damage such as chemical, mechanical or biological and/or provide a specific visual aesthetic. For manufacturers and buyers alike, quantifying surface characteristics of their wood finishes can be vital to the quality control or optimization of finishing processes for wood. In this application, we will explore the various surface features that can be quantified using a Nanovea 3D Non-Contact Profilometer.
Quantifying the amount of roughness and texture that exists on a wooden surface can be essential to know in order to ensure it can meet the requirements of its application. Refining the finishing process or checking the quality of wooden surfaces based on a quantifiable, repeatable and reliable surface inspection method would allow manufacturers to create controlled surface treatments and buyers the ability to inspect and select wood materials to meet their needs.
Measurement Objective
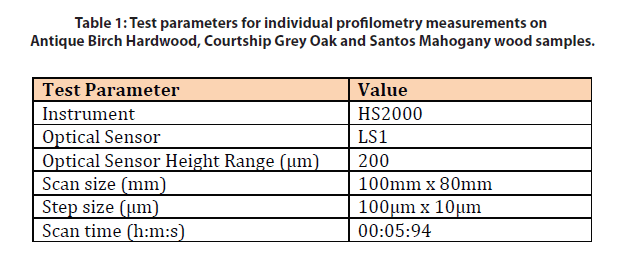
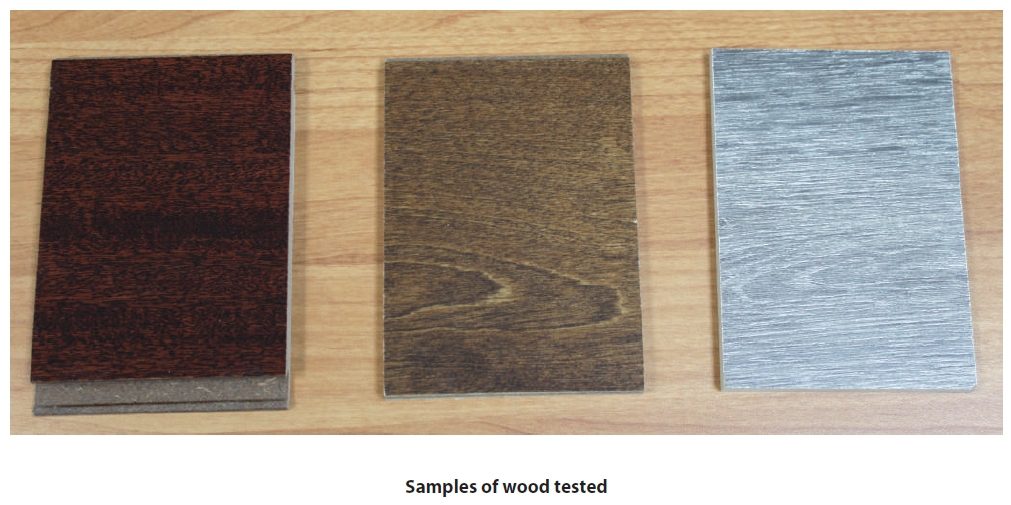
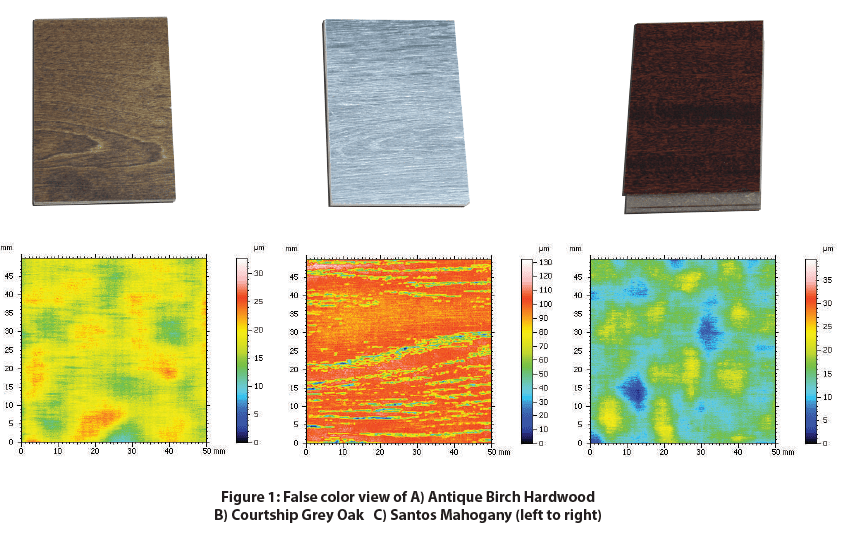
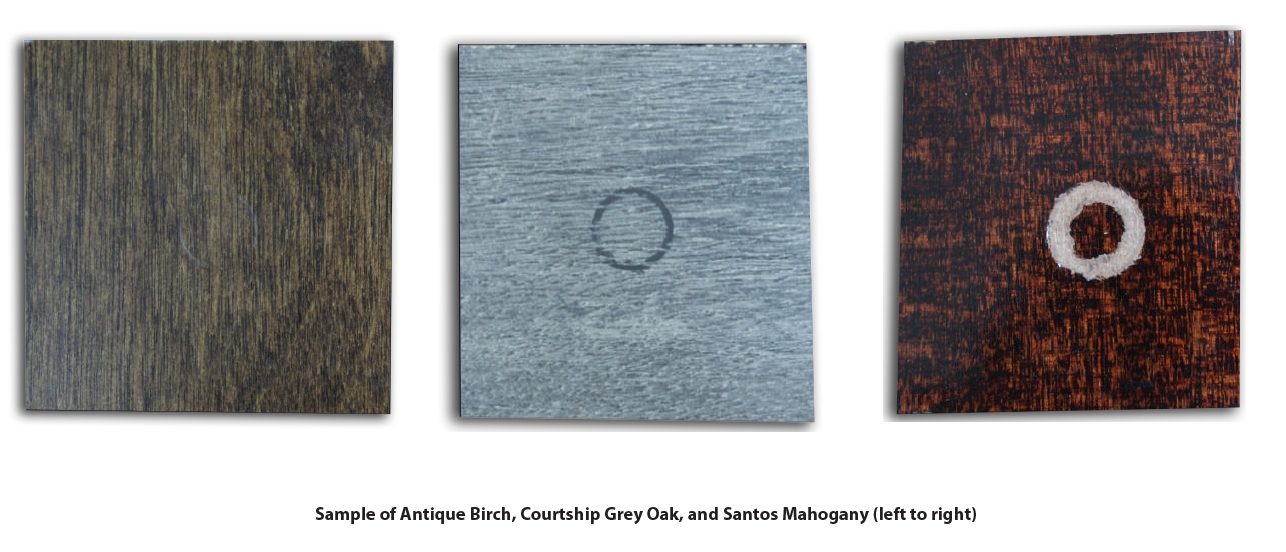
In this study, the high-speed Nanovea HS2000 profilometer equipped with a non-contact profiling line sensor was used to measure and compare the surface finish of three flooring samples: Antique Birch Hardwood, Courtship Grey Oak, and Santos Mahogany flooring. We showcase the capability of the Nanovea Non-Con-tact Profilometer in delivering both speed and precision when measuring three types of surface areas and a comprehensive in-depth analysis of the scans.
Test Procedure and Procedures
Results and Discussion
Sample description: Courtship Grey Oak and Santos Mahogany flooring are laminate flooring types. Courtship Grey Oak is a low gloss, textured slate gray sample with an EIR finish. Santos Mahogany is a high gloss, dark burgundy sample that was prefinished. Antique Birch Hardwood has a 7-layer aluminum oxide finish, providing everyday wear and tear protection.
Antique Birch Hardwood
Courtship Grey Oak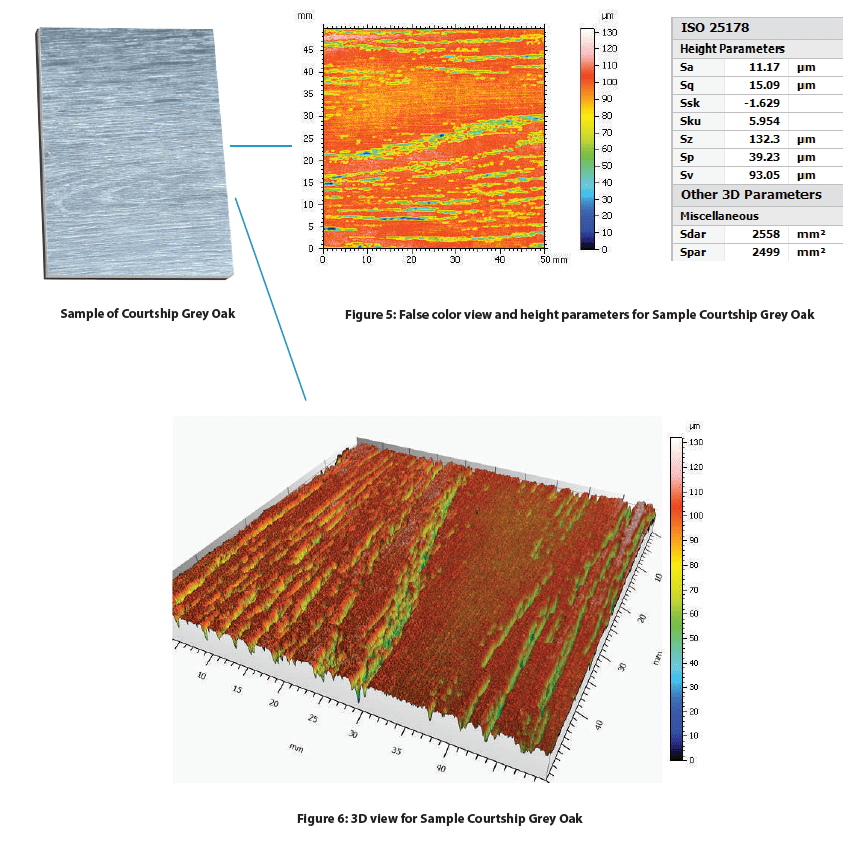
Santos Mahogany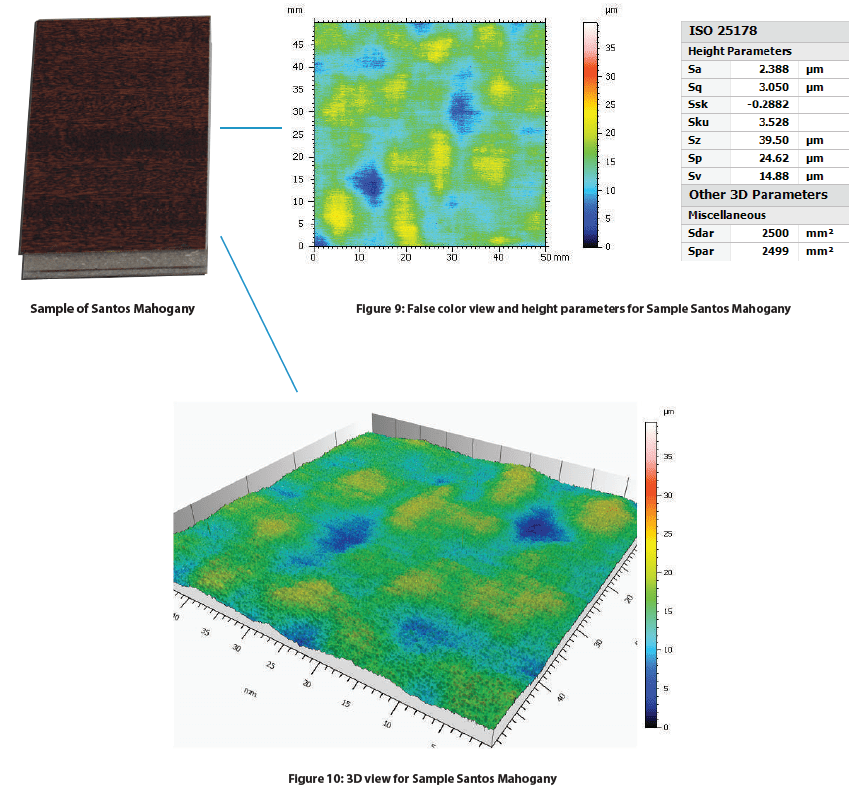

Discussion
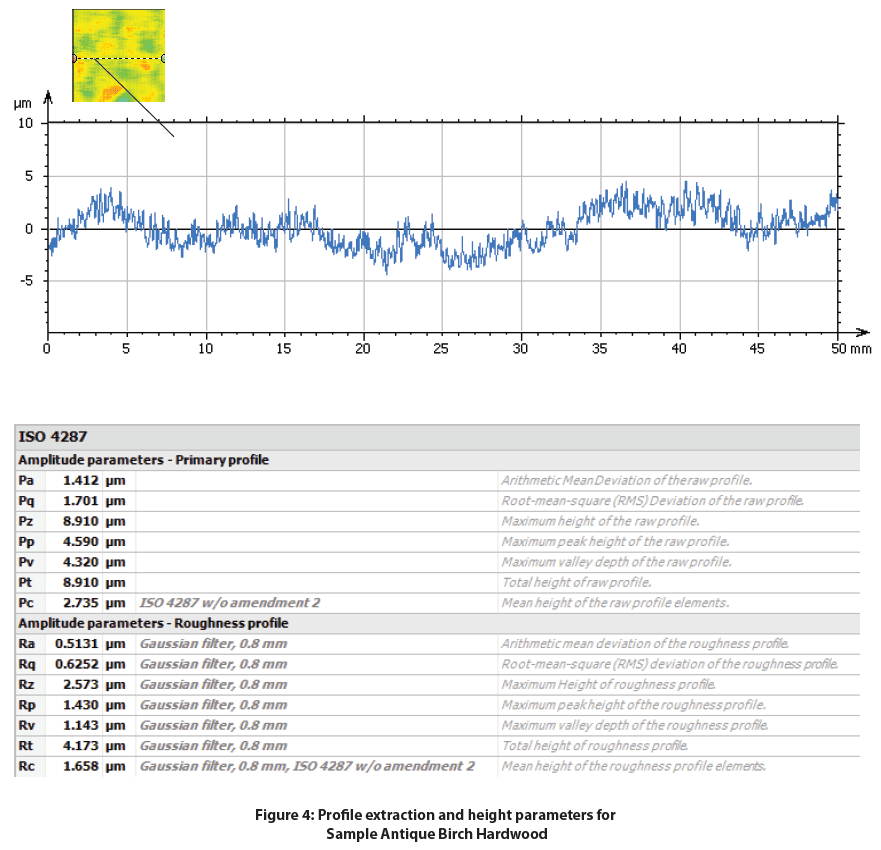
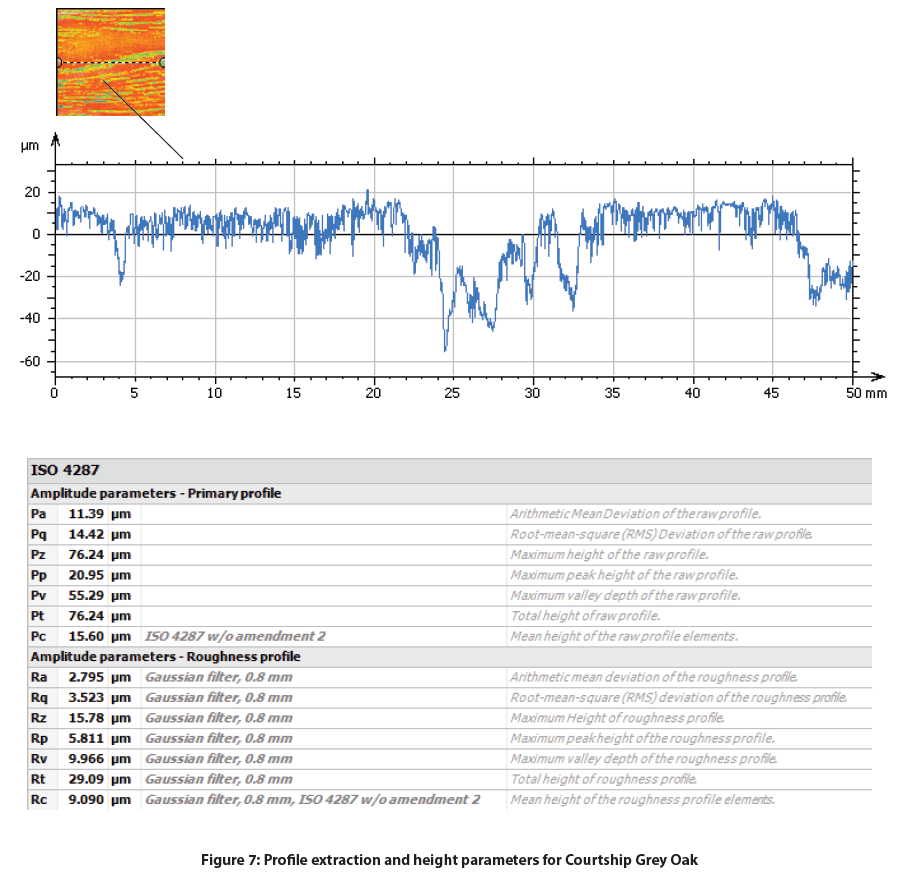
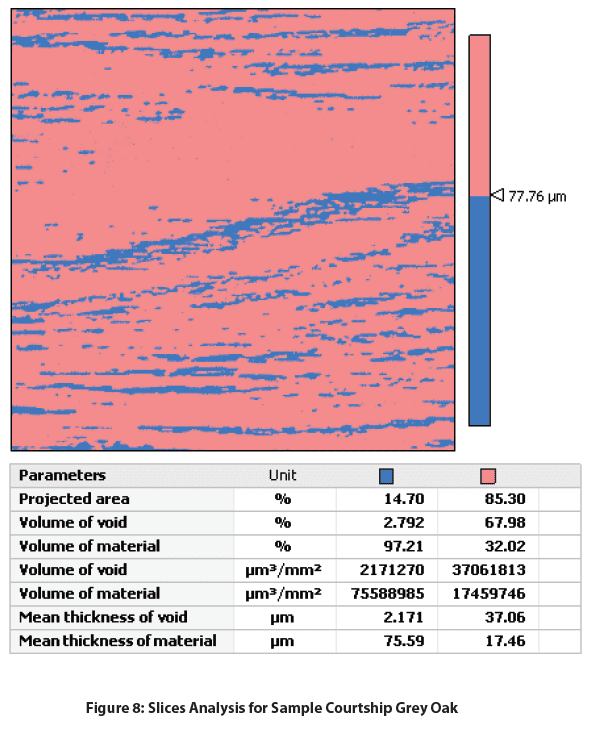
There is a clear distinction between all the samples’ Sa value. The smoothest was Antique Birch Hardwood with a Sa of 1.716 µm, followed by Santos Mahogany with a Sa of 2.388 µm, and significantly increasing for Courtship Grey Oak with a Sa of 11.17 µm. P-values and R-values are also common roughness values that can be used to assess the roughness of specific profiles along the surface. The Courtship Grey Oak possess-es a coarse texture full of crack-like features along the wood’s cellular and fiber direction. Additional analysis was done on the Courtship Grey Oak sample because of its textured surface. On the Courtship Grey Oak sample, slices were used to separate and calculate the depth and volume of the cracks from the flatter uniform surface.
Conclusion

In this application, we have shown how the Nanovea HS2000 high-speed profilometer can be used to inspect the surface finish of wood samples effectively and efficiently. Surface finish measurements can prove to be important to both manufactures and consumers of hardwood flooring in understanding how they can improve a manufacturing process or choose the appropriate product that performs best for a specific application.

Wood Wear Test with the Nanovea Tribometer
Importance of Comparing Wood Finish Wear & COF
Wood has been used for thousands of years as a building material for homes, furniture, and flooring. It has a combination of natural beauty, and durability, making it an ideal candidate for flooring. Unlike carpet, hardwood floors keep their color for a long time and can be easily cleaned and maintained, however, being a natural material, most wood flooring requires the application of a surface finish to protect the wood from various kinds of damage such as scuffing and chipping over time. In this study, a Nanovea Tribometer was used to measure the wear rate and coefficient of friction (COF) to better understand the comparative performance of three wood finishes.
The service behavior of a wood species used for flooring is often related to its wear resistance. The change in the individual cellular and fiber structure of different species of wood contributes to their different mechanical and tribological behaviors. Actual service tests of wood as flooring materials are expensive, difficult to duplicate, and require long periods of testing time. As a result, it becomes valuable to develop a simple wear test that can produce reliable, reproducible, and straight forward.
Measurement Objective
In this study, we simulated and compared the wear behaviors of three types of wood to showcase the capability of the Nanovea Tribometer in evaluating the tribological properties of wood in a controlled and monitored manner.
Discussion
Sample Description: Antique Birch Hardwood has a 7-layer aluminum oxide finish, providing everyday wear and tear protection. Courtship Grey Oak, & Santos Mahogany are both laminate flooring types that vary in surface finish and gloss. The Courtship Grey Oak is a slate gray color, EIR finish, and low gloss. On the other hand, Santos Mahogany is a dark burgundy color, prefinished, and high gloss which allows surface scratches and defects to be more easily hidden.
The evolution of COF during the wear tests of the three wood flooring samples are plotted in Fig. 1. The Antique Birch Hardwood, Courtship Grey Oak, & Santos Mahogany samples all showed different COF behavior.
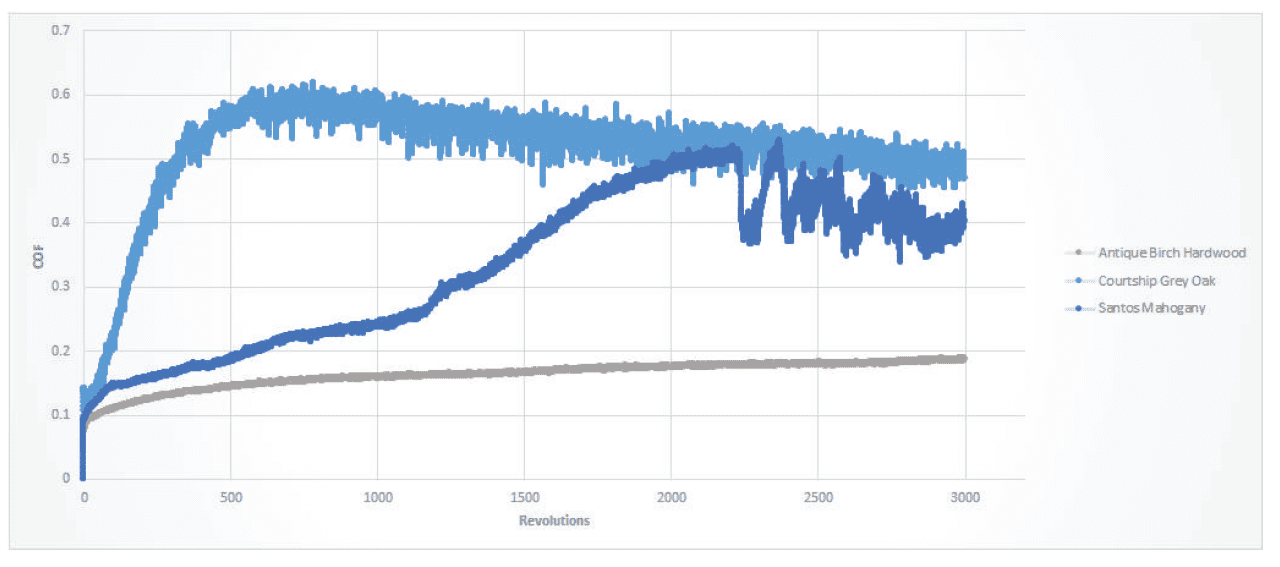
It can be observed in the graph above that Antique Birch Hardwood was the only sample that demonstrated a steady COF for the duration of an entire test. The Courtship Grey Oak’s sharp increase in COF and then gradual decrease could be indicative that the sample’s surface roughness largely contributed to its COF behavior. As the sample wore, the surface roughness decreased and became more homogenous which explains the decrease in COF as the sample surface became smoother from mechanical wear. The COF on Santos Mahogany displays a smooth gradual increase in COF at the beginning of the test and then transitioned abruptly into a choppy COF trend. This could indicate that once the laminate coating started to wear through, the steel ball (counter material) made contact with the wood substrate which wore in a quicker and turbulent manner creating the noisier COF behavior towards the end of the test.
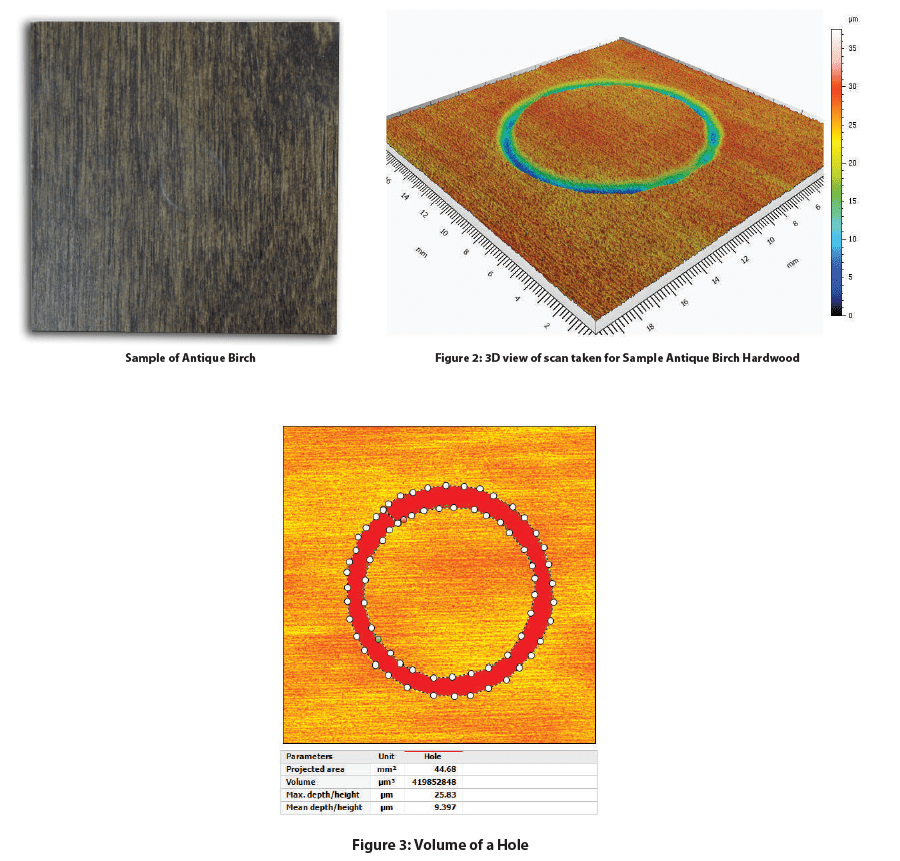
Antique Birch Hardwood:
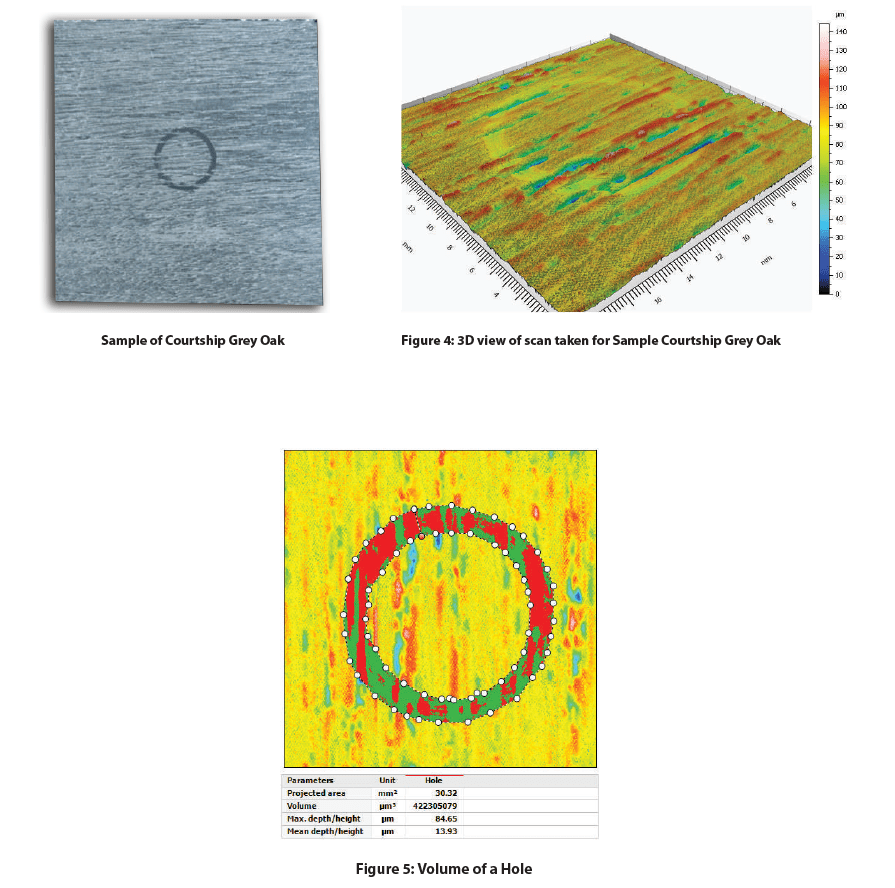
Courtship Grey Oak:
Santos Mahogany
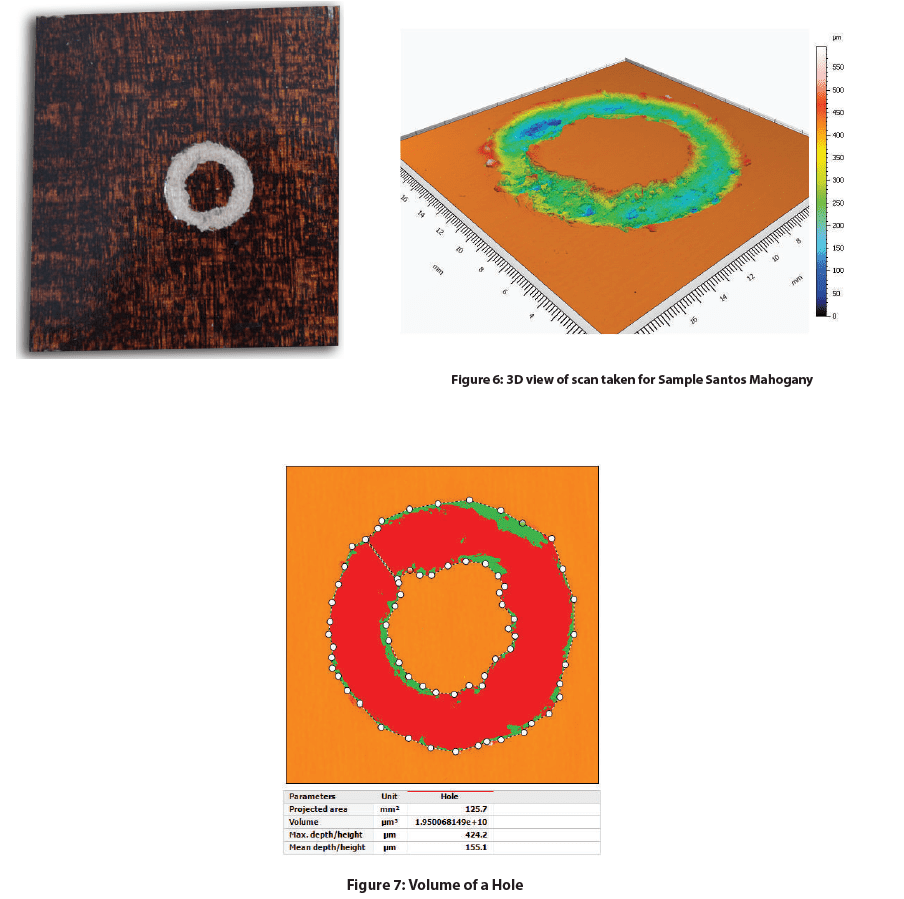
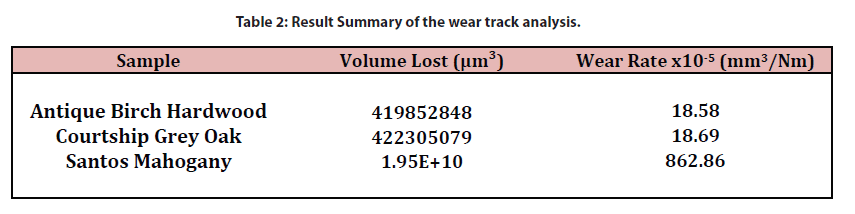
Table 2 summarizes the results of the wear track scans and analysis on all wood flooring samples after the wear tests were performed. Detailed information and images for each sample can be seen in Figures 2-7. Based on the Wear Rate comparison between all three samples, we can deduct that Santos Mahogany proved to be less resilient to mechanical wear than the other two samples. Antique Birch Hardwood and Courtship Grey Oak had very similar wear rates although their wear behavior during their tests differed significantly. Antique Birch Hardwood had a gradual and more uniform wear trend while Court-ship Grey Oak showed a shallow and pitted wear track due to the pre-existing surface texture and finish
Conclusion

In this study, we showcased the capacity of Nanovea’s Tribometer in evaluating the coefficient of friction and wear resistance of three types of wood, Antique Birch Hardwood, Courtship Grey Oak, and Santos Mahogany in a controlled and monitored manner. The superior mechanical properties of the Antique Birch Hardwood leads to its better wear resistance. The texture and homogeneity of the wood surface play an important role in the wear behavior. The Courtship Grey Oak surface texture such as gaps or cracks between the wood cell fibers may become the weak spots where the wear initiates and propagates.


