
INTRODUCTION
Roughness, porosity, and texture of the honeycomb panel surface are critical to quantify for the final panel design. These surface qualities can directly correlate to the aesthetics and functional characteristics of the panel surface. A better understanding of the surface texture and porosity can help optimize the panel surface processing and manufacturability. A quantitative, precise, and reliable surface measurement of the honeycomb panel is needed to control surface parameters for application and painting requirements. The Nanovea 3D Non-Contact sensors utilize unique chromatic confocal technology capable of precisely measuring these panel surfaces.
MEASUREMENT OBJECTIVE
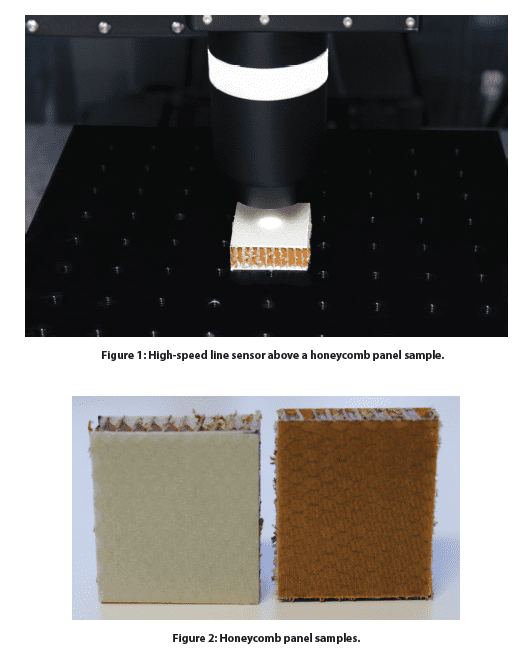
In this study, the Nanovea HS2000 platform equipped with a high-speed Line Sensor was used to measure and compare two honeycomb panels with different surface finishes. We showcase the Nanovea non-contact profilometer’s ability to provide fast and precise 3D profiling measurements and comprehensive in-depth analysis of the surface finish.
RESULTS AND DISCUSSION
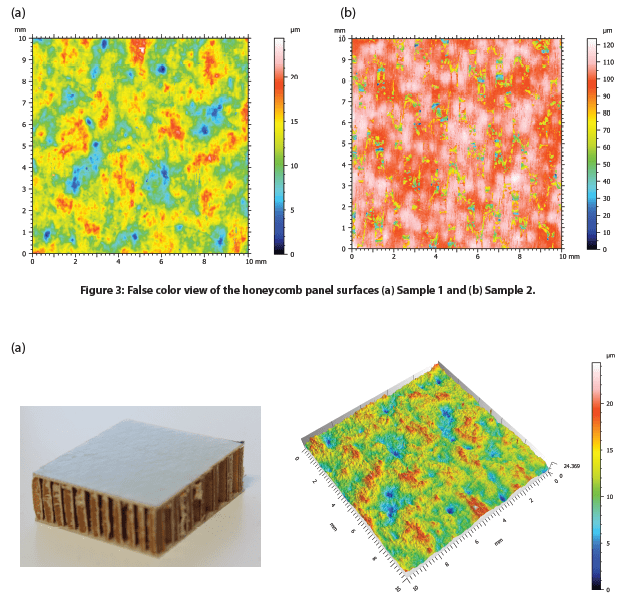
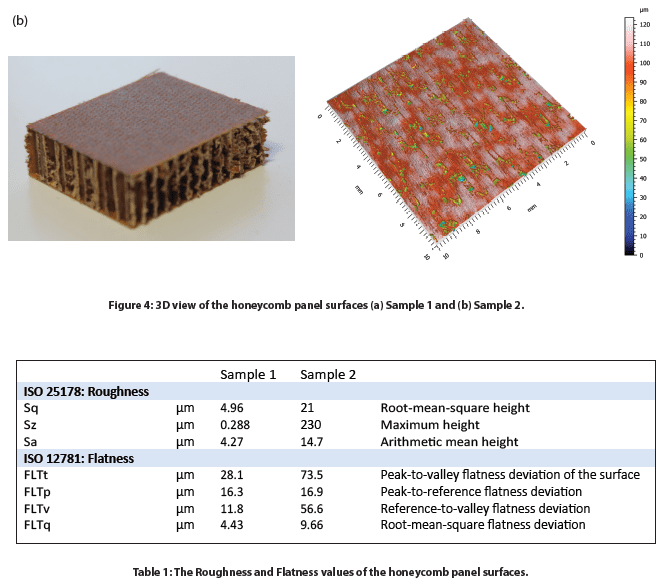
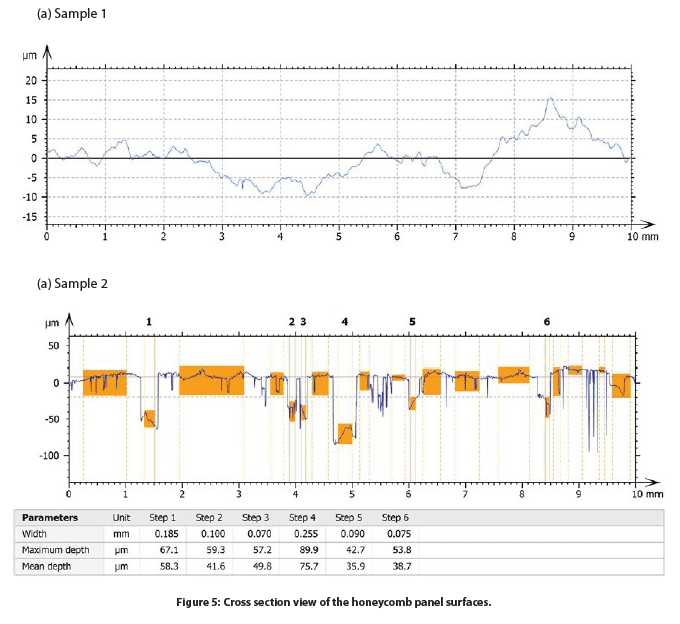
The surface of two honeycomb panel samples with varied surface finishes, namely Sample 1 and Sample 2, were measured. The false color and 3D view of the Samples 1 and 2 surfaces are shown in Figure 3 and Figure 4, respectively. The roughness and flatness values were calculated by advanced analysis software and are compared in Table 1. Sample 2 exhibits a more porous surface compared to Sample 1. As a result, Sample 2 possesses a higher roughness Sa of 14.7 µm, compared to an Sa value of 4.27 µm for Sample 1.
The 2D profiles of the honeycomb panel surfaces were compared in Figure 5, allowing users to have a visual comparison of the height change at different locations of the sample surface. We can observe that Sample 1 has a height variation of ~25 µm between the highest peak and lowest valley location. On the other hand, Sample 2 shows several deep pores across the 2D profile. The advanced analysis software has the ability to automatically locate and measure the depth of six relatively deep pores as shown in the table of Figure 4.b Sample 2. The deepest pore amongst the six possesses a maximum depth of nearly 90 µm (Step 4).
To further investigate the pore size and distribution of Sample 2, porosity evaluation was performed and discussed in the following section. The sliced view is displayed in Figure 5 and the results are summarized in Table 2. We can observe that the pores, marked in blue color in Figure 5, have a relatively homogeneous distribution on the sample surface. The projected area of the pores constitutes 18.9% of the whole sample surface. The volume per mm² of the total pores is ~0.06 mm³. The pores have an average depth of 42.2 µm, and the maximum depth is 108.1 µm.

CONCLUSION

In this application, we have showcased that the Nanovea HS2000 platform equipped with a high-speed Line Sensor is an ideal tool for analyzing and comparing the surface finish of honeycomb panel samples in a fast and accurate manner. The high-resolution profilometry scans paired with an advanced analysis software allow for a comprehensive and quantitative evaluation of the surface finish of honeycomb panel samples.
The data shown here represents only a small portion of the calculations available in the analysis software. Nanovea Profilometers measure virtually any surface for a wide range of applications in the Semiconductor, Microelectronic, Solar, Fiber Optics, Automotive, Aerospace, Metallurgy, Machining, Coatings, Pharmaceutical, Biomedical, Environmental and many other industries.


