USA/GLOBAL: +1-949-461-9292
EUROPE: +39-011-3052-794
CONTACT US

Piston Wear Testing

Piston Wear Testing

Using a Tribometer

Prepared by

FRANK LIU

INTRODUCTION

Friction loss accounts for approximately 10% of total energy in fuel for a diesel engine[1]. 40-55% of the friction loss comes from the power cylinder system. The loss of energy from friction can be diminished with better understanding of the tribological interactions occurring in the power cylinder system.

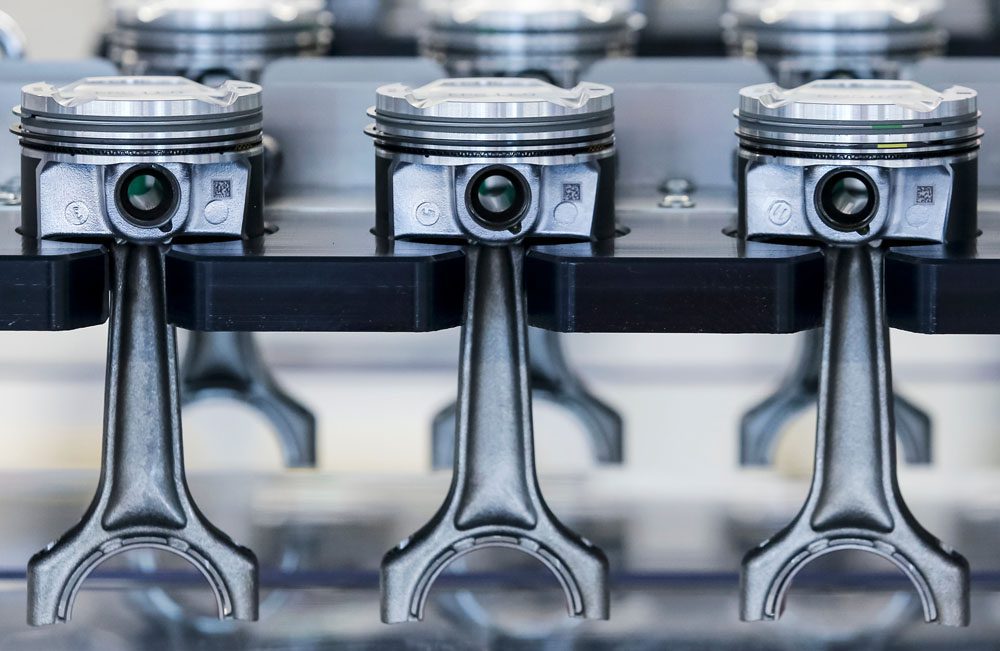
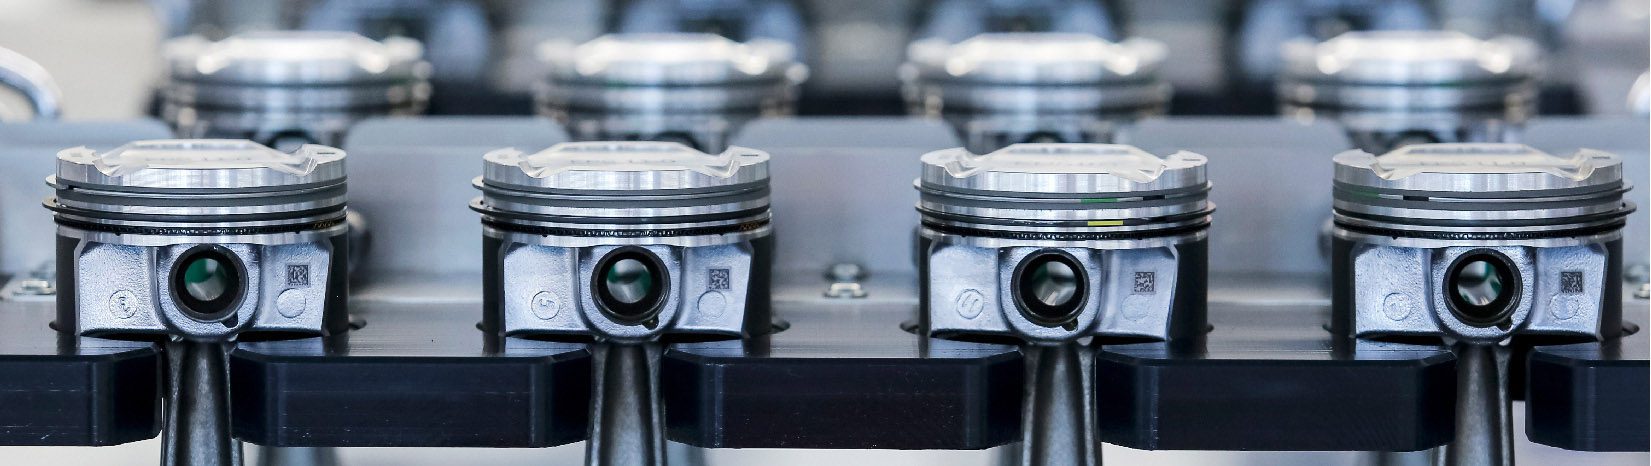
A significant portion of the friction loss in the power cylinder system stems from the contact between the piston skirt and the cylinder liner. The interaction between the piston skirt, lubricant, and cylinder interfaces is quite complex due to the constant changes in force, temperature, and speed in a real life engine. Optimizing each factor is key to obtaining optimal engine performance. This study will focus on replicating the mechanisms causing friction forces and wear at the piston skirt-lubricant-cylinder liner (P-L-C) interfaces.

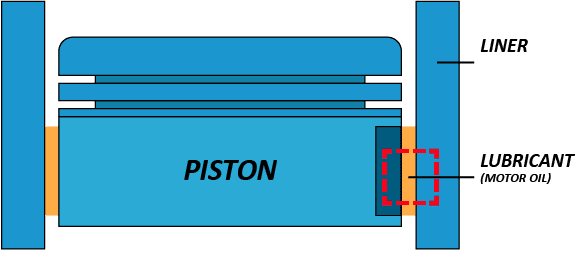
 Schematic of power cylinders system and piston skirt-lubricant-cylinder liner interfaces.

[1] Bai, Dongfang. Modeling piston skirt lubrication in internal combustion engines. Diss. MIT, 2012

IMPORTANCE OF TESTING PISTONS WITH TRIBOMETERS

Motor oil is a lubricant that is well-designed for its application. In addition to the base oil, additives such as detergents, dispersants, viscosity improver (VI), anti-wear/anti-friction agents, and corrosion inhibitors are added to improve its performance. These additives affect how the oil behaves under different operating conditions. The behavior of oil affects the P-L-C interfaces and determines if significant wear from metal-metal contact or if hydrodynamic lubrication (very little wear) is occurring.

It is difficult to understand the P-L-C interfaces without isolating the area from external variables. It is more practical to simulate the event with conditions that are representative of its real-life application. The NANOVEA Tribometer is ideal for this. Equipped with multiple force sensors, depth sensor, a drop-by-drop lubricant module, and linear reciprocating stage, the NANOVEA T2000 is able to closely mimic events occurring within an engine block and obtain valuable data to better understand the P-L-C interfaces.

Liquid Module on the NANOVEA T2000 Tribometer

The drop-by-drop module is crucial for this study. Since pistons can move at a very fast rate (above 3000 rpm), it is difficult to create a thin film of lubricant by submerging the sample. To remedy this issue, the drop-by-drop module is able to consistently apply a constant amount of lubricant onto the piston skirt surface.

Application of fresh lubricant also removes concern of dislodged wear contaminants influencing the lubricant’s properties.

NANOVEA T2000

High Load Tribometer

MEASUREMENT OBJECTIVE

The piston skirt-lubricant-cylinder liner interfaces will be studied in this report. The interfaces will be replicated by conducting a linear reciprocating wear test with drop-by-drop lubricant module.

The lubricant will be applied at room temperature and heated conditions to compare cold start and optimal operation conditions. The COF and wear rate will be observed to better understand how the interfaces behaves in real-life applications.

TEST PARAMETERS

for tribology testing on pistons

LOAD ………………………. 100 N

TEST DURATION ………………………. 30 min

SPEED ………………………. 2000 rpm

AMPLITUDE ………………………. 10 mm

TOTAL DISTANCE ………………………. 1200 m

SKIRT COATING ………………………. Moly-graphite

PIN MATERIAL ………………………. Aluminum Alloy 5052

PIN DIAMETER ………………………. 10 mm

LUBRICANT ………………………. Motor Oil (10W-30)

APPROX. FLOW RATE ………………………. 60 mL/min

TEMPERATURE ………………………. Room temp & 90°C

LINEAR RECIPROCATING TEST RESULTS

In this experiment, A5052 was used as the counter material. While engine blocks are usually made of cast aluminum such as A356, A5052 have mechanical properties similar to A356 for this simulative testing [2].

Under the testing conditions, significant wear was
observed on the piston skirt at room temperature
compared to at 90°C. The deep scratches seen on the samples suggest that contact between the static material and the piston skirt occurs frequently throughout the test. The high viscosity at room temperature may be restricting the oil from completely filling gaps at the interfaces and creating metal-metal contact. At higher temperature, the oil thins and is able to flow between the pin and the piston. As a result, significantly less wear is observed at higher temperature. FIGURE 5 shows one side of the wear scar wore significantly less than the other side. This is most likely due to the location of the oil output. The lubricant film thickness was thicker on one side than the other, causing uneven wearing.


[2] “5052 Aluminum vs 356.0 Aluminum.” MakeItFrom.com, makeitfrom.com/compare/5052-O-Aluminum/A356.0-SG70B-A13560-Cast-Aluminum

The COF of linear reciprocating tribology tests can be split into a high and low pass. High pass refers to the sample moving in the forward, or positive, direction and low pass refers to the sample moving in the reverse, or negative, direction. The average COF for the RT oil was observed to be under 0.1 for both directions. The average COF between passes were 0.072 and 0.080. The average COF of the 90°C oil was found to be different between passes. Average COF values of 0.167 and 0.09 were observed. The difference in COF gives additional proof that the oil was only able to properly wet one side of the pin. High COF was obtained when a thick film was formed between the pin and the piston skirt due to hydrodynamic lubrication occurring. Lower COF is observed in the other direction when mixed lubrication is occurring. For more information on hydrodynamic lubrication and mixed lubrication, please visit our application note on Stribeck Curves.

Table 1: Results from lubricated wear test on pistons.

FIGURE 1: COF graphs for room temperature oil wear test A raw profile B high pass C low pass.

FIGURE 2: COF graphs for 90°C wear oil test A raw profile B high pass C low pass.

FIGURE 3: Optical image of wear scar from RT motor oil wear test.

FIGURE 4: Volume of a hole analysis of wear scar from RT motor oil wear test.

FIGURE 5: Profilometry scan of wear scar from RT motor oil wear test.

FIGURE 6: Optical image of wear scar from 90°C motor oil wear test

FIGURE 7: Volume of a hole analysis of wear scar from 90°C motor oil wear test.

FIGURE 8: Profilometry scan of wear scar from 90°C motor oil wear test.

CONCLUSION

Lubricated linear reciprocating wear testing was conducted on a piston to simulate events occurring in a
real-life operational engine. The piston skirt-lubricant-cylinder liner interfaces is crucial to the operations of an engine. The lubricant thickness at the interface is responsible for energy loss due to friction or wear between the piston skirt and cylinder liner. To optimize the engine, the film thickness must be as thin as possible without allowing the piston skirt and cylinder liner to touch. The challenge, however, is how changes in temperature, speed, and force will affect the P-L-C interfaces.

With its wide range of loading (up to 2000 N) and speed (up to 15000 rpm), the NANOVEA T2000 tribometer is able to simulate different conditions possible in an engine. Possible future studies on this topic include how the P-L-C interfaces will behave under different constant load, oscillated load, lubricant temperature, speed, and lubricant application method. These parameters can be easily adjusted with the NANOVEA T2000 tribometer to give a complete understanding on the mechanisms of the piston skirt-lubricant-cylinder liner interfaces.

NOW, LET'S TALK ABOUT YOUR APPLICATION

Organic Surface Topography using Portable 3D Profilometer


ORGANIC SURFACE TOPOGRAPHY

USING PORTABLE 3D PROFILOMETER

Prepared by

CRAIG LEISING

INTRODUCTION

Nature has become a vital pool of inspiration for the development of improved surface structure. Understanding the surface structures found in nature has led to adhesion studies based on gecko’s feet, resistance studies based on a sea cucumbers textural change and repellency studies based from leaves, among many others. These surfaces have a number of potential applications from biomedical to clothing and automotive. For any of these surface breakthroughs to be successful, fabrication techniques must be developed so surface characteristics can be mimicked and reproduced. It is this process that will require identification and control.

IMPORTANCE OF PORTABLE 3D NON-CONTACT OPTICAL PROFILER FOR ORGANIC SURFACES

Utilizing Chromatic Light technology, the NANOVEA Jr25 Portable Optical Profiler has superior capability to measure nearly any material. That includes the unique and steep angles, reflective and absorbing surfaces found within natures broad range of surface characteristics. 3D non-contact measurements provide a full 3D image to give a more complete understanding of surface features. Without 3D capabilities, identification of nature’s surfaces would be solely relying on 2D information or microscope imaging, which does not provide sufficient information to properly mimic the surface studied. Understanding the full range of the surface characteristics including texture, form, dimension, among many others, will be critical to successful fabrication.

The ability to easily obtain lab-quality results in the field opens the door for new research opportunities.

MEASUREMENT OBJECTIVE

In this application, the NANOVEA Jr25 is used to measure the surface of a leaf. There is an endless list of surface parameters that can be automatically calculated after the 3D surface scan.

Here we will review the 3D surface and select
areas of interest to further analyze, including
quantifying and investigating the surface roughness, channels and topography

NANOVEA

JR25

TEST CONDITIONS

FURROW DEPTH

Mean density of furrows: 16.471 cm/cm2
Mean depth of furrows: 97.428 μm
Maximum depth: 359.769 μm

CONCLUSION

In this application, we have shown how the NANOVEA Jr25 portable 3D Non-Contact Optical Profiler can precisely characterize both the topography and the nanometer scale details of a leaf surface in the field. From these 3D surface measurements, areas of interest can quickly be identified and then analyzed with a list of endless studies (Dimension, Roughness Finish Texture, Shape Form Topography, Flatness Warpage Planarity, Volume Area, Step-Height and others). A 2D cross section can be easily chosen to analyze further details. With this information organic surfaces can be broadly investigated with a complete set of surface measurement resources. Special areas of interest could have been further analyzed with integrated AFM module on table top models.

NANOVEA also offers portable high-speed profilometers for field research and a wide range of lab-based systems, as well as provides laboratory services.

NOW, LET'S TALK ABOUT YOUR APPLICATION

Adhesion Properties of Gold Coating on Quartz Crystal Substrate


Adhesion Properties of Gold Coating

on Quartz Crystal Substrate

Prepared by

DUANJIE LI, PhD

INTRODUCTION

The Quartz Crystal Microbalance (QCM) is an extremely sensitive mass sensor capable of making precise measurements of small mass in the nanogram range. QCM measures the mass change on the surface through detecting variations in resonance frequency of the quartz crystal with two electrodes affixed to each side of the plate. The capacity of measuring extreme small weight makes it a key component in a variety of research and industrial instruments to detect and monitor the variation of mass, adsorption, density, and corrosion, etc.

IMPORTANCE OF SCRATCH TEST FOR QCM

As an extremely accurate device, the QCM measures the mass change down to 0.1 nanogram. Any mass loss or delamination of the electrodes on the quartz plate will be detected by the quartz crystal and cause significant measurement errors. As a result, the intrinsic quality of the electrode coating and the interfacial integrity of the coating/substrate system play an essential role in performing accurate and repeatable mass measurement. The Micro scratch test is a widely used comparative measurement to evaluate the relative cohesion or adhesion properties of coatings based on comparison of the critical loads at which failures appear. It is a superior tool for reliable quality control of QCMs.

MEASUREMENT OBJECTIVE

In this application, the NANOVEA Mechanical Tester, in Micro Scratch Mode, is used to evaluate the cohesive & adhesive strength of the gold coating on the quartz substrate of a QCM sample. We would like to showcase the capacity of the NANOVEA Mechanical Tester in performing micro scratch tests on a delicate sample with high precision and repeatability.

NANOVEA

PB1000

TEST CONDITIONS

The NANOVEA PB1000 Mechanical Tester was used to perform the micro scratch tests on a QCM sample using the test parameters summarized below. Three scratches were performed to ensure reproducibility of the results.

LOAD TYPE: Progressive

INITIAL LOAD

0.01 N

FINAL LOAD

30 N

ATMOSPHERE: Air 24°C

SLIDING SPEED

2 mm/min

SLIDING DISTANCE

2 mm

RESULTS & DISCUSSION

The full micro scratch track on the QCM sample is shown in FIGURE 1. The failure behaviors at different critical loads are displayed in FIGURE 2, where critical load, LC1 is defined as the load at which the first sign of adhesive failure occurs in the scratch track, LC2 is the load after which repetitive adhesive failures take place, and LC3 is the load at which the coating is completely removed from the substrate. It can be observed that little chipping takes place at LC1 of 11.15 N, the first sign of coating failure. 

As the normal load continues to increase during the micro scratch test, repetitive adhesive failures occur after LC2 of 16.29 N. When LC3 of 19.09 N is reached, the coating completely delaminates from the quartz substrate. Such critical loads can be used to quantitatively compare the cohesive and adhesive strength of the coating and select the best candidate for targeted applications.

FIGURE 1: Full micro scratch track on the QCM sample.

FIGURE 2: Micro scratch track at different critical loads.

FIGURE 3 plots the evolution of friction coefficient and depth that may provide more insight in the progression of coating failures during the micro scratch test.

FIGURE 3: Evolution of COF and Depth during the micro scratch test.

CONCLUSION

In this study, we showcased that the NANOVEA Mechanical Tester performs reliable and accurate micro scratch tests on a QCM sample. By applying linearly increased loads in a controlled and closely monitored fashion, the scratch measurement allows users to identify the critical load at which typical cohesive and adhesive coating failure occurs. It provides a superior tool to quantitatively evaluate and compare the intrinsic quality of the coating and the interfacial integrity of the coating/substrate system for QCM.

The Nano, Micro or Macro modules of the NANOVEA Mechanical Tester all include ISO and ASTM compliant indentation, scratch and wear tester modes, providing the widest and most user friendly range of testing available in a single system. NANOVEA‘s unmatched range is an ideal solution for determining the full range of mechanical properties of thin or thick, soft or hard coatings, films and substrates, including hardness, Young’s modulus, fracture toughness, adhesion, wear resistance and many others.

In addition, an optional 3D non-contact profiler and AFM module are available for high resolution 3D imaging of indentation, scratch and wear track in addition to other surface measurements, such as roughness and warpage.

NOW, LET'S TALK ABOUT YOUR APPLICATION

The World’s Leading Micro Mechanical Tester


NOW THE WORLD'S LEADING

MICRO MECHANICAL TESTING

Prepared by

PIERRE LEROUX & DUANJIE LI, PhD

INTRODUCTION

Standard Vickers Micro Hardness Testers have usable load ranges from 10 to 2000 gram force (gf). Standard Vickers Macro Hardness Testers load from 1 to 50 Kgf. These instruments are not only very limited in range of loads but they are also inaccurate when dealing with rougher surfaces or low loads when indents become too small to be measured visually. These limitations are intrinsic to older technology and as a result, instrumented indentation is becoming the standard choice due to the higher accuracy and performance it brings.

With NANOVEA’s world leading micro mechanical testing systems, Vickers hardness is automatically calculated from depth versus load data with the widest load range on a single module ever available (0.3 grams to 2 Kg or 6 grams to 40 Kg). Because it measures hardness from depth versus load curves, the NANOVEA Micro Module can measure any type of materials including very elastic ones. It also can provide not only Vickers hardness but also accurate elastic modulus and creep data in addition to other types of test such as scratch adhesion testing, wear, fatigue testing, yield strength and fracture toughness for a complete range of quality control data.

NOW THE WORLD'S LEADING MICRO MECHANICAL TESTING

In this applications note, it will be explained how the Micro Module has been designed to offer the world’s leading instrumented indentation and scratch testing. The Micro Module’s wide range testing capability is ideal for many applications. For example, the load range allows for accurate hardness and elastic modulus measurements of thin hard coatings and can then apply much higher loads to measure the adhesion of these same coatings.

MEASUREMENT OBJECTIVE

The capacity of the Micro Module is showcased with the NANOVEA CB500 Mechanical Tester by
performing both indentation and scratch tests with superior precision and reliability using a wide load range from 0.03 to 200 N.

NANOVEA

CB500

TEST CONDITIONS

A series (3×4, 12 indents in total) of Microindentations were performed on a standard steel sample using a Vickers indenter. The load and depth were measured and recorded for the complete indentation test cycle. The indentations were performed to different maximum loads ranging from 0.03 N to 200 N (0.0031 to 20.4 kgf) to showcase the capacity of the micro module in performing accurate indentation tests at different loads. It is worth noting that an optional load cell of 20 N is also available to provide 10 times higher resolution for tests in the lower load range from 0.3 gf up to 2 kgf.

Two scratch tests were performed using the Micro Module with linearly increased load from 0.01 N to 200 N and from 0.01 N to 0.5 N, respectively, using conico-spherical diamond stylus with tip radius of 500 μm and 20 μm.

Twenty Microindentation tests were carried out on the steel standard sample at 4 N showcasing the superior repeatability of the Micro Module’s results that contrast the performance of conventional Vickers hardness testers.

*microindenter on the steel sample

TEST PARAMETERS

of the Indentation Mapping

MAPPING: 3 BY 4 INDENTS

RESULTS AND DISCUSSION

The new Micro Module has a unique combination of Z-motor, high-force load cell and a high precision capacitive depth sensor. The unique utilization of independent depth and load sensors ensures high accuracy under all conditions.

Conventional Vickers hardness tests use diamond square-based pyramid indenter tips that create square shaped indents. By measuring the average length of the diagonal, d, the Vickers hardness can be calculated.

In comparison, the instrumented indentation technique used by NANOVEA‘s Micro Module directly measures the mechanical properties from indentation load & displacement measurements. No visual observation of the indent is required. This eliminates user or computer image processing errors in determining the d values of the indentation. The high accuracy capacitor depth sensor with a very low noise level of 0.3 nm can accurately measure the depth of indents that are difficult or impossible to be measured visually under a microscope with traditional Vickers hardness testers.

In addition, the cantilever technique used by competitors applies the normal load on a cantilever beam by a spring, and this load is in turn applied on the indenter. Such a design has a flaw in case a high load is applied – the cantilever beam cannot provide sufficient structural stiffness, leading to deformation of the cantilever beam and in turn misalignment of the indenter. In comparison, the Micro Module applies the normal load via the Z-motor acting on the load cell and then the indenter for direct load application. All the elements are vertically aligned for maximum stiffness, ensuring repeatable and accurate indentation and scratch measurements in the full load range.

Close-up view of the new Micro Module

INDENTATION FROM 0.03 TO 200 N

The image of the indentation map is displayed in FIGURE 1. The distance between the two adjacent indents above 10 N is 0.5 mm, while the one at lower loads is 0.25 mm. The high-precision position control of the sample stage allows users to select the target location for mechanical properties mapping. Thanks to the excellent stiffness of the micro module due to the vertical alignment of its components, the Vickers indenter keeps a perfect vertical orientation as it penetrates into the steel sample under a load of up to 200 N (400 N optional). This creates impressions of a symmetric square shape on the sample surface at different loads.

The individual indentations at different loads under the microscope are displayed alongside of the two scratches as shown in FIGURE 2, to showcase the capacity of the new micro module in performing both indentation and scratch tests in a wide load range with a high precision. As shown in the Normal Load vs. Scratch Length plots, the normal load increases linearly as the conico-spherical diamond stylus slides on the steel sample surface. It creates a smooth straight scratch track of progressively increased width and depth.

FIGURE 1: Indentation Map

Two scratch tests were performed using the Micro Module with linearly increased load from 0.01 N to 200 N and from 0.01 N to 0.5 N, respectively, using conico-spherical diamond stylus with tip radius of 500 μm and 20 μm.

Twenty Microindentation tests were carried out on the steel standard sample at 4 N showcasing the superior repeatability of the Micro Module’s results that contrast the performance of conventional Vickers hardness testers.

A: INDENTATION AND SCRATCH UNDER THE MICROSCOPE (360X)

B: INDENTATION AND SCRATCH UNDER THE MICROSCOPE (3000X)

FIGURE 2: Load vs Displacement plots at different maximum loads.

The load-displacement curves during the indentation at different maximum loads are shown in FIGURE 3. The hardness and elastic modulus are summarized and compared in FIGURE 4. The steel sample exhibits a constant elastic modulus throughout the test load ranging from 0.03 to 200 N (possible range 0.003 to 400 N), resulting in an average value of ~211 GPa. The hardness exhibits a relatively constant value of ~6.5 GPa measured under a maximum load above 100 N. As the load decreases to a range of 2 to 10 N, an average hardness of ~9 GPa is measured.

FIGURE 3: Load vs Displacement plots at different maximum loads.

FIGURE 4: Hardness and Young’s modulus of the steel sample measured by different maximum loads.

INDENTATION FROM 0.03 TO 200 N

Twenty Microindentation tests were performed at 4N maximum load. The load-displacement curves are displayed in FIGURE 5 and the resulting Vickers hardness and Young’s modulus are shown in FIGURE 6.

FIGURE 5: Load-displacement curves for microindentation tests at 4 N.

FIGURE 6: Vickers hardness and Young’s Modulus for 20 microindentations at 4 N.

The load-displacement curves demonstrate the superior repeatability of the new Micro Module. The steel standard possesses a Vickers hardness of 842±11 HV measured by the new Micro Module, compared to 817±18 HV as measured using the conventional Vickers hardness tester. The small standard deviation of the hardness measurement ensures reliable and reproducible characterization of mechanical properties in the R&D and quality control of materials in both the industrial sector and academia research.

In addition, a Young’s Modulus of 208±5 GPa is calculated from the load-displacement curve, which is not available for conventional Vickers hardness tester due to the missing depth measurement during the indentation. As load decrease and the size of the indent decreases, the NANOVEA Micro Module advantages in terms of repeatability compare to Vickers Hardness Testers increase until it is no longer possible to measure the indent through visual inspection.

The advantage of measuring depth to calculate hardness also becomes evident when dealing with rougher or when samples are more difficult to observe under standard microscopes provided on Vickers Hardness Testers.

CONCLUSION

In this study, we have shown how the new world leading NANOVEA Micro Module (200 N range) performs unmatched reproducible and precise indentation and scratch measurements under a wide load range from 0.03 to 200 N (3 gf to 20.4 kgf). An optional lower range Micro Module can provide testing from 0.003 to 20 N (0.3 gf to 2 kgf). The unique vertical alignment of the Z-motor, high-force load cell and depth sensor ensures maximum structural stiffness during measurements. The indentations measured at different loads all possess a symmetric square shape on the sample surface. A straight scratch track of progressively increased width and depth is created in the scratch test of a 200 N maximum load.

The new Micro Module can be configured on the PB1000 (150 x 200 mm) or the CB500 (100 x 50 mm) mechanical base with a z motorization (50 mm range). Combined with a powerful camera system (position accuracy of 0.2 microns) the systems provide the best automation and mapping capabilities on the market. NANOVEA also offers a unique patented function (EP No. 30761530) which allows verification and calibration of Vickers indenters by performing a single indent across the full range of loads. In contrast, standard Vickers Hardness Testers can only provide calibration at one load.

Additionally, the NANOVEA software enables a user to measure the Vickers hardness via the traditional method of measuring the indent diagonals if needed (for ASTM E92 & E384). As shown, in this document, depth versus load hardness testing (ASTM E2546 and ISO 14577) performed by a NANOVEA Micro Module is precise and reproducible compared to Traditional Hardness Testers. Especially for samples that cannot be observed/measured with a microscope.

In conclusion, the higher accuracy and repeatability of the Micro Module design with its broad range of loads and tests, high automation and mapping options renders the traditional Vickers hardness testers obsolete. But likewise with scratch and micro scratch testers still currently offered but designed with flaws in the 1980’s.

The continuous development and improvement of this technology makes NANOVEA a world leader in micro mechanical testing.

NOW, LET'S TALK ABOUT YOUR APPLICATION

Sandpaper Roughness Profilometer

Sandpaper: Roughness & Particle Diameter Analysis

Sandpaper: Roughness & Particle Diameter Analysis

Learn more


SANDPAPER

Roughness & Particle Diameter Analysis

Prepared by

FRANK LIU

INTRODUCTION

Sandpaper is a common commercially available product used as an abrasive. The most common use for sandpaper is to remove coatings or to polish a surface with its abrasive properties. These abrasive properties are classified into grits, each related to how smooth or
rough of a surface finish it will give. To achieve desired abrasive properties, manufactures of sandpaper must ensure that the abrasive particles are of a specific size and have little deviation. To quantify the quality of sandpaper, NANOVEA’s 3D Non-Contact Profilometer can be used to obtain the arithmetic mean (Sa) height parameter and average particle diameter of a sample area.

IMPORTANCE OF 3D NON-CONTACT OPTICAL PROFILER FOR SANDPAPER

When using sandpaper, interaction between abrasive particles and the surface being sanded must be uniform to obtain consistent surface finishes. To quantify this, the surface of the sandpaper can be observed with NANOVEA’s 3D Non-Contact Optical Profiler to see deviations in the particle sizes, heights, and spacing.

MEASUREMENT OBJECTIVE

In this study, five different sandpaper grits (120,
180, 320, 800, and 2000) are scanned with the
NANOVEA ST400 3D Non-Contact Optical Profiler.
The Sa is extracted from the scan and the particle
size is calculated by conducting a Motifs analysis to
find their equivalent diameter

NANOVEA

ST400

RESULTS & DISCUSSION

The sandpaper decreases in surface roughness (Sa) and particle size as the grit increases, as expected. The Sa ranged from 42.37 μm to 3.639 μm. The particle size ranges from 127 ± 48.7 to 21.27 ± 8.35. Larger particles and high height variations create stronger abrasive action on surfaces as opposed to smaller particles with low height variation.
Please note all definitions of the given height parameters are listed on page.A.1.

TABLE 1: Comparison between sandpaper grits and height parameters.

TABLE 2: Comparison between sandpaper grits and particle diameter.

2D & 3D VIEW OF SANDPAPER 

Below are the false-color and 3D view for the sandpaper samples.
A gaussian filter of 0.8 mm was used to remove the form or waviness.

MOTIF ANALYSIS

To accurately find the particles at the surface, the height scale threshold was redefined to only show the upper layer of the sandpaper. A motifs analysis was then conducted to detect the peaks.

CONCLUSION

NANOVEA’s 3D Non-Contact Optical Profiler was used to inspect the surface properties of various sandpaper grits due to its ability to scan surfaces with micro and nano features with precision.

Surface height parameters and the equivalent particle diameters were obtained from each of the sandpaper samples using advanced software to analyze the 3D scans. It was observed that as the grit size increased, the surface roughness (Sa) and particle size decreased as expected.

NOW, LET'S TALK ABOUT YOUR APPLICATION

Styrofoam Surface Boundary Measurement Profilometry

Surface Boundary Measurement

Surface Boundary Measurement Using 3D Profilometry

Learn more


SURFACE BOUNDARY MEASUREMENT

USING 3D PROFILOMETRY

Prepared by

Craig Leising

INTRODUCTION

In studies where the interface of surface features, patterns, shapes etc., are being evaluated for orientation, it will be useful to quickly identify areas of interest over the entire profile of measurement. By segmenting a surface into significant areas the user can quickly evaluate boundaries, peaks, pits, areas, volumes and many others to understand their functional role in the entire surface profile under study. For example, like that of a grain boundary imaging of metals, the importance of analysis is the interface of many structures and their overall orientation. By understanding each area of interest defects and or abnormalities within the overall area can be identified. Although grain boundary imaging is typically studied at a range surpassing Profilometer capability, and is only 2D image analysis, it is a helpful reference to illustrate the concept of what will be shown here on a larger scale along with 3D surface measurement advantages.

IMPORTANCE OF 3D NON CONTACT PROFILOMETER FOR SURFACE SEPARATION STUDY

Unlike other techniques such as touch probes or interferometry, the 3D Non Contact Profilometer, using axial chromatism, can measure nearly any surface, sample sizes can vary widely due to open staging and there is no sample preparation needed. Nano through macro range is obtained during surface profile measurement with zero influence from sample reflectivity or absorption, has advanced ability to measure high surface angles and there is no software manipulation of results. Easily measure any material: transparent, opaque, specular, diffusive, polished, rough etc. The technique of the Non Contact Profilometer provides an ideal, broad and user friendly capability to maximize surface studies when surface boundary analysis will be needed; along with the benefits of combined 2D & 3D capability.

MEASUREMENT OBJECTIVE

In this application the Nanovea ST400 Profilometer is used to measure the surface area of Styrofoam. Boundaries were established by combining a reflected intensity file along with the topography, which are simultaneously acquired using the NANOVEA ST400. This data was then used to calculate different shape and size information of each Styrofoam “grain”.

NANOVEA

ST400

RESULTS & DISCUSSION: 2D Surface Boundary Measurement

Topography image(below left) masked by reflected intensity image(below right) to clearly define grain boundaries. All grains below 565µm diameter have been ignored by applying filter.

Total number of grains: 167
Total projected area occupied by the grains: 166.917 mm² (64.5962 %)
Total projected area occupied by boundaries: (35.4038 %)
Density of grains: 0.646285 grains / mm2

Area = 0.999500 mm² +/- 0.491846 mm²
Perimeter = 9114.15 µm +/- 4570.38 µm
Equivalent diameter = 1098.61 µm +/- 256.235 µm
Mean diameter = 945.373 µm +/- 248.344 µm
Min diameter = 675.898 µm +/- 246.850 µm
Max diameter = 1312.43 µm +/- 295.258 µm

RESULTS & DISCUSSION: 3D Surface Boundary Measurement

By using the 3D topography data obtained, the volume, height, peak, aspect ratio and general shape information can be analyzed on each grain. Total 3D area occupied: 2.525mm3

CONCLUSION

In this application, we have shown how the NANOVEA 3D Non Contact Profilometer can precisely characterize the surface of Styrofoam. Statistical information can be gained over the entire surface of interest or on individual grains, whether they are peaks or pits. In this example all grains larger than a user defined size were used to show the area, perimeter, diameter and height. The features shown here can be critical to research and quality control of natural and pre fabricated surfaces ranging from bio medical to micromachining applications along with many others. 

NOW, LET'S TALK ABOUT YOUR APPLICATION

Glass Coating Humidity Wear Testing by Tribometer

Glass Coating Humidity Wear Testing by Tribometer

Learn more


GLASS COATING HUMIDITY

WEAR TESTING BY TRIBOMETER

Prepared by

DUANJIE LI, PhD

INTRODUCTION

Self-cleaning glass coating creates an easy-clean glass surface that prevents buildup of grime, dirt and staining. Its self-cleaning feature significantly reduces the frequency, time, energy and cleaning costs, making it an attractive choice for a variety of residential and commercial applications, such as glass facade, mirrors, shower glasses, windows and windshields.

IMPORTANCE OF WEAR RESISTANCE OF SELF-CLEANING GLASS COATING

A major application of the self-cleaning coating is the exterior surface of the glass facade on skyscrapers. The glass surface is often attacked by high-speed particles carried by strong winds. The weather condition also plays a major role in the service lifetime of the glass coating. It can be very difficult and costly to surface treat the glass and apply the new coating when the old one fails. Therefore, the wear resistance of the glass coating under
different weather condition is critical.


In order to simulate the realistic environmental conditions of the self-cleaning coating in different weather, repeatable wear evaluation in a controlled and monitored humidity is needed. It allows users to properly compare the wear resistance of the self-cleaning coatings exposed to different humidity and to select the best candidate for the targeted application.

MEASUREMENT OBJECTIVE

In this study, we showcased that the NANOVEA T100 Tribometer equipped with a humidity controller is an ideal tool for investigating the wear resistance of self-cleaning glass coatings in different humidity.

NANOVEA

T100

TEST PROCEDURES

The soda lime glass microscope slides were coated with self-clean glass coatings with two different treatment recipes. These two coatings are identified as Coating 1 and Coating 2. An uncoated bare glass slide is also tested for comparison.


NANOVEA Tribometer equipped with a humidity control module was used to evaluate the tribological behavior, e.g. coefficient of friction, COF, and wear resistance of the self-clean glass coatings. A WC ball tip (6 mm dia.) was applied against the tested samples. The COF was recorded in situ. The humidity controller attached to the tribo-chamber precisely controlled the relative humidity (RH) value in the range of ±1 %. The wear track morphology was examined under the optical microscope after the wear tests.

MAXIMUM LOAD 40 mN
RESULTS & DISCUSSION

The pin-on-disk wear tests in different humidity conditions were conducted on the coated and uncoated glass
samples. The COF was recorded in situ during the wear tests as shown in
FIGURE 1 and the average COF is summarized in FIGURE 2. FIGURE 4 compares the wear tracks after the wear tests.


As shown in
FIGURE 1, the uncoated glass exhibits a high COF of ~0.45 once the sliding movement begins in the 30% RH, and it progressively increases to ~0.6 at the end of the 300-revolution wear test. In comparison, the
coated glass samples Coating 1 and Coating 2 show a low COF below 0.2 at the beginning of the test. The COF
of Coating 2 stabilizes at ~0.25 during the rest of the test, while Coating 1 exhibits a sharp increase of COF at
~250 revolutions and the COF reaches a value of ~0.5. When the wear tests are carried out in the 60% RH, the
uncoated glass still shows a higher COF of ~0.45 throughout the wear test. Coatings 1 and 2 exhibit the COF values of 0.27 and 0.22, respectively. In the 90% RH, the uncoated glass possesses a high COF of ~0.5 at the end of the wear test. Coatings 1 and 2 exhibit comparable COF of ~0.1 as the wear test starts. Coating 1 maintains a relatively stable COF of ~0.15. Coating 2, however, fails at ~ 100 revolutions, followed by a significant increase of COF to ~0.5 towards the end of the wear test.


The low friction of the self-clean glass coating is caused by its low surface energy. It creates a very high static
water contact angle and low roll-off angle. It leads to formation of small water droplets on the coating surface in the 90% RH as shown under the microscope in
FIGURE 3. It also results in decrease of the average COF from ~0.23 to ~0.15 for Coating 2 as the RH value increases from 30% to 90%.

FIGURE 1: Coefficient of friction during the pin-on-disk tests in different relative humidity.

FIGURE 2: Average COF during the pin-on-disk tests in different relative humidity.

FIGURE 3: Formation of small water droplets on the coated glass surface.

FIGURE 4 compares the wear tracks on the glass surface after the wear tests in different humidity. Coating 1 exhibits signs of mild wear after the wear tests in the RH of 30% and 60%. It possesses a large wear track after the test in the 90% RH, in agreement with the significant increase of COF during the wear test. Coating 2 shows nearly no sign of wear after the wear tests in both dry and wet environment, and it also exhibits constant low COF during the wear tests in different humidity. The combination of good tribological properties and low surface energy makes Coating 2 a good candidate for self-cleaning glass coating applications in harsh environments. In comparison, the uncoated glass shows larger wear tracks and higher COF in different humidity, demonstrating the necessity of self-cleaning coating technique.

FIGURE 4: Wear tracks after the pin-on-disk tests in different relative humidity (200x magnification).

CONCLUSION

NANOVEA T100 Tribometer is a superior tool for evaluation and quality control of self-cleaning glass coatings in different humidity. The capacity of in-situ COF measurement allows users to correlate different stages of wear process with the evolution of COF, which is critical in improving fundamental understanding of the wear mechanism and tribological characteristics of the glass coatings. Based on the comprehensive tribological analysis on the self-cleaning glass coatings tested in different humidity, we show that Coating 2 possesses a constant low COF and superior wear resistance in both dry and wet environments, making it a better candidate for self-cleaning glass coating applications exposed to different weathers.


NANOVEA Tribometers offer precise and repeatable wear and friction testing using ISO and ASTM compliant rotative and linear modes, with optional high temperature wear, lubrication and tribo-corrosion modules available in one pre-integrated system. Optional 3D non-contact profiler is available for high
resolution 3D imaging of wear track in addition to other surface measurements such as roughness. 

NOW, LET'S TALK ABOUT YOUR APPLICATION

Creep Deformation of Polymers using Nanoindentation

Creep Deformation of Polymers using Nanoindentation

Learn more


CREEP DEFORMATION

OF POLYMERS USING NANOINDENTATION

Prepared by

DUANJIE LI, PhD

INTRODUCTION

As viscoelastic materials, polymers often undergo a time-dependent deformation under a certain applied load, also known as creep. Creep becomes a critical factor when the polymeric parts are designed to be exposed to continuous stress, such as structural components, joins and fittings, and hydrostatic pressure vessels.

IMPORTANCE OF CREEP MEASUREMENT FOR POLYMERS

The inherent nature of viscoelasticity plays a vital role in the performance of polymers and directly influences their service reliability. The environmental conditions such as loading and temperature affect the creep behavior of the polymers. Creep failures often occur due to the lack of alertness of the time-dependent creep behavior of the polymer materials used under specific service conditions. As a result, it is important to develop a reliable and quantitative test of the viscoelastic mechanical behaviors of the polymers. The Nano module of the NANOVEA Mechanical Testers applies the load with a high-precision piezo and directly measures the evolution of force and displacement in situ. The combination of accuracy and repeatability makes it an ideal tool for creep measurement.

MEASUREMENT OBJECTIVE

In this application, we showcased that
the NANOVEA PB1000 Mechanical Tester
in Nanoindentation mode is an ideal tool
for studying viscoelastic mechanical properties
including hardness, Young’s modulus
and creep of polymeric materials.

NANOVEA

PB1000

TEST CONDITIONS

Eight different polymer samples were tested by nanoindentation technique using the NANOVEA PB1000 Mechanical Tester. As the load linearly increased from 0 to 40 mN, the depth progressively increased during the loading stage. The creep was then measured by the change of indentation depth at the maximum load of 40 mN for 30 s.

MAXIMUM LOAD 40 mN
LOADING RATE
80 mN/min
UNLOADING RATE 80 mN/min
CREEP TIME
30 s

INDENTER TYPE

Berkovich

Diamond

*setup of the nanoindentation test

RESULTS & DISCUSSION

The load vs displacement plot of the nanoindentation tests on different polymer samples is shown in FIGURE 1 and the creep curves are compared in FIGURE 2. The hardness and Young’s modulus are summarized in  FIGURE 3, and the creep depth is shown in FIGURE 4. As an examples in FIGURE 1, the AB, BC and CD portions of the load-displacement curve for the nanoindentation measurement represent the loading, creep and unloading processes, respectively.

Delrin and PVC exhibit the highest hardness of 0.23 and 0.22 GPa, respectively, while LDPE possesses the lowest hardness of 0.026 GPa among the tested polymers. In general, the harder polymers show lower creep rates. The softest LDPE has the highest creep depth of 798 nm, compared to ~120 nm for Delrin.

The creep properties of the polymers are critical when they are used in structural parts. By precisely measuring the hardness and creep of the polymers, a better understanding of the time-dependent reliability of the polymers can be obtained. The creep, change of the displacement at a given load, can also be measured at different elevated temperatures and humidity using the NANOVEA PB1000 Mechanical Tester, providing an ideal tool to quantitatively and reliably measure the viscoelastic mechanical behaviors of polymers
in the simulated realistic application environment.

FIGURE 1: The load vs displacement plots
of different polymers.

FIGURE 2: Creeping at a maximum load of 40 mN for 30 s.

FIGURE 3: Hardness and Young’s modulus of the polymers.

FIGURE 4: Creep depth of the polymers.

CONCLUSION

In this study, we showcased that the NANOVEA PB1000
Mechanical Tester measures the mechanical properties of different polymers, including hardness, Young’s modulus and creep. Such mechanical properties are essential in selecting the proper polymer material for intended applications. Derlin and PVC exhibit the highest hardness of 0.23 and 0.22 GPa, respectively, while LDPE possesses the lowest hardness of 0.026 GPa among the tested polymers. In general, the harder polymers exhibit lower creep rates. The softest LDPE shows the highest creep depth of 798 nm, compared to ~120 nm for Derlin.

The NANOVEA Mechanical Testers provide unmatched multi-function Nano and Micro modules on a single platform. Both the Nano and Micro modules include scratch tester, hardness tester and wear tester modes, providing the wildest and most user-friendly range of testing available on a single system.

NOW, LET'S TALK ABOUT YOUR APPLICATION

Multiphase Material using Nanoindentation NANOVEA

Multiphase Metal Nanoindentation

Metallurgy Study of Multiphase Material using Nanoindentation

Learn more


METALLURGY STUDY
OF MULTIPHASE MATERIAL

USING NANOINDENTATION

Prepared by

DUANJIE LI, PhD & ALEXIS CELESTIN

INTRODUCTION

Metallurgy studies the physical and chemical behavior of metallic elements, as well as their intermetallic compounds and alloys. Metals that undergo working processes, such as casting, forging, rolling, extrusion and machining, experience changes in their phases, microstructure and texture. These changes result in varied physical properties including hardness, strength, toughness, ductility, and wear resistance of the material. Metallography is often applied to learn the formation mechanism of such specific phases, microstructure and texture.

IMPORTANCE OF LOCAL MECHANICAL PROPERTIES FOR MATERIALS DESIGN

Advanced materials often have multiple phases in a special microstructure and texture to achieve desired mechanical properties for target applications in industrial practice. Nanoindentation is widely applied to measure the mechanical behaviors of materials at small scales i ii. However, it is challenging and time-consuming to precisely select specific locations for indentation in a very small area. A reliable and user-friendly procedure of nanoindentation testing is in demand to determine the mechanical properties of different phases of a material with high precision and timely measurements.

MEASUREMENT OBJECTIVE

In this application, we measure mechanical properties of a multiphase metallurgical sample using the Most Powerful Mechanical Tester: the NANOVEA PB1000.

Here, we showcase the capacity of the PB1000 in performing nanoindentation measurements on multiple phases (grains) of a large sample surface with high precision and user friendliness using our Advanced Position Controller.

NANOVEA

PB1000

TEST CONDITIONS

In this study, we use a metallurgical sample with multiple phases. The sample had been polished to a mirror-like surface finish before the indentation tests. Four phases have been identified in the sample, namely PHASE 1, PHASE 2, PHASE 3 and PHASE 4 as shown below.

The Advanced Stage Controller is an intuitive sample navigation tool which automatically adjusts the speed of sample movement under the optical microscope based on position of the mouse. The further the mouse is away from the center of field of view, the faster the stage moves toward the mouse’s direction. This provides a user-friendly method to navigate the entire sample surface and select the intended location for mechanical testing. The coordinates of the test locations are saved and numbered, along with their individual test setups, such as loads, loading/unloading rate, number of tests in a map, etc. Such a test procedure allows users to examine a large sample surface for specific areas of interest for indentation and perform all the indentation tests at different locations in one time, making it an ideal tool for mechanical testing of metallurgical samples with multiple phases.

In this study, we located the specific phases of the sample under the optical microscope integrated in the NANOVEA Mechanical Tester as numbered on FIGURE 1. The coordinates of the selected locations are saved, followed by automatic nanoindentation tests all at once under the test conditions summarized below

FIGURE 1: SELECTING NANOINDENTATION LOCATION ON THE SAMPLE SURFACE.
RESULTS: NANOINDENTATIONS ON DIFFERENT PHASES

The indentations at the different phases of the sample are displayed below. We demonstrate that the excellent position control of the sample stage in the NANOVEA Mechanical Tester allows users to precisely pinpoint the target location for mechanical properties testing.

The representative load-displacement curves of the indentations are shown in FIGURE 2, and the corresponding hardness and Young’s Modulus calculated using Oliver and Pharr Methodiii are summarized and compared in FIGURE 3.


The
PHASES 1, 2, 3 and 4 possess an average hardness of ~5.4, 19.6, 16.2 and 7.2 GPa, respectively. The relatively small size for PHASES 2 contributes to its higher standard deviation of the hardness and Young’s Modulus values.

FIGURE 2: LOAD-DISPLACEMENT CURVES
OF THE NANOINDENTATIONS

FIGURE 3: HARDNESS & YOUNG’S MODULUS OF DIFFERENT PHASES

CONCLUSION

In this study, we showcased the NANOVEA Mechanical Tester performing nanoindentation measurements on multiple phases of a large metallurgical sample using the Advanced Stage Controller. The precise position control allows users to easily navigate a large sample surface and directly select the areas of interest for nanoindentation measurements.

The location coordinates of all the indentations are saved and then performed consecutively. Such a test procedure makes measurement of the local mechanical properties at small scales, e.g. the multi-phase metal sample in this study, substantially less time-consuming and more user friendly. The hard PHASES 2, 3 and 4 improve the mechanical properties of the sample, possessing an average hardness of ~19.6, 16.2 and 7.2 GPa, respectively, compared to ~5.4 GPa for PHASE 1.

The Nano, Micro or Macro modules of the instrument all include ISO and ASTM compliant indentation, scratch and wear tester modes, providing the widest and most user friendly range of testing available in a single system. NANOVEA’s unmatched range is an ideal solution for determining the full range of mechanical properties of thin or thick, soft or hard coatings, films and substrates, including hardness, Young’s modulus, fracture toughness, adhesion, wear resistance and many others.

i Oliver, W. C.; Pharr, G. M., Journal of Materials Research., Volume 19, Issue 1, Jan 2004, pp.3-20
ii Schuh, C.A., Materials Today, Volume 9, Issue 5, May 2006, pp. 32–40
iii Oliver, W. C.; Pharr, G. M., Journal of Materials Research, Volume 7, Issue 6, June 1992, pp.1564-1583

NOW, LET'S TALK ABOUT YOUR APPLICATION

Contour Measurement using Profilometer by NANOVEA

Rubber Tread Contour Measurement

Rubber Tread Contour Measurement

Learn More


RUBBER TREAD CONTOUR MEASUREMENT

USING 3D OPTICAL PROFILER

Rubber Tread Contour Measurement - NANOVEA Profiler

Prepared by

ANDREA HERRMANN

INTRODUCTION

Like all materials, rubber’s coefficient of friction is related in part to its surface roughness. In vehicle tire applications, traction with the road is very important. Surface roughness and the tire’s treads both play a role in this. In this study, the rubber surface and tread’s roughness and dimensions are analyzed.

* THE SAMPLE

IMPORTANCE

OF 3D NON-CONTACT PROFILOMETRY

FOR RUBBER STUDIES

Unlike other techniques such as touch probes or interferometry, NANOVEA’s 3D Non-Contact Optical Profilers use axial chromatism to measure nearly any surface. 

The Profiler system’s open staging allows for a wide variety of sample sizes and requires zero sample preparation. Nano through macro range features can be detected during a single scan with zero influence from sample reflectivity or absorption. Plus, these profilers have the advanced ability to measure high surface angles without requiring software manipulation of results.

Easily measure any material: transparent, opaque, specular, diffusive, polished, rough etc. The measurement technique of the NANOVEA 3D Non-Contact Profilers provides an ideal, broad and user friendly capability to maximize surface studies along with the benefits of combined 2D & 3D capability.

MEASUREMENT OBJECTIVE

In this application, we showcase the NANOVEA ST400, a 3D Non-Contact Optical Profiler measuring the surface and treads of a rubber tire.

A sample surface area large enough to represent the entire tire surface was selected at random for this study. 

To quantify the rubber’s characteristics, we used the NANOVEA Ultra 3D analysis software to measure the contour dimensions, depth, roughness and developed area of the surface.

NANOVEA

ST400

ANALYSIS: TIRE TREAD

The 3D View and False Color View of the treads show the value of mapping 3D surface designs. It provides users a straightforward tool to directly observe the size and shape of the treads from different angles. The Advanced Contour Analysis and Step Height Analysis are both extremely powerful tools for measuring precise dimensions of sample shapes and design

ADVANCED CONTOUR ANALYSIS

STEP HEIGHT ANALYSIS

ANALYSIS: RUBBER SURFACE

The rubber surface can be quantified in numerous ways using built-in software tools as shown in the following figures as examples. It can be observed that the surface roughness is 2.688 μm, and the developed area vs. projected area is 9.410 mm² vs. 8.997 mm². This information allows us to examine the relationship between surface finish and the traction of different rubber formulations or even rubber with varying degrees of surface wear.

CONCLUSION

In this application, we have shown how the NANOVEA 3D Non-Contact Optical Profiler can precisely characterize the surface roughness and tread dimensions of rubber.

The data shows a surface roughness of 2.69 ­µm and a developed area of 9.41 mm² with a projected area of 9 mm². Various dimensions and radii of the rubber treads were measured as well.

The information presented in this study can be used to compare the performance of rubber tires with di­fferent tread designs, formulations, or varying degrees of wear. The data shown here represents only a portion of the calculations available in the Ultra 3D analysis software.

NOW, LET'S TALK ABOUT YOUR APPLICATION