USA/GLOBAL: +1-949-461-9292
EUROPE: +39-011-3052-794
CONTACT US

Category: Profilometry | Volume and Area


Progressive Wear Mapping of Flooring using Tribometer

Flooring Wear Testing

Progressive Wear Mapping of Flooring​ using Tribometer with integrated Profilometer

flooring wear testing

Prepared by

FRANK LIU

INTRODUCTION

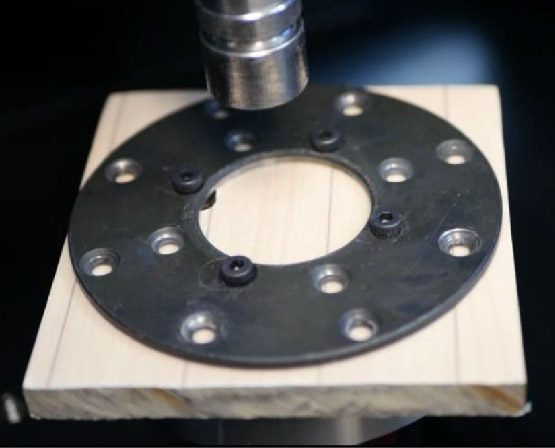
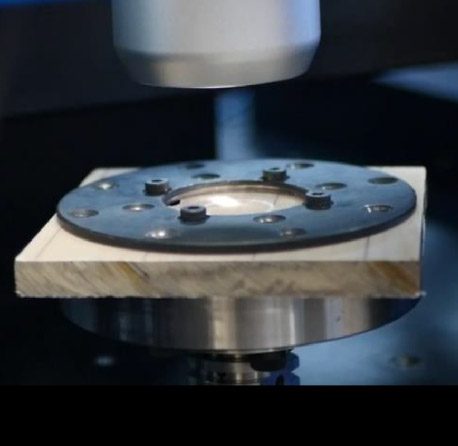
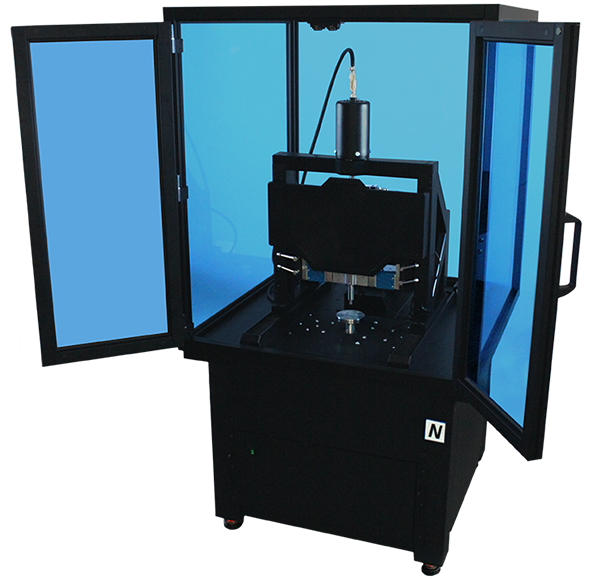
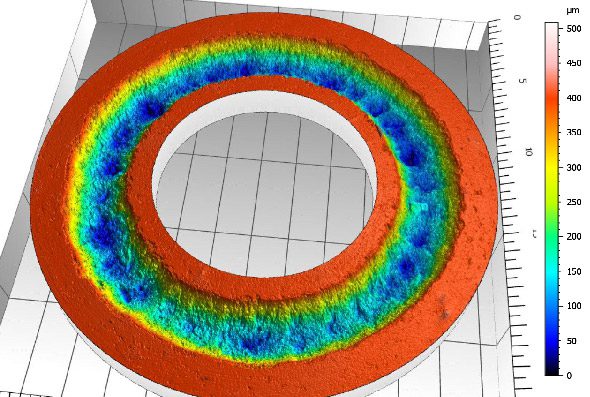
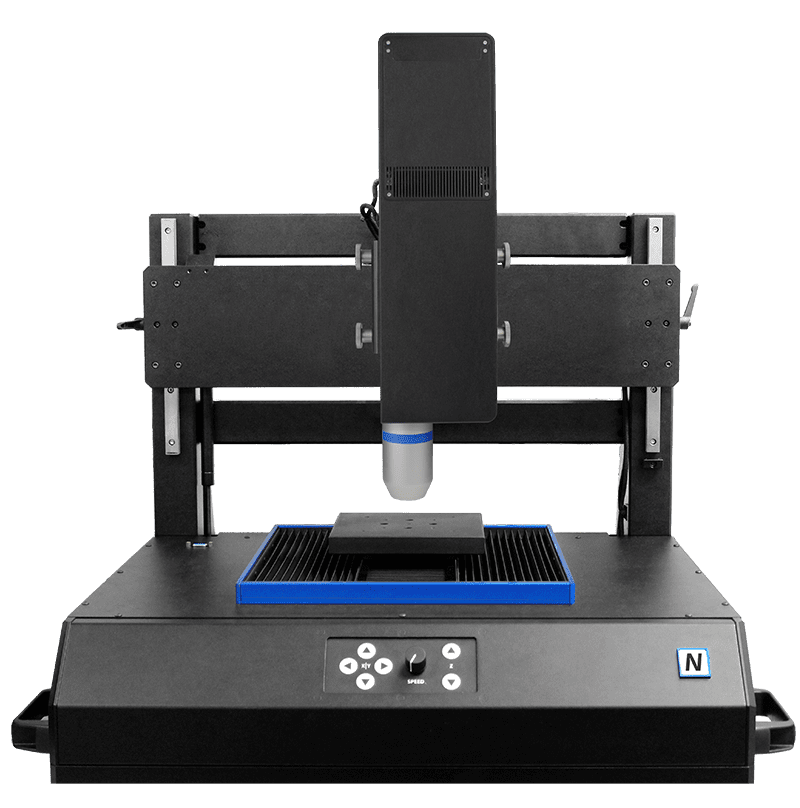
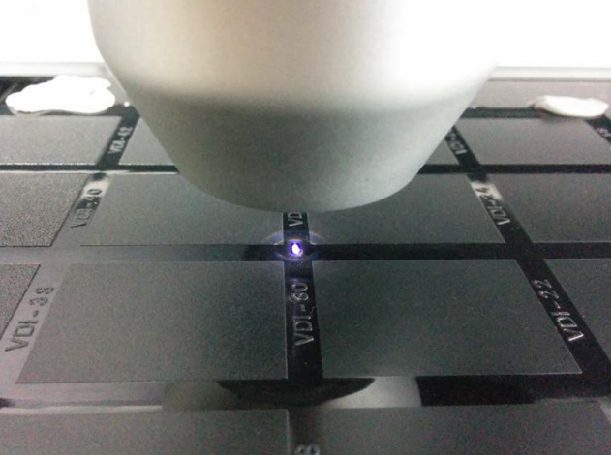
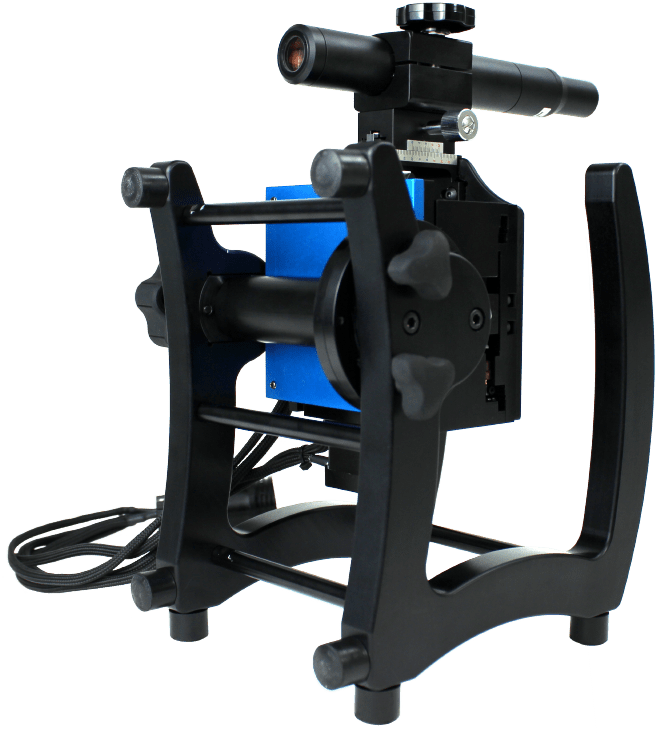
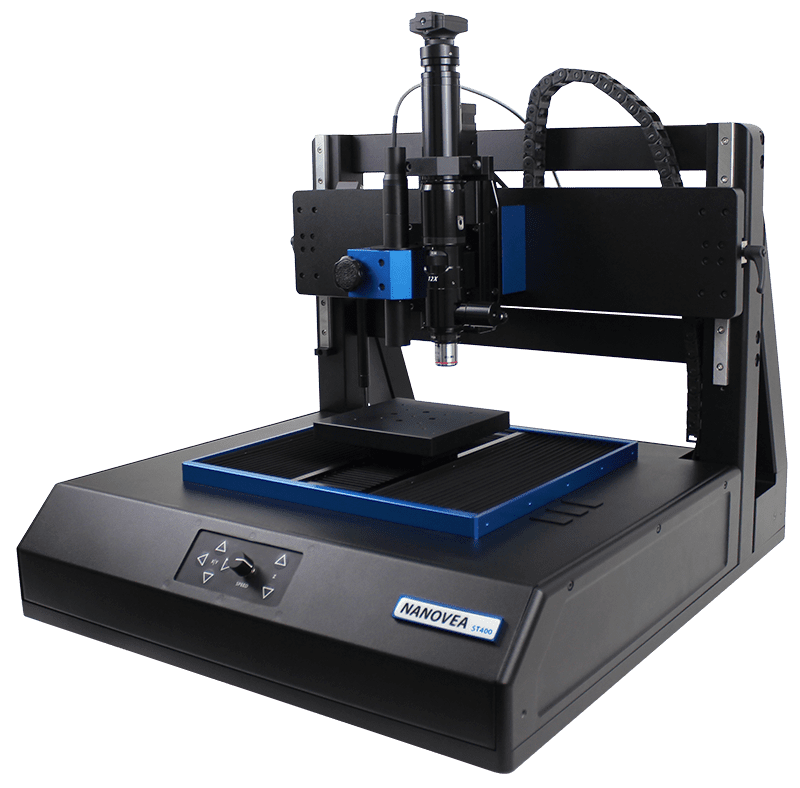
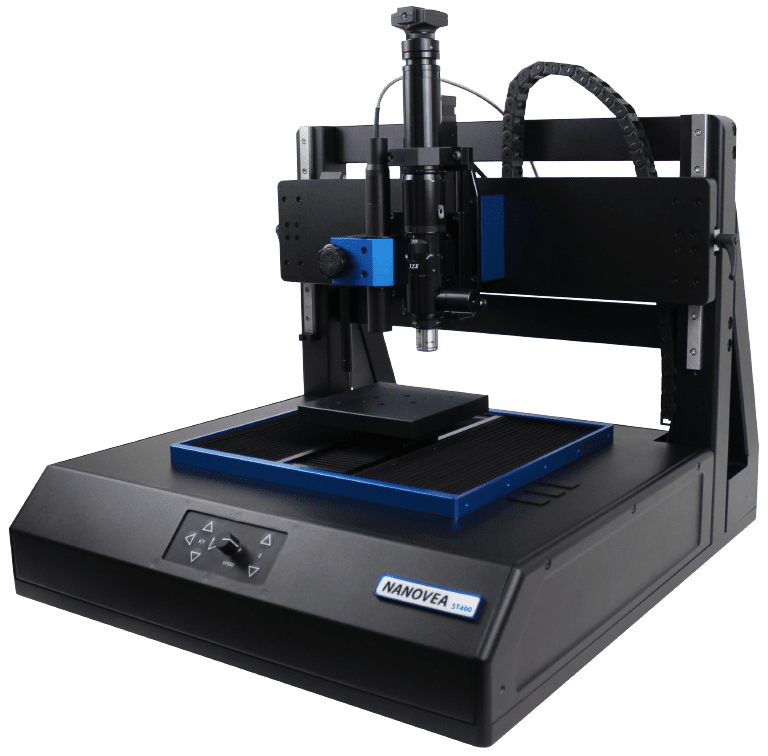
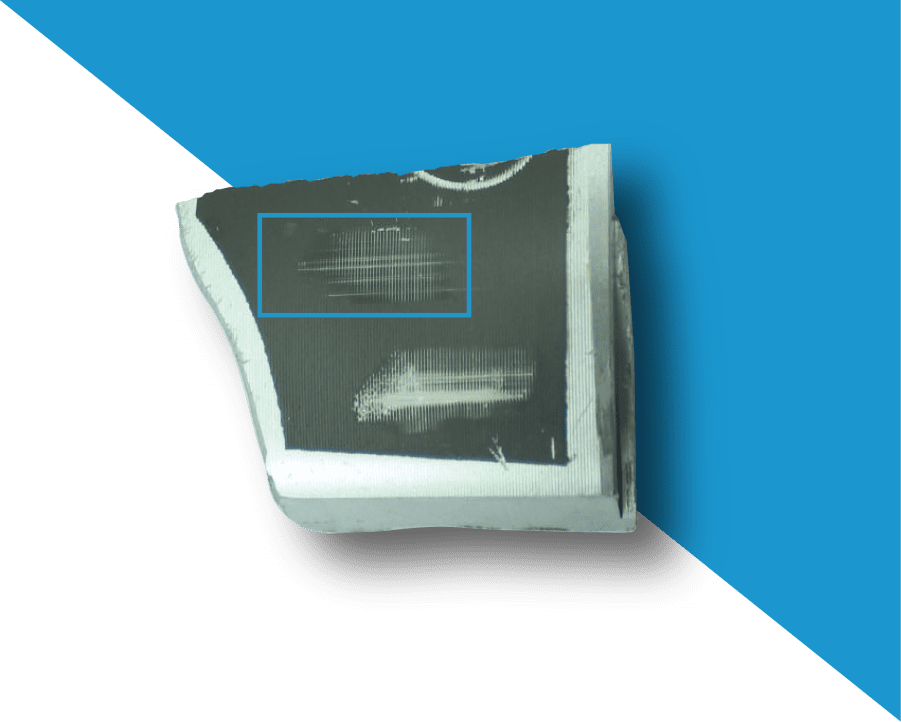
Flooring materials are designed to be durable, but they often suffer wear and tear from everyday activities such as movement and furniture use. To ensure their longevity, most types of flooring have a protective wear layer that resists damage. However, the thickness and durability of the wear layer vary depending on the flooring type and level of foot traffic. In addition, different layers within the flooring structure, such as UV coatings, decorative layers, and glaze, have varying wear rates. That’s where progressive wear mapping comes in. Using the NANOVEA T2000 Tribometer with an integrated 3D Non-Contact Profilometer, precise monitoring, and analysis of the performance and longevity of flooring materials can be done. By providing detailed insight into the wear behavior of various flooring materials, scientists and technical professionals can make more informed decisions when selecting and designing new flooring systems.

IMPORTANCE OF PROGRESSIVE WEAR MAPPING FOR FLOOR PANELS

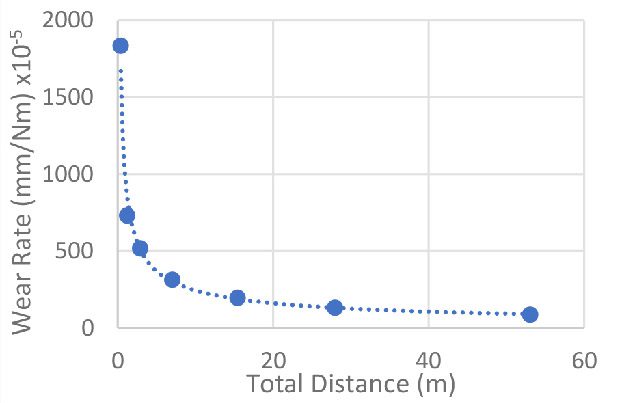
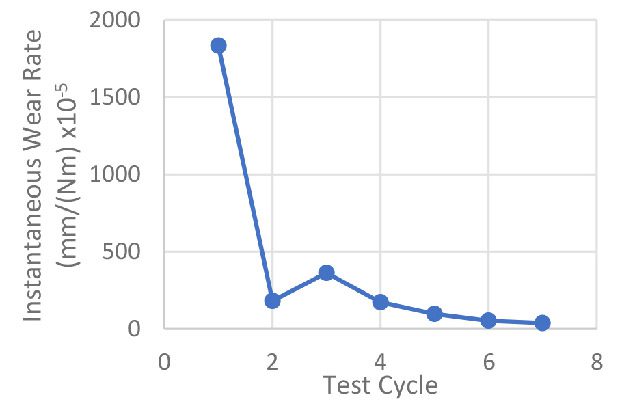
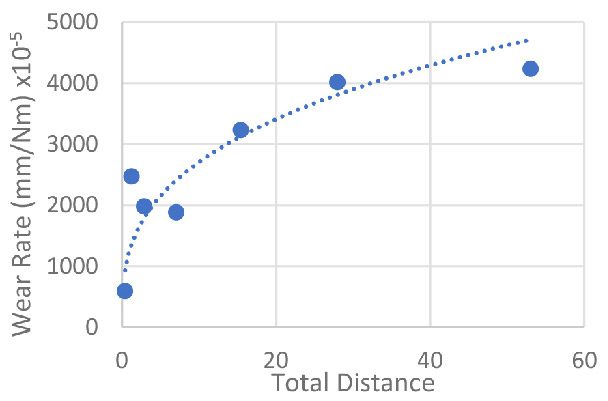
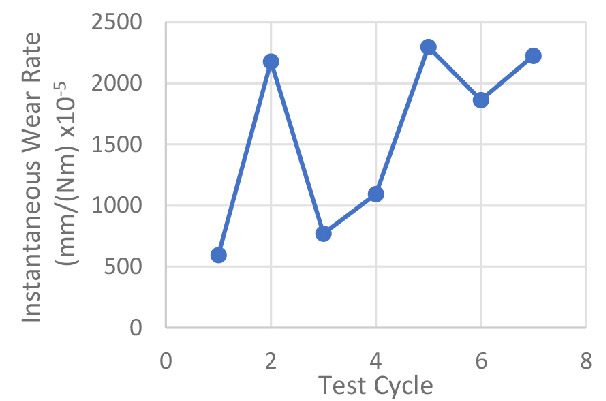
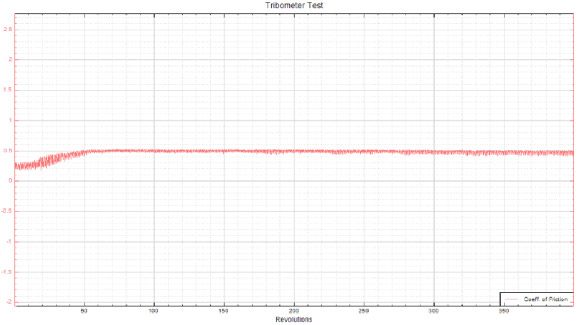
Flooring testing has traditionally centered on the wear rate of a sample to determine its durability against wear. However, progressive wear mapping allows analyzing the sample’s wear rate throughout the test, providing valuable insights into its wear behavior. This in-depth analysis allows for correlations between friction data and wear rate, which can identify the root causes of wear. It should be noted that wear rates are not constant throughout wear tests. Thus, observing the progression of wear gives a more accurate assessment of the sample’s wear. Progressing beyond traditional testing methods, the adoption of progressive wear mapping has contributed to significant advancements in the field of flooring testing.

The NANOVEA T2000 Tribometer with an integrated 3D Non-Contact Profilometer is a groundbreaking solution for wear testing and volume loss measurements. Its ability to move with precision between the pin and the profilometer guarantees the reliability of results by eliminating any deviation in wear track radius or location. But that’s not all – the 3D Non-Contact Profilometer’s advanced capabilities allow for high-speed surface measurements, reducing scanning time to mere seconds. With the capability of applying loads of up to 2,000 N and achieving spinning speeds of up to 5,000 rpm, the NANOVEA T2000 Tribometer offers versatility and precision in the evaluation process. It’s clear that this equipment holds a vital role in progressive wear mapping.

 
flooring wear testing using tribometer
flooring wear testing using profilometer

FIGURE 1: Sample set-up prior to wear testing (left) and post-wear test profilometry of the wear track (right).

MEASUREMENT OBJECTIVE

Progressive wear mapping testing was performed on two types of flooring materials: stone and wood. Each sample underwent a total of 7 test cycles, with increasing test durations of 2, 4, 8, 20, 40, 60, and 120 s, allowing for a comparison of wear over time. After each test cycle, the wear track was profiled using the NANOVEA 3D Non-Contact Profilometer. From the data collected by the profiler, the volume of the hole and wear rate can be analyzed using the integrated features in the NANOVEA Tribometer software or our surface analysis software, Mountains.

NANOVEA T2000 High Load
Pneumatic Tribometer

THE SAMPLES

wear mapping test samples wood and stone

WEAR MAPPING TEST PARAMETERS

LOAD40 N
TEST DURATIONvaries
SPEED200 rpm
RADIUS10 mm
DISTANCEvaries
BALL MATERIALTungsten Carbide
BALL DIAMETER10 mm

Test duration used over the 7 cycles were 2, 4, 8, 20, 40, 60, and 120 seconds, respectively. The distances traveled were 0.40, 0.81, 1.66, 4.16, 8.36, 12.55, and 25.11 meters.

WEAR MAPPING RESULTS

Wood Flooring

Test CycleMax COFMin COFAvg. COF
10.3350.1240.275
20.3370.2070.295
30.3800.2290.329
40.3930.2650.354
50.3520.2050.314
60.3450.1990.312
70.3150.2110.293


RADIAL ORIENTATION

Test CycleTotal Volume Loss (µm3Total Distance
Traveled (m)
Wear Rate
(mm/Nm) x10-5
Instantaneous Wear Rate
(mm/Nm) x10-5
12962476870.401833.7461833.746
23552452271.221093.260181.5637
35963713262.88898.242363.1791
48837477677.04530.629172.5496
5120717995115.40360.88996.69074
6147274531827.95293.32952.89311
7185131921053.06184.34337.69599
wood progressive wear rate vs total distance
Wood Floor Wear Rate

FIGURE 2: Wear rate vs total distance traveled (left)
and instantaneous wear rate vs test cycle (right) for wood flooring.

flooring coefficient of friction testing
progressive wear mapping of wood floor

FIGURE 3: COF graph and 3D view of wear track from test #7 on wood flooring.

wear mapping extracted profile
flooring wear testing results
flooring surface characterization

FIGURE 4: Cross-Sectional Analysis of Wood Wear Track from Test #7

progressive wear mapping volume and area analysis

FIGURE 5: Volume and Area Analysis of Wear Track on Wood Sample Test #7.

WEAR MAPPING RESULTS

Stone Flooring

Test CycleMax COFMin COFAvg. COF
10.2490.0350.186
20.3490.1970.275
30.2940.1540.221
40.5030.1240.273
50.5480.1060.390
60.5100.1290.434
70.5270.1810.472


RADIAL ORIENTATION

Test CycleTotal Volume Loss (µm3Total Distance
Traveled (m)
Wear Rate
(mm/Nm) x10-5
Instantaneous Wear Rate
(mm/Nm) x10-5
1962788460.40595.957595.9573
28042897311.222475.1852178.889
313161478552.881982.355770.9501
431365302157.041883.2691093.013
51082173218015.403235.1802297.508
62017496034327.954018.2821862.899
74251206342053.064233.0812224.187
stone flooring wear rate vs distance
stone flooring instantaneous wear rate chart

FIGURE 6: Wear rate vs total distance travelled (left)
and instantaneous wear rate vs test cycle (right) for stone flooring.

flooring wear tribological testing
stone floor 3d profile of wear track

FIGURE 7: COF graph and 3D view of wear track from test #7 on stone flooring.

stone floor progressive wear mapping extracted profile
stone flooring extracted profile maximum depth and height area of the hole and peak
tribology testing of flooring

FIGURE 8: Cross-Sectional Analysis of Stone Wear Track from Test #7.

wood floor progressive wear mapping volume analysis

FIGURE 9: Volume and Area Analysis of Wear Track on Stone Sample Test #7.

DISCUSSION

The instantaneous wear rate is calculated with the following equation:
progressive wear mapping of flooring formula

Where V is the volume of a hole, N is the load, and X is the total distance, this equation describes the wear rate between test cycles. The instantaneous wear rate can be used to better identify changes in wear rate throughout the test.

Both samples have very different wear behaviors. Over time, the wood flooring starts with a high wear rate but quickly drops to a smaller, steady value. For the stone flooring, the wear rate appears to start at a low value and trends to a higher value over cycles. The instantaneous wear rate also shows little consistency. The specific reason for the difference is not certain but may be due to the structure of the samples. The stone flooring seems to consist of loose grain-like particles, which would wear differently compared to the wood’s compact structure. Additional testing and research would be needed to ascertain the cause of this wear behavior.

The data from the coefficient of friction (COF) seems to agree with the observed wear behavior. The COF graph for the wood flooring appears consistent throughout the cycles, complementing its steady wear rate. For the stone flooring, the average COF increases throughout the cycles, similar to how the wear rate also increases with cycles. There are also apparent changes in the shape of the friction graphs, suggesting changes in how the ball is interacting with the stone sample. This is most apparent in cycle 2 and cycle 4.

CONCLUSION

The NANOVEA T2000 Tribometer showcases its ability to perform progressive wear mapping by analyzing the wear rate between two different flooring samples. Pausing the continuous wear test and scanning the surface with the NANOVEA 3D Non-Contact Profilometer provides valuable insights into the material’s wear behavior over time.

The NANOVEA T2000 Tribometer with the integrated 3D Non-Contact Profilometer provides a wide variety of data, including COF (Coefficient of Friction) data, surface measurements, depth readings, surface visualization, volume loss, wear rate, and more. This comprehensive set of information allows users to gain a deeper understanding of the interactions between the system and the sample. With its controlled loading, high precision, ease of use, high loading, wide speed range, and additional environmental modules, the NANOVEA T2000 Tribometer takes tribology to the next level.

Roughness Mapping Inspection using 3D Profilometry

ROUGHNESS MAPPING INSPECTION

USING 3D PROFILOMETRY

Prepared by

DUANJIE, PhD

INTRODUCTION

Surface roughness and texture are critical factors that impact the final quality and performance of a product. A thorough understanding of surface roughness, texture, and consistency is essential for selecting the best processing and control measures. Fast, quantifiable, and reliable inline inspection of product surfaces is in need to identify the defective products in time and optimize production line conditions.

IMPORTANCE OF 3D NON-CONTACT PROFILOMETER FOR IN-LINE SURFACE INSPECTION

Surface defects in products result from materials processing and product manufacturing. Inline surface quality inspection ensures the tightest quality control of the end products. NANOVEA 3D Non-Contact Optical Profilers utilize Chromatic Light technology with unique capability to determine the roughness of a sample without contact. The line sensor enables scanning of the 3D profile of a large surface at a high speed. The roughness threshold, calculated in real-time by the analysis software, serves as a fast and reliable pass/fail tool.

MEASUREMENT OBJECTIVE

In this study, the NANOVEA ST400 equipped with a high-speed sensor is used to inspect the surface of a Teflon sample with defect to showcase the capability of NANOVEA

Non-Contact Profilometers in providing fast and reliable surface inspection in a production line.

NANOVEA

ST400

RESULTS & DISCUSSION

3D Surface Analysis of the Roughness Standard Sample

The surface of a Roughness Standard was scanned using a NANOVEA ST400 equipped with a high-speed sensor that generates a bright line of 192 points, as shown in FIGURE 1. These 192 points scan the sample surface at the same time, leading to significantly increased scan speed.

FIGURE 2 shows false color views of the Surface Height Map and Roughness Distribution Map of the Roughness Standard Sample. In FIGURE 2a, the Roughness Standard exhibits a slightly slanted surface as represented by the varied color gradient in each of the standard roughness blocks. In FIGURE 2b, homogeneous roughness distribution is shown in different roughness blocks, the color of which represents the roughness in the blocks.

FIGURE 3 shows the examples of the Pass/Fail Maps generated by the Analysis Software based on different Roughness Thresholds. The roughness blocks are highlighted in red when their surface roughness is above a certain set threshold value. This provides a tool for the user to set up a roughness threshold to determine the quality of a sample surface finish.

FIGURE 1: Optical line sensor scanning on the Roughness Standard sample

a. Surface Height Map:

b. Roughness Map:

FIGURE 2: False color views of the Surface Height Map and Roughness Distribution Map of the Roughness Standard Sample.

FIGURE 3: Pass/Fail Map based on the Roughness Threshold.

Surface Inspection of a Teflon Sample with Defects

Surface Height Map, Roughness Distribution Map and Pass/Fail Roughness Threshold Map of the Teflon sample surface are shown in FIGURE 4. The Teflon Sample has a ridge form at the right center of the sample as shown in the Surface Height Map.

a. Surface Height Map:

The different colors in the pallet of FIGURE 4b represents the roughness value on the local surface. The Roughness Map exhibits a homogeneous roughness in the intact area of the Teflon sample. However, the defects, in the forms of an indented ring and a wear scar are highlighted in bright color. The user can easily set up a Pass/Fail roughness threshold to locate the surface defects as shown in FIGURE 4c. Such a tool allows users to monitor in situ the product surface quality in the production line and discover defective products in time. The real-time roughness value is calculated and recorded as the products pass by the in-line optical sensor, which can serve as a fast but reliable tool for quality control.

b. Roughness Map:

c. Pass/Fail Roughness Threshold Map:

FIGURE 4: Surface Height Map, Roughness Distribution Map and Pass/Fail Roughness Threshold Map of the Teflon sample surface.

CONCLUSION

In this application, we have shown how the NANOVEA ST400 3D Non-Contact Optical Profiler equipped with an optical line sensor works as a reliable quality control tool in an effective and efficient manner.

The optical line sensor generates a bright line of 192 points that scan the sample surface at the same time, leading to significantly increased scan speed. It can be installed in the production line to monitor the surface roughness of the products in situ. The roughness threshold works as a dependable criteria to determine the surface quality of the products, allowing users to notice the defective products in time.

The data shown here represents only a portion of the calculations available in the analysis software. NANOVEA Profilometers measure virtually any surface in fields including Semiconductor, Microelectronics, Solar, Fiber Optics, Automotive, Aerospace, Metallurgy, Machining, Coatings, Pharmaceutical, Biomedical, Environmental and many others.

Weld Surface Inspection Using a Portable 3D Profilometer

WELd surface inspection

using a portable 3d profilometer

Prepared by

CRAIG LEISING

INTRODUCTION

It may become critical for a particular weld, typically done by visual inspection, to be investigated with an extreme level of precision. Specific areas of interest for precise analysis include surface cracks, porosity and unfilled craters, regardless of subsequent inspection procedures. Weld characteristics such as dimension/shape, volume, roughness, size etc. can all be measured for critical evaluation.

IMPORTANCE OF 3D NON-CONTACT PROFILOMETER FOR WELD SURFACE INSPECTION

Unlike other techniques such as touch probes or interferometry, the NANOVEA 3D Non-Contact Profilometer, using axial chromatism, can measure nearly any surface, sample sizes can vary widely due to open staging and there is no sample preparation needed. Nano through macro range is obtained during surface profile measurement with zero influence from sample reflectivity or absorption, has advanced ability to measure high surface angles and there is no software manipulation of results. Easily measure any material: transparent, opaque, specular, diffusive, polished, rough etc. The 2D and 2D capabilities of the NANOVEA Portable Profilometers make them ideal instruments for full complete weld surface inspection both in the lab and in the field.

MEASUREMENT OBJECTIVE

In this application, the NANOVEA JR25 Portable Profiler is used to measure the surface roughness, shape and volume of a weld, as well as the surrounding area. This information can provide critical information to properly investigate the quality of the weld and weld process.

NANOVEA

JR25

TEST RESULTS

The image below shows the full 3D view of the weld and the surrounding area along with the surface parameters of the weld only. The 2D cross section profile is shown below.

the sample

With the above 2D cross section profile removed from the 3D, dimensional information of the weld is calculated below. Surface area and volume of material calculated for the weld only below.

 HOLEPEAK
SURFACE1.01 mm214.0 mm2
VOLUME8.799e-5 mm323.27 mm3
MAX DEPTH/HEIGHT0.0276 mm0.6195 mm
MEAN DEPTH/HEIGHT 0.004024 mm 0.2298 mm

CONCLUSION

In this application, we have shown how the NANOVEA 3D Non-Contact Profiler can precisely characterize critical characteristics of a weld and the surrounding surface area. From the roughness, dimensions and volume, a quantitative method for quality and repeatability can be determined and or further investigated. Sample welds, such as the example in this app note, can be easily analyzed, with a standard tabletop or portable NANOVEA Profiler for in-house or field testing

Fractography Analysis Using 3D Profilometry

FRACTOGRAPHY ANALYSIS

USING 3D PROFILOMETRY

Prepared by

CRAIG LEISING

INTRODUCTION

Fractography is the study of features on fractured surfaces and has historically been investigated via Microscope or SEM. Depending on the size of the feature, a microscope (macro features) or SEM (nano and micro features) are selected for the surface analysis. Both ultimately allowing for the identification of the fracture mechanism type. Although effective, the Microscope has clear limitations and the SEM in most cases, other than atomic-level analysis, is unpractical for fracture surface measurement and lacks broader use capability. With advances in optical measurement technology, the NANOVEA 3D Non-Contact Profilometer is now considered the instrument of choice, with its ability to provide nano through macro-scale 2D & 3D surface measurements

IMPORTANCE OF 3D NON-CONTACT PROFILOMETER FOR FRACTURE INSPECTION

Unlike an SEM, a 3D Non-Contact Profilometer can measure nearly any surface, sample size, with minimal sample prep, all while offering superior vertical/horizontal dimensions to that of an SEM. With a profiler, nano through macro range features are captured in a single measurement with zero influence from sample reflectivity. Easily measure any material: transparent, opaque, specular, diffusive, polished, rough etc. The 3D Non-Contact Profilometer provides broad and user-friendly capability to maximize surface fracture studies at a fraction of the cost of an SEM.

MEASUREMENT OBJECTIVE

In this application, the NANOVEA ST400 is used to measure the fractured surface of a steel sample. In this study, we will showcase a 3D area, 2D profile extraction and surface directional map of the surface.

NANOVEA

ST400

RESULTS

TOP SURFACE

3D Surface Texture Direction

Isotropy51.26%
First Direction123.2º
Second Direction116.3º
Third Direction0.1725º

Surface Area, Volume, Roughness and many others can be automatically calculated from this extraction.

2D Profile Extraction

RESULTS

SIDE SURFACE

3D Surface Texture Direction

Isotropy15.55%
First Direction0.1617º
Second Direction110.5º
Third Direction171.5º

Surface Area, Volume, Roughness and many others can be automatically calculated from this extraction.

2D Profile Extraction

CONCLUSION

In this application, we have shown how the NANOVEA ST400 3D Non-Contact Profilometer can precisely characterize the full topography (nano, micro and macro features) of a fractured surface. From the 3D area, the surface can be clearly identified and subareas or profiles/cross-sections can be quickly extracted and analyzed with an endless list of surface calculations. Sub nanometer surface features can be further analyzed with an integrated AFM module.

Additionally, NANOVEA has included a portable version to their Profilometer line-up, especially critical for field studies where a fracture surface is immovable. With this broad list of surface measurement capabilities, fracture surface analysis has never been easier and more convenient with a single instrument.

Sandpaper Abrasion Performance Using a Tribometer

SANDPAPER ABRASION PERFORMANCE

USING A TRIBOMETER

sandpaper abrasion testing

Prepared by

DUANJIE LI, PhD

INTRODUCTION

Sandpaper consists of abrasive particles glued to one face of a paper or cloth. Various abrasive materials can be used for the particles, such as garnet, silicon carbide, aluminum oxide and diamond. Sandpaper is widely applied in a variety of industrial sectors to create specific surface finishes on wood, metal and drywall. They often work under high pressure contact applied by hand or power tools.

IMPORTANCE OF EVALUATING SANDPAPER ABRASION PERFORMANCE

The effectiveness of sandpaper is often determined by its abrasion performance under different conditions. The grit size, i.e. the size of the abrasive particles embedded in the sandpaper, determines the wear rate and the scratch size of the material being sanded. Sandpapers of higher grit numbers have smaller particles, resulting in lower sanding speeds and finer surface finishes. Sandpapers with the same grit number but made of different materials can have unalike behaviors under dry or wet conditions. Reliable tribological evaluations are needed to ensure that manufactured sandpaper possesses the desired abrasive behavior intended. These evaluations allow users to quantitatively compare the wear behaviors of different types of sandpapers in a controlled and monitored manner in order to select the best candidate for the target application.

MEASUREMENT OBJECTIVE

In this study, we showcase the NANOVEA T2000 High Load Pneumatic Tribometer’s ability to quantitatively evaluate the abrasion performance of various sandpaper samples under dry and wet conditions.

NANOVEA T2000 High Load
Pneumatic Tribometer

TEST PROCEDURES

The coefficient of friction (COF) and the abrasion performance of two types of sandpapers were evaluated by the NANOVEA T100 Tribometer. A 440 stainless steel ball was used as the counter material. The ball wear scars were examined after each wear test using the NANOVEA 3D Non-Contact Optical Profiler to ensure precise volume loss measurements.

Please note that a 440 stainless steel ball was chosen as the counter material to create a comparative study but any solid material could be substituted to simulate a different application condition.

sandpaper abrasion testing parameters
sandpaper tribology testing

TEST RESULTS & DISCUSSION

FIGURE 1 shows a COF comparison of Sandpaper 1 and 2 under dry and wet environmental conditions. Sandpaper 1, under dry conditions, shows a COF of 0.4 at the beginning of the test which progressively decreases and stabilizes to 0.3. Under wet conditions, this sample exhibits a lower average COF of 0.27. In contrast, Sample 2’s COF results show a dry COF of 0.27 and wet COF of ~ 0.37. 

Please note the oscillation in the data for all COF plots was caused by the vibrations generated by the sliding movement of the ball against the rough sandpaper surfaces.

sandpaper abrasion cof

FIGURE 1: Evolution of COF during the wear tests.

FIGURE 2 summarizes the results of the wear scar analysis. The wear scars were measured using an optical microscope and a NANOVEA 3D Non-Contact Optical Profiler. FIGURE 3 and FIGURE 4 compare the wear scars of the worn SS440 balls post wear tests on Sandpaper 1 and 2 (wet and dry conditions). As shown in FIGURE 4 the NANOVEA Optical Profiler precisely captures the surface topography of the four balls and their respective wear tracks which were then processed with the NANOVEA Mountains Advanced Analysis software to calculate volume loss and wear rate. On the microscope and profile image of the ball it can be observed that the ball used for Sandpaper 1 (dry) testing exhibited a larger flattened wear scar compared to the others with a volume loss of 0.313 mm3. In contrast, the volume loss for Sandpaper 1 (wet) was 0.131 mm3. For Sandpaper 2 (dry) the volume loss was 0.163 mm3 and for Sandpaper 2 (wet) the volume loss increased to 0.237 mm3.

Moreover, it is interesting to observe that the COF played an important role in the abrasion performance of the sandpapers. Sandpaper 1 exhibited higher COF in the dry condition, leading to a higher abrasion rate for the SS440 ball used in the test. In comparison, the higher COF of Sandpaper 2 in the wet condition resulted in a higher abrasion rate. The wear tracks of the sandpapers after the measurements are displayed in FIGURE 5.

Both Sandpapers 1 and 2 claim to work in either dry and wet environments. However, they exhibited significantly different abrasion performance in the dry and wet conditions. NANOVEA tribometers provide well-controlled quantifiable and reliable wear assessment capabilities that ensure reproducible wear evaluations. Moreover, the capacity of in situ COF measurement allows users to correlate different stages of a wear process with the evolution of COF, which is critical in improving fundamental understanding of the wear mechanism and tribological characteristics of sandpaper

sandpaper abrasion tribology testing

FIGURE 2: Wear scar volume of the balls and average COF under different conditions.

sandpaper abrasion test - dry
sandpaper abrasion testing - dry
sandpaper abrasion test - wet
sandpaper abrasion testing - wet

FIGURE 3: Wear scars of the balls after the tests.

sandpaper abrasion - profilometry
sandpaper abrasion - surface profile
sandpaper abrasion test - 3d surface profile
sandpaper abrasion testing - 3d surface scan

FIGURE 4: 3D morphology of the wear scars on the balls.

sandpaper abrasion test results
sandpaper abrasion testing results
sandpaper abrasion tribology test results
sandpaper abrasion testing results

FIGURE 5: Wear tracks on the sandpapers under different conditions.

CONCLUSION

The abrasion performance of two types of sandpapers of the same grit number were evaluated under dry and wet conditions in this study. The service conditions of the sandpaper play a critical role in the effectiveness of the work performance. Sandpaper 1 possessed significantly better abrasion behavior under dry conditions, while Sandpaper 2 performed better under wet conditions. The friction during the sanding process is an important factor to consider when evaluating abrasion performance. The NANOVEA Optical Profiler precisely measures the 3D morphology of any surface, such as wear scars on a ball, ensuring reliable evaluation on the abrasion performance of the sandpaper in this study. The NANOVEA Tribometer measures the coefficient of friction in situ during a wear test, providing an insight on the different stages of a wear process. It also offers repeatable wear and friction testing using ISO and ASTM compliant rotative and linear modes, with optional high temperature wear and lubrication modules available in one pre-integrated system. This unmatched range allows users to simulate different severe work environment of the ball bearings including high stress, wear and high temperature, etc. It also provides an ideal tool to quantitatively assess the tribological behaviors of superior wear resistant materials under high loads.

Processed Leather Surface Finish using 3D Profilometry

PROCESSED LEATHER

SURFACE FINISH USING 3D PROFILOMETRY

Prepared by

CRAIG LEISING

INTRODUCTION

Once the tanning process of a leather hide is complete the leather surface can undergo several finishing processes for a variety of looks and touch. These mechanical processes can include stretching, buffing, sanding, embossing, coating etc. Dependent upon the end use of the leather some may require a more precise, controlled and repeatable processing.

IMPORTANCE OF PROFILOMETRY INSPECTION FOR R&D AND QUALITY CONTROL

Due to the large variation and unreliability of visual inspection methods, tools that are capable of accurately quantifying micro and nano scales features can improve leather finishing processes. Understanding the surface finish of leather in a quantifiable sense can lead to improved data driven surface processing selection to achieve optimal finish results. NANOVEA 3D Non-Contact Profilometers utilize chromatic confocal technology to measure finished leather surfaces and offer the highest repeatability and accuracy in the market. Where other techniques fail to provide reliable data, due to probe contact, surface variation, angle, absorption or reflectivity, NANOVEA Profilometers succeed.

MEASUREMENT OBJECTIVE

In this application, the NANOVEA ST400 is used to measure and compare the surface finish of two different but closely processed leather samples. Several surface parameters are automatically calculated from the surface profile.

Here we will focus on surface roughness, dimple depth, dimple pitch and dimple diameter for comparative evaluation.

NANOVEA

ST400

RESULTS: SAMPLE 1

ISO 25178

HEIGHT PARAMETERS

OTHER 3D PARAMETERS

RESULTS: SAMPLE 2

ISO 25178

HEIGHT PARAMETERS

OTHER 3D PARAMETERS

DEPTH COMPARATIVE

Depth distribution for each sample.
A large number of deep dimples were observed in
SAMPLE 1.

PITCH COMPARATIVE

Pitch between dimples on SAMPLE 1 is slightly smaller
than
SAMPLE 2, but both have a similar distribution

 MEAN DIAMETER COMPARATIVE

Similar distributions of mean diameter of dimples,
with
SAMPLE 1 showing slightly smaller mean diameters on average.

CONCLUSION

In this application, we have shown how the NANOVEA ST400 3D Profilometer can precisely characterize the surface finish of processed leather. In this study, having the ability to measure surface roughness, dimple depth, dimple pitch and dimple diameter allowed us to quantify differences between the finish and quality of the two samples that may not be obvious by visual inspection.

Overall there were no visible difference in the appearance of the 3D scans between SAMPLE 1 and SAMPLE 2. However, in the statistical analysis there is a clear distinction between the two samples. SAMPLE 1 contains a higher quantity of dimples with smaller diameters, larger depths and smaller dimple-to-dimple pitch in comparison to SAMPLE 2.

Please note that additional studies are available. Special areas of interest could have been further analyzed with an integrated AFM or Microscope module. NANOVEA 3D Profilometer speeds range from 20 mm/s to 1 m/s for laboratory or research to meet the needs of high-speed inspection; can be built with custom sizing, speeds, scanning capabilities, Class 1 clean room compliance, indexing conveyor or for in-line or online integration.

Piston Wear Testing

PISTON WEAR TESTINGUSING NANOVEA TRIBOMETER

Piston wear testing using NANOVEA tribometer under lubricated conditions.

Prepared by

FRANK LIU

What Is Piston Wear Testing?

Piston wear testing evaluates the friction, lubrication, and material durability between piston skirts and cylinder liners under controlled laboratory conditions. Using a tribometer, engineers can replicate real reciprocating motion and precisely measure the coefficient of friction, wear rate, and 3D surface topography. These results provide key insights into the tribological behavior of coatings, lubricants, and alloys used in engine pistons, helping optimize performance, fuel efficiency, and long-term reliability.

schematic showing piston skirt and cylinder liner lubrication interface during wear testing

 Schematic of power cylinders system and piston skirt-lubricant-cylinder liner interfaces.

💡 Want to quantify wear rate and friction of your own samples? Request a custom tribology test tailored to your application.

Why Piston Wear Testing Matters in Engine Development

Motor oil is a lubricant that is well-designed for its application. In addition to the base oil, additives such as detergents, dispersants, viscosity improver (VI), anti-wear/anti-friction agents, and corrosion inhibitors are added to improve its performance. These additives affect how the oil behaves under different operating conditions. The behavior of oil affects the P-L-C interfaces and determines if significant wear from metal-metal contact or if hydrodynamic lubrication (very little wear) is occurring.

It is difficult to understand the P-L-C interfaces without isolating the area from external variables. It is more practical to simulate the event with conditions that are representative of its real-life application. The NANOVEA Tribometer is ideal for this. Equipped with multiple force sensors, depth sensor, a drop-by-drop lubricant module, and linear reciprocating stage, the NANOVEA T2000 is able to closely mimic events occurring within an engine block and obtain valuable data to better understand the P-L-C interfaces.

nanovea tribometer piston wear and friction testing module setup

Liquid Module on the NANOVEA T2000 Tribometer

The drop-by-drop module is crucial for this study. Since pistons can move at a very fast rate (above 3000 rpm), it is difficult to create a thin film of lubricant by submerging the sample. To remedy this issue, the drop-by-drop module is able to consistently apply a constant amount of lubricant onto the piston skirt surface.

Application of fresh lubricant also removes concern of dislodged wear contaminants influencing the lubricant’s properties.

How Tribometers Simulate
Real Piston–Liner Wear

The piston skirt-lubricant-cylinder liner interfaces will be studied in this report. The interfaces will be replicated by conducting a linear reciprocating wear test with drop-by-drop lubricant module.

The lubricant will be applied at room temperature and heated conditions to compare cold start and optimal operation conditions. The COF and wear rate will be observed to better understand how the interfaces behaves in real-life applications.

NANOVEA T2000
High Load Tribometer

Piston Wear Test Parameters & Setup

LOAD ………………………. 100 N

TEST DURATION ………………………. 30 min

SPEED ………………………. 2000 rpm

AMPLITUDE ………………………. 10 mm

TOTAL DISTANCE ………………………. 1200 m

SKIRT COATING ………………………. Moly-graphite

PIN MATERIAL ………………………. Aluminum Alloy 5052

PIN DIAMETER ………………………. 10 mm

LUBRICANT ………………………. Motor Oil (10W-30)

APPROX. FLOW RATE ………………………. 60 mL/min

TEMPERATURE ………………………. Room temp & 90°C

Real-World Relevance of
Piston Wear Testing

Tribometer-based piston wear testing provides critical insight into how material choices and lubrication strategies affect real engine reliability. Instead of relying on costly full-engine tests, laboratories can evaluate coatings, oils, and alloy surfaces under realistic mechanical load and temperature conditions. NANOVEA’s 3D profilometry and tribology modules allow precise mapping of wear depth and friction stability, helping R&D teams optimize performance and reduce development cycles.

Piston Wear Test Results & Analysis

piston wear scar comparison from tribometer lubricated wear test

In this experiment, A5052 was used as the counter material. While engine blocks are usually made of cast aluminum such as A356, A5052 have mechanical properties similar to A356 for this simulative testing [1].

Under the testing conditions, significant wear was observed on the piston skirt at room temperature compared to at 90°C. The deep scratches seen on the samples suggest that contact between the static material and the piston skirt occurs frequently throughout the test. The high viscosity at room temperature may be restricting the oil from completely filling gaps at the interfaces and creating metal-metal contact. At higher temperature, the oil thins and is able to flow between the pin and the piston. As a result, significantly less wear is observed at higher temperature. FIGURE 5 shows one side of the wear scar wore significantly less than the other side. This is most likely due to the location of the oil output. The lubricant film thickness was thicker on one side than the other, causing uneven wearing.

[1] “5052 Aluminum vs 356.0 Aluminum.” MakeItFrom.com, makeitfrom.com/compare/5052-O-Aluminum/A356.0-SG70B-A13560-Cast-Aluminum

The COF of linear reciprocating tribology tests can be split into a high and low pass. High pass refers to the sample moving in the forward, or positive, direction and low pass refers to the sample moving in the reverse, or negative, direction. The average COF for the RT oil was observed to be under 0.1 for both directions. The average COF between passes were 0.072 and 0.080. The average COF of the 90°C oil was found to be different between passes. Average COF values of 0.167 and 0.09 were observed. The difference in COF gives additional proof that the oil was only able to properly wet one side of the pin. High COF was obtained when a thick film was formed between the pin and the piston skirt due to hydrodynamic lubrication occurring. Lower COF is observed in the other direction when mixed lubrication is occurring. For more information on hydrodynamic lubrication and mixed lubrication, please visit our application note on Stribeck Curves.
coefficient of friction and wear rate results from lubricated piston wear test

Table 1: Results from lubricated wear test on pistons.

friction coefficient graphs for piston wear test at room temperature showing raw high and low pass profiles

FIGURE 1: COF graphs for room temperature oil wear test A raw profile B high pass C low pass.

friction coefficient graphs for piston wear test at 90 degrees Celsius showing raw high and low pass profiles

FIGURE 2: COF graphs for 90°C wear oil test A raw profile B high pass C low pass.

optical microscope image of piston wear scar from room temperature motor oil wear test

FIGURE 3: Optical image of wear scar from RT motor oil wear test.

piston surface showing localized wear scar highlighted for tribological analysis
volume and depth analysis of piston wear scar from tribometer test

FIGURE 4: Volume of a hole analysis of wear scar from RT motor oil wear test.

3d surface profilometry scan of piston wear scar showing wear depth and roughness

FIGURE 5: Profilometry scan of wear scar from RT motor oil wear test.

optical microscope image of piston wear scar from 90 degree motor oil wear test

FIGURE 6: Optical image of wear scar from 90°C motor oil wear test

piston skirt showing wear zone analyzed during tribometer piston wear testing
volume and depth measurement of piston wear scar from 90 degree motor oil tribometer test

FIGURE 7: Volume of a hole analysis of wear scar from 90°C motor oil wear test.

3d surface profilometry scan of piston wear scar from 90 degree motor oil wear test showing wear depth and texture

FIGURE 8: Profilometry scan of wear scar from 90°C motor oil wear test.

Conclusion: Engine Wear Evaluation with NANOVEA Tribometers

Lubricated linear reciprocating wear testing was conducted on a piston to simulate events occurring in a real-life operational engine. The piston skirt-lubricant-cylinder liner interfaces is crucial to the operations of an engine. The lubricant thickness at the interface is responsible for energy loss due to friction or wear between the piston skirt and cylinder liner. To optimize the engine, the film thickness must be as thin as possible without allowing the piston skirt and cylinder liner to touch. The challenge, however, is how changes in temperature, speed, and force will affect the P-L-C interfaces.

With its wide range of loading (up to 2000 N) and speed (up to 15000 rpm), the NANOVEA T2000 tribometer is able to simulate different conditions possible in an engine. Possible future studies on this topic include how the P-L-C interfaces will behave under different constant load, oscillated load, lubricant temperature, speed, and lubricant application method. These parameters can be easily adjusted with the NANOVEA T2000 tribometer to give a complete understanding on the mechanisms of the piston skirt-lubricant-cylinder liner interfaces

ℹ️ Interested in brake pad testing? Learn more about our dedicated brake friction tester for pads, linings, and automotive R&D.

Styrofoam Surface Boundary Measurement Profilometry

Surface Boundary Measurement

Surface Boundary Measurement Using 3D Profilometry

Learn more


SURFACE BOUNDARY MEASUREMENT

USING 3D PROFILOMETRY

Prepared by

Craig Leising

INTRODUCTION

In studies where the interface of surface features, patterns, shapes etc., are being evaluated for orientation, it will be useful to quickly identify areas of interest over the entire profile of measurement. By segmenting a surface into significant areas the user can quickly evaluate boundaries, peaks, pits, areas, volumes and many others to understand their functional role in the entire surface profile under study. For example, like that of a grain boundary imaging of metals, the importance of analysis is the interface of many structures and their overall orientation. By understanding each area of interest defects and or abnormalities within the overall area can be identified. Although grain boundary imaging is typically studied at a range surpassing Profilometer capability, and is only 2D image analysis, it is a helpful reference to illustrate the concept of what will be shown here on a larger scale along with 3D surface measurement advantages.

IMPORTANCE OF 3D NON CONTACT PROFILOMETER FOR SURFACE SEPARATION STUDY

Unlike other techniques such as touch probes or interferometry, the 3D Non Contact Profilometer, using axial chromatism, can measure nearly any surface, sample sizes can vary widely due to open staging and there is no sample preparation needed. Nano through macro range is obtained during surface profile measurement with zero influence from sample reflectivity or absorption, has advanced ability to measure high surface angles and there is no software manipulation of results. Easily measure any material: transparent, opaque, specular, diffusive, polished, rough etc. The technique of the Non Contact Profilometer provides an ideal, broad and user friendly capability to maximize surface studies when surface boundary analysis will be needed; along with the benefits of combined 2D & 3D capability.

MEASUREMENT OBJECTIVE

In this application the Nanovea ST400 Profilometer is used to measure the surface area of Styrofoam. Boundaries were established by combining a reflected intensity file along with the topography, which are simultaneously acquired using the NANOVEA ST400. This data was then used to calculate different shape and size information of each Styrofoam “grain”.

NANOVEA

ST400

RESULTS & DISCUSSION: 2D Surface Boundary Measurement

Topography image(below left) masked by reflected intensity image(below right) to clearly define grain boundaries. All grains below 565µm diameter have been ignored by applying filter.

Total number of grains: 167
Total projected area occupied by the grains: 166.917 mm² (64.5962 %)
Total projected area occupied by boundaries: (35.4038 %)
Density of grains: 0.646285 grains / mm2

Area = 0.999500 mm² +/- 0.491846 mm²
Perimeter = 9114.15 µm +/- 4570.38 µm
Equivalent diameter = 1098.61 µm +/- 256.235 µm
Mean diameter = 945.373 µm +/- 248.344 µm
Min diameter = 675.898 µm +/- 246.850 µm
Max diameter = 1312.43 µm +/- 295.258 µm

RESULTS & DISCUSSION: 3D Surface Boundary Measurement

By using the 3D topography data obtained, the volume, height, peak, aspect ratio and general shape information can be analyzed on each grain. Total 3D area occupied: 2.525mm3

CONCLUSION

In this application, we have shown how the NANOVEA 3D Non Contact Profilometer can precisely characterize the surface of Styrofoam. Statistical information can be gained over the entire surface of interest or on individual grains, whether they are peaks or pits. In this example all grains larger than a user defined size were used to show the area, perimeter, diameter and height. The features shown here can be critical to research and quality control of natural and pre fabricated surfaces ranging from bio medical to micromachining applications along with many others. 

Contour Measurement using Profilometer by NANOVEA

Tire Tread Depth & Rubber Surface Roughness Measurement | 3D Optical Profiler

TIRE TREAD DEPTH & RUBBER SURFACE ROUGHNESS MEASUREMENT using 3D Optical Profiler

Tire tread depth measurement reference showing multiple car tire tread patterns

Prepared by

ANDREA HERRMANN

While tire tread depth is commonly measured with handheld gauges for consumer safety, industrial R&D and tire manufacturers require more advanced methods. This application note demonstrates how a 3D optical profilometer provides precise tire tread depth measurement, contour mapping, and rubber surface roughness analysis for high-accuracy studies.

INTRODUCTION

Like all materials, rubber’s coefficient of friction is related in part to its surface roughness. In vehicle tires, both tread depth and surface roughness directly affect traction, braking, and wear performance. In this study, the rubber surface and tread’s roughness and dimensions are analyzed using 3D non-contact profilometry.
Tire sample used for tread depth and rubber surface roughness measurement

THE SAMPLE

IMPORTANCE OF 3D NON-CONTACT PROFILOMETRY FOR TIRE TREAD DEPTH MEASUREMENT

Unlike other techniques such as touch probes or interferometry, NANOVEA’s 3D Non-Contact Optical Profilers use axial chromatism to measure nearly any surface.

The Profiler system’s open staging allows for a wide variety of sample sizes and requires zero sample preparation. With a single scan, users can capture both overall tire tread depth and micro-level surface roughness, with zero influence from sample reflectivity or absorption. Plus, these profilers have the advanced ability to measure high surface angles without requiring software manipulation of results.

This versatility makes NANOVEA profilers ideal for both tire tread wear testing and advanced rubber material research.

MEASUREMENT OBJECTIVE

In this application, we showcase the NANOVEA ST400, a 3D Non-Contact Optical Profiler measuring tire tread depth, contour geometry, and rubber surface roughness. A sample surface area large enough to represent the entire tire surface was selected at random for this study. To quantify the rubber’s characteristics, we used the NANOVEA Ultra 3D analysis software to measure groove dimensions, tread depth, surface roughness, and developed vs. projected area.

NANOVEA ST400 Standard
Optical 3D Profilometer

ANALYSIS: TIRE TREAD
The 3D View and False Color View of the treads show the value of mapping 3D surface designs. This provides engineers with a straightforward tool to evaluate tread depth uniformity, groove design, and wear from multiple angles. The Advanced Contour Analysis and Step Height Analysis are both extremely powerful tools for measuring precise dimensions of sample shapes and design.
False color 3D optical profilometry of tire tread depth and groove geometry
3D profilometer surface view of tire tread depth measurement

ADVANCED CONTOUR ANALYSIS

Advanced contour analysis of tire tread grooves using 3D profilometry

STEP HEIGHT ANALYSIS

Step height analysis for tire tread depth measurement with 3D optical profiler
3D profilometry step height profile showing tire tread depth measurement
ANALYSIS: RUBBER SURFACE
The rubber surface can be quantified in numerous ways using built-in software tools as shown in the following figures. It can be observed that the surface roughness is 2.688 μm, and the developed area vs. projected area is 9.410 mm² vs. 8.997 mm². These results demonstrate how rubber surface roughness affects traction and performance, enabling comparisons between different rubber formulations or varying levels of surface wear.
Rubber surface roughness analysis with 3D optical profilometer
ISO 25178 Height Parameters of Tire Rubber Surface
3D optical profilometry view of rubber surface roughness and developed area
Tire Rubber Surface Profiler Parameters

CONCLUSION

In this application, we have shown how the NANOVEA 3D Non-Contact Optical Profiler can precisely characterize tire tread depth, contour dimensions, and rubber surface roughness. The data shows a surface roughness of 2.69 µm and a developed area of 9.41 mm² with a projected area of 9 mm². Various dimensions and radii of the rubber treads were measured as well. This information can be used by tire manufacturers, automotive researchers, and materials engineers to compare tread designs, rubber formulations, or tires with varying degrees of wear. The data shown here represents only a portion of the calculations available in the Ultra 3D analysis software.

Fish Scale Surface Analysis Using 3D Optical Profiler

Fish Scale Surface Analysis Using 3D Optical Profiler

Learn more


FISH SCALE SURFACE ANALYSIS

using 3D OPTICAL PROFILER

Fish Scales profilometer

Prepared by

Andrea Novitsky

INTRODUCTION

The morphology, patterns, and other features of a fish scale are studied using the NANOVEA 3D Non-Contact Optical Profiler. The delicate nature of this biological sample along with its very small and high angled grooves also highlights the importance of the profiler’s non-contact technique. The grooves on the scale are called circuli, and can be studied to estimate the age of the fish, and even distinguish periods of different rates of growth, similar to the rings of a tree. This is very important information for the management of wild fish populations in order to prevent overfishing.

Importance of 3D Non-Contact Profilometry FOR BIOLOGICAL STUDIES

Unlike other techniques such as touch probes or interferometry, the 3D Non-Contact Optical Profiler, using axial chromatism, can measure nearly any surface. Sample sizes can vary widely due to open staging and there is no sample preparation needed. Nano through macro range features are obtained during a surface profile measurement with zero influence from sample reflectivity or absorption. The instrument provides an advanced ability to measure high surface angles with no software manipulation of the results. Any material can be easily measured, whether it’s transparent, opaque, specular, diffusive, polished or rough. The technique provides an ideal, broad and user friendly capability to maximize surface studies along with the benefits of combined 2D & 3D capabilities.

MEASUREMENT OBJECTIVE

In this application, we showcase NANOVEA ST400, a 3D Non-Contact Profiler with a high-speed sensor, providing comprehensive analysis of the surface of a scale.

The instrument has been used to scan the entire sample, along with a higher resolution scan of the center area. The outer and inner side surface roughness of the scale was measured for comparison as well.

NANOVEA

ST400

3D & 2D Surface Characterization of Outer Scale

The 3D View and False Color View of the outer scale show a complex structure similar to a finger print or the rings of a tree. This provides users a straightforward tool to directly observe the surface characterization of the scale from different angles. Various other measurements of the outer scale are shown along with the comparison of the outer and inner side of the scale.

Fish Scale Scan 3D View Profilometer
Fish Scale Scan Volume 3D Profilometer
Fish Scale Scan Step Height 3D Optical Profiler

SURFACE ROUGHNESS COMPARISON

Fish Scale Profilometer 3D Scanning

CONCLUSION

In this application, we have shown how the NANOVEA 3D Non-Contact Optical Profiler can characterize a fish scale in a variety of ways. 

The outer and inner surfaces of the scale can be easily distinguished by surface roughness alone, with roughness values of 15.92μm and 1.56μm respectively. Additionally, precise and accurate information can be learned about a fish scale by analyzing the grooves, or circuli, on the outer surface of the scale. The distance of bands of circuli from the center focus were measured, and the height of the circuli were also found to be approximately 58μm high on average. 

The data shown here represents only a portion of the calculations available in the analysis software.