Category: Profilometry | Roughness and Finish
In-line Roughness Inspection
Surface defects derive from materials processing and product manufacturing. In-line surface quality inspection ensures the tightest quality control of the end products. The Nanovea 3D Non-Contact Profilometers utilize chromatic confocal technology with a unique capability to determine the roughness of a sample with-out contact. Multiple profiler sensors can be installed to monitor the roughness and texture of different areas of the product at the same time. The roughness threshold calculated in real-time by the analysis software serves as a fast and reliable pass/fail tool.
MEASUREMENT OBJECTIVE
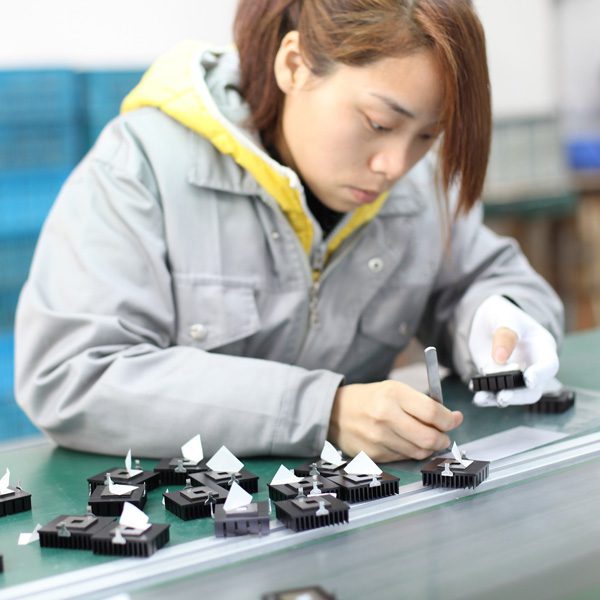
In this study, the Nanovea roughness inspection conveyor system equipped with a point sensor is used to inspect the surface roughness of the acrylic and sandpaper samples. We showcase the capacity of Nanovea non-contact profilometer in providing fast and reliable in-line roughness inspection in a production line in real-time.

RESULTS AND DISCUSSION
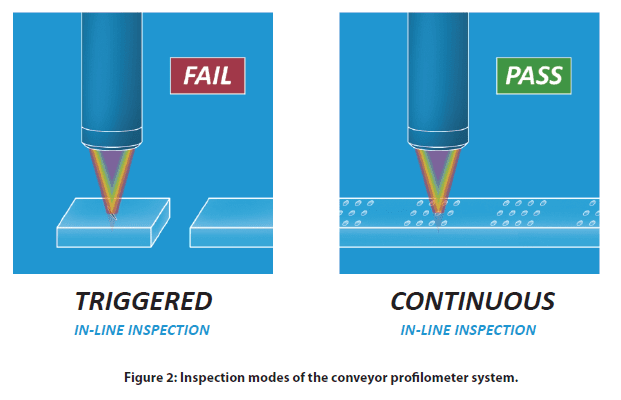
The conveyor profilometer system can operate in two modes, namely Trigger Mode and Continuous Mode. As illustrated in Figure 2, the surface roughness of the samples are measured when they are passing under the optical profiler heads under the Trigger Mode. In comparison, Continuous Mode provides non-stop measurement of the surface roughness on the continuous sample, such as metal sheet and fabric. Multiple optical profiler sensors can be installed to monitor and record the roughness of different sample areas.
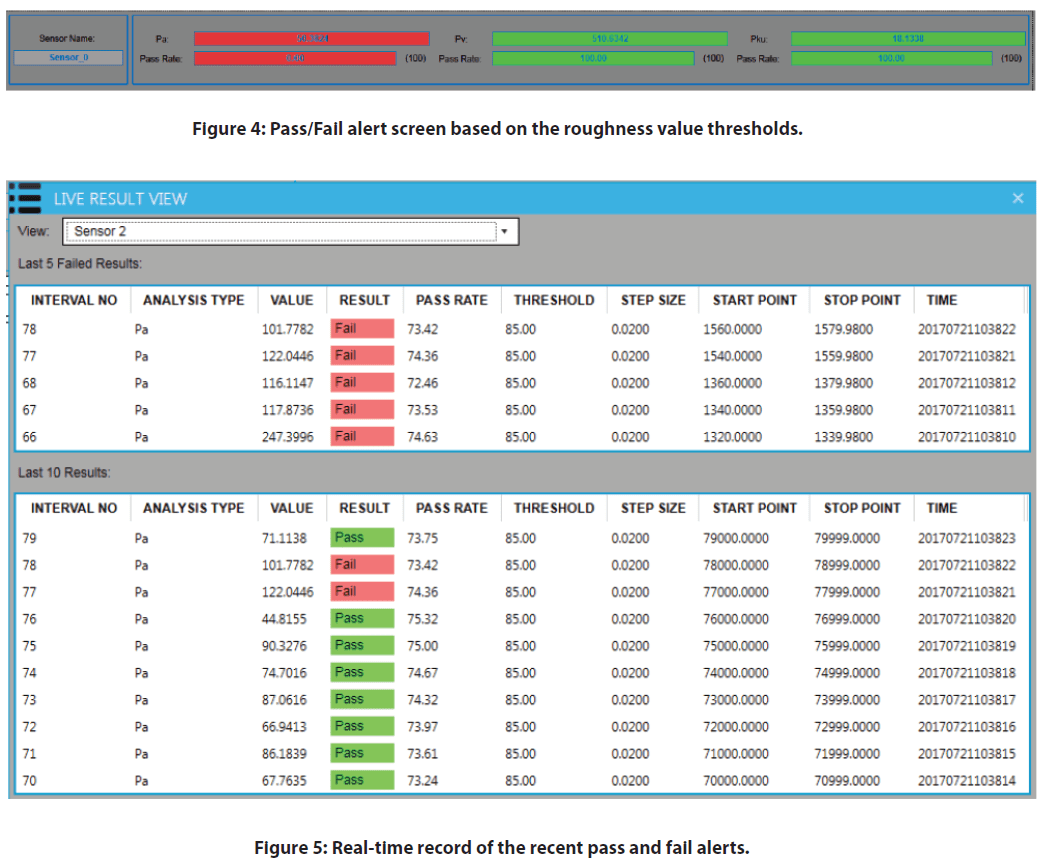
During the real-time roughness inspection measurement, the pass and fail alerts are displayed on the software windows as shown in Figure 4 and Figure 5. When the roughness value is within the given thresholds, the measured roughness is highlighted in green color. However, the highlight turns red when the measured surface roughness is out of the range of the set threshold values. This provides a tool for the user to determine the quality of a product’s surface finish.
In the following sections, two types of samples, e.g. Acrylic and Sandpaper are used to demonstrate the Trigger and Continuous Modes of the Inspection system.


Trigger Mode: Surface inspection of the Acrylic Sample
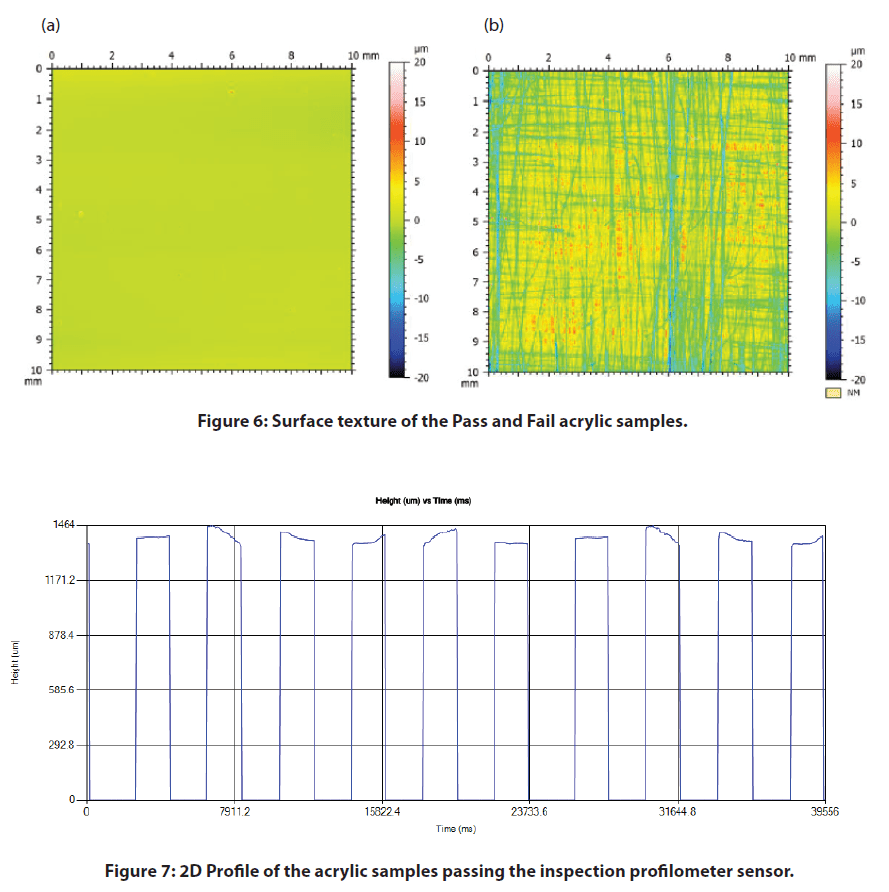
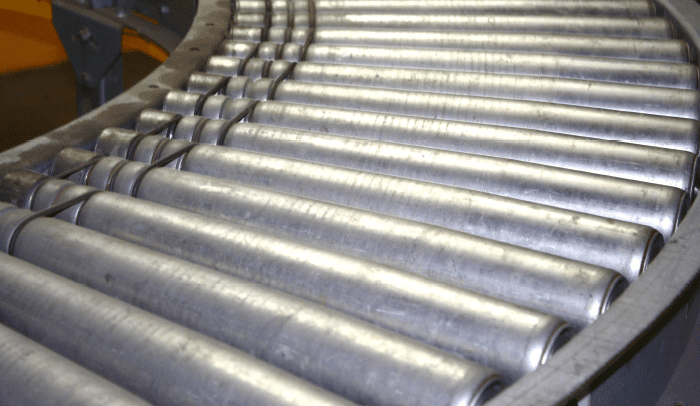
A series of Acrylic samples are aligned on the conveyor belt and move under the optical profiler head as shown in Figure 1. The false color view in Figure 6 shows the change of the surface height. Some of the mirror-like finished Acrylic samples had been sanded to create a rough surface texture as shown in Figure 6b.
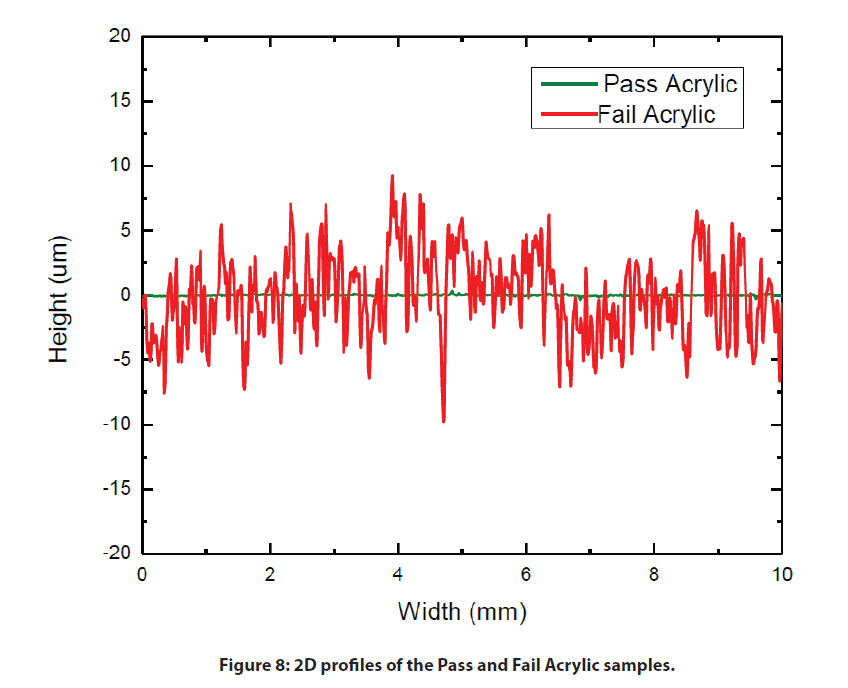
As the Acrylic samples move at a constant speed under the optical profiler head, the surface profile is measured as shown in Figure 7 and Figure 8. The roughness value of the measured profile is calculated at the same time and compared to the threshold values. The red fail alert is launched when the roughness value is over the set threshold, allowing users to immediately detect and locate the defective product on the production line.
Continuous Mode: Surface Inspection of the sandpaper sample
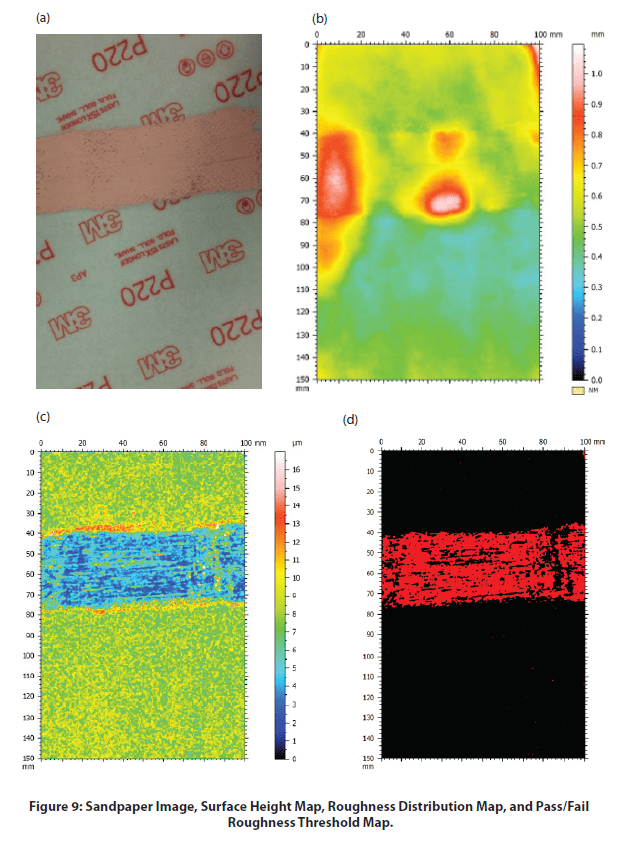
Surface Height Map, Roughness Distribution Map, and Pass / Fail Roughness Threshold Map of the sandpaper sample surface as shown in Figure 9. The sandpaper sample has a couple of higher peaks in the used part as shown in the surface height map. The different colors in the pallet of Figure 9C represent the roughness value of the local surface. The Roughness Map exhibits a homogeneous roughness in the intact area of the sandpaper sample, while the used area is highlighted in dark blue color, indicating the reduced roughness value in this region. A Pass/Fail roughness threshold can be set up to locate such regions as shown in Figure 9D.
As the sandpaper continuously passes under the in-line profiler sensor, the real-time local roughness value is calculated and recorded as plotted in Figure 10. The pass/fail alerts are displayed on the software screen based on the set roughness threshold values, serving as a fast and reliable tool for quality control. The product surface quality in the production line is inspected in situ to discover defective areas in time.

CONCLUSION
In this application, we have shown the Nanovea Conveyor Profilometer equipped with an optical non-contact profiler sensor works as a reliable in-line quality control tool effectively and efficiently.
The inspection system can be installed in the production line to monitor the surface quality of the products in situ. The roughness threshold works as a dependable criteria to determine the surface quality of the products, allowing users to notice the defective products in time. Two inspection modes, namely Trigger Mode and Continuous Mode, are provided to meet the requirement for inspection on different types of products.
The data shown here represent only a portion of the calculations available in the analysis software. Nanovea Profilometers measure virtually any surface in fields including Semiconductor, Microelectronics, Solar, Fiber, Optics, Automotive, Aerospace, Metallurgy, Machining, Coatings, Pharmaceutical, Biomedical, Environmental and many others.

Block-On-Ring Wear Test
IMPORTANCE OF BLOCK-ON-RING WEAR EVALUATION
Sliding wear is the progressive loss of material that results from two materials sliding against each other at the contact area under load. It occurs inevitably in a wide variety of industries where machines and engines are in operation, including automotive, aerospace, oil & gas and many others. Such sliding motion causes serious mechanical wear and material transfer at the surface, which may lead to reduced production efficiency, machine performance or even damage to the machine.
Sliding wear often involves complex wear mechanisms taking place at the contact surface, such as adhesion wear, two-body abrasion, three-body abrasion and fatigue wear. The wear behavior of materials is significantly influenced by the work environment, such as normal loading, speed, corrosion and lubrication. A versatile tribometer that can simulate the different realistic work conditions will be ideal for wear evaluation.
Block-on-Ring (ASTM G77) test is a widely used technique that evaluates the sliding wear behaviors of materials in different simulated conditions, allows reliable ranking of material couples for specific tribological applications.
Block-on-Ring (ASTM G77) test is a widely used technique that evaluates the sliding wear behaviors of materials in different simulated conditions, allows reliable ranking of material couples for specific tribological applications.
MEASUREMENT OBJECTIVE
In this application, the Nanovea Mechanical Tester measures the YS and UTS of stainless steel SS304 and aluminum Al6061 metal alloy samples. The samples were chosen for their commonly recognized YS and UTS values showing the reliability of Nanovea’s indentation methods.
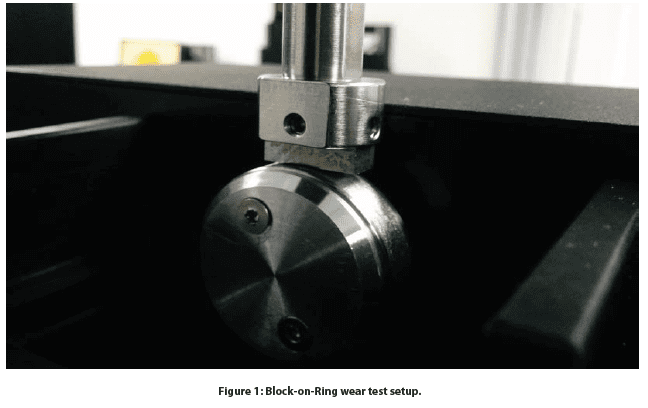
The sliding wear behavior of an H-30 block on an S-10 ring was evaluated by Nanovea’s tribometer using the Block-on-Ring module. The H-30 block is made of 01 tool steel of 30HRC hardness, while the S-10 ring is steel type 4620 of surface hardness 58 to 63 HRC and ring diameter of ~34.98 mm. Block-on-Ring tests were performed in dry and lubricated environments to investigate the effect on wear behavior. Lubrication tests were performed in USP heavy mineral oil. The wear track was examined using Nanovea’s 3D non-contact profilometer. Test parameters are summarized in Table 1. The wear rate (K), was evaluated using the formula K=V/(F×s), where V is the worn volume, F is the normal load, s is the sliding distance.
RESULTS AND DISCUSSION
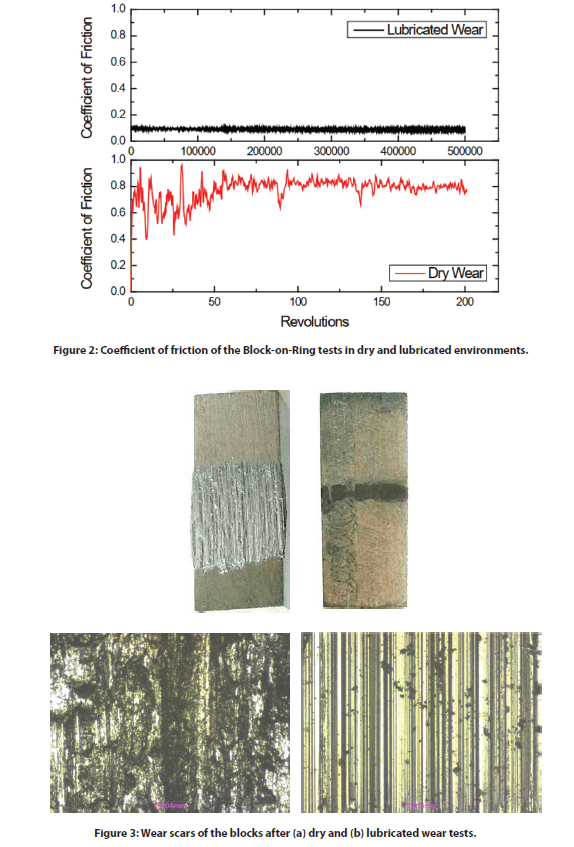
Figure 2 compares the coefficient of friction (COF) of the Block-on-Ring tests in dry and lubricated environments. The block has significantly more friction in a dry environment than a lubricated environment. COF
fluctuates during the run-in period in the first 50-revolution and reaches a constant COF of ~0.8 for the rest of the 200-revolution wear test. In comparison, the Block-on-Ring test performed in the USP heavy mineral oil lubrication exhibits constant low COF of 0.09 throughout the 500,000-revolution wear test. The lubricant significantly reduces the COF between the surfaces by ~90 times.
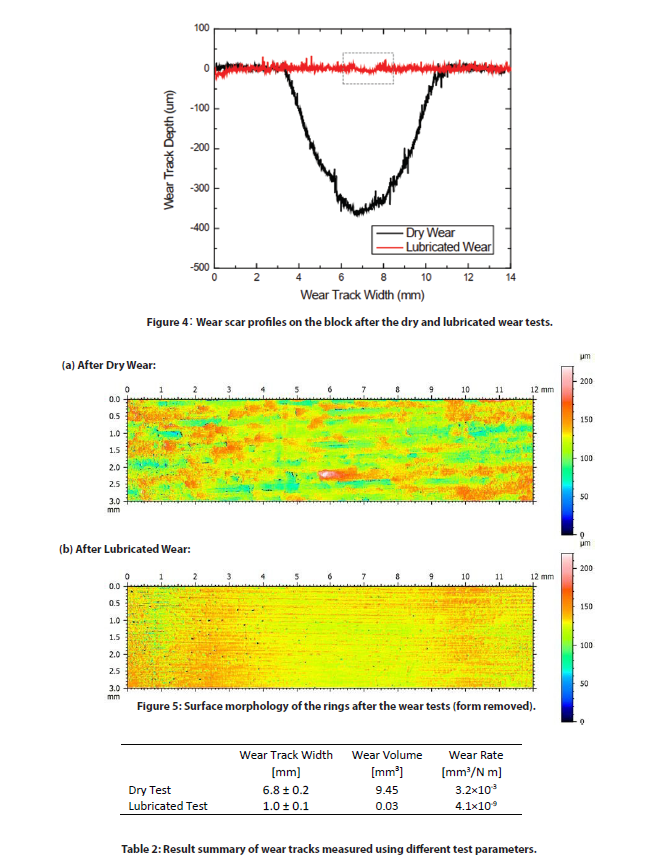
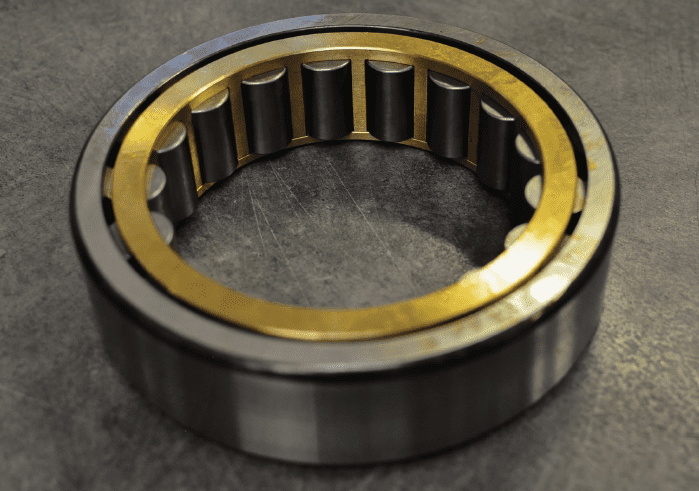
Figures 3 and 4 show the optical images and cross-section 2D profiles of the wear scars on the blocks after dry and lubricated wear tests. The wear track volumes and wear rates are listed in Table 2. The steel block after the dry wear test at a lower rotational speed of 72 rpm for 200 revolutions exhibits a large wear scar volume of 9.45 mm˙. In comparison, the wear test carried out at a higher speed of 197 rpm for 500,000 revolutions in the mineral oil lubricant creates a substantially smaller wear track volume of 0.03 mm˙.
The images in ÿgure 3 show severe wear takes place during tests in the dry conditions compared to the mild wear from the lubricated wear test. High heat and intense vibrations generated during the dry wear test promotes oxidation of metallic debris resulting in severe three-body abrasion. In the lubricated test the mineral oil reduces friction and cools the contact face as well as transporting abrasive debris created during wear away. This leads to signiÿcant reduction of wear rate by a factor of ~8×10ˆ. Such a substantial di˛erence in wear resistance in di˛erent environments shows the importance of proper sliding wear simulation in realistic service conditions.
Wear behavior can change drastically when small changes in test conditions are introduced. The versatility of Nanovea’s tribometer allows wear measurement in high temperature, lubrication, and tribocorrosion conditions. The accurate speed and position control by the advanced motor enables wear tests to be performed at speeds ranging from 0.001 to 5000 rpm, making it an ideal tool for research/testing labs to investigate the wear in di˛erent tribological conditions.
The surface condition of the samples was examined by Nanovea’s non-contact optical proÿlometer. Figure 5 shows the surface morphology of the rings after the wear tests. The cylinder form is removed to better present the surface morphology and roughness created by the sliding wear process. Signiÿcant surface roughening took place due to the three-body abrasion process during the dry wear test of 200 revolutions. The block and ring after the dry wear test exhibit a roughness Ra of 14.1 and 18.1 µm, respectively, compared to 5.7 and 9.1 µm for the long-term 500,000 – revolution lubricated wear test at a higher speed. This test demonstrates the importance of proper lubrication of piston ring-cylinder contact. Severe wear quickly damages the contact surface without lubrication and leads to irreversible deterioration of the service quality and even breakage of the engine.
CONCLUSION
In this study we showcase how Nanovea’s Tribometer is used to evaluate the sliding wear behavior of a steel metal couple using the Block-on-Ring module following the ASTM G77 Standard. The lubricant plays a critical role in the wear properties of the material couple. The mineral oil reduces the wear rate of the H-30 block by a factor of ~8×10ˆ and the COF by ~90 times. The versatility of Nanovea’s Tribometer makes it an ideal tool for measuring wear behavior under various lubrication, high temperature, and tribocorrosion conditions.
Nanovea’s Tribometer o˛ers precise and repeatable wear and friction testing using ISO and ASTM compliant rotative and linear modes, with optional high-temperature wear, lubrication, and tribo-corrosion modules available in one pre-integrated system. Nanovea’s unmatched range is an ideal solution for determining the full range of tribological properties of thin or thick, soft, or hard coatings, ÿlms, and substrates.

Paint Orange Peel Texture Analysis using 3D Profilometry
Introduction
The size and frequency of surface structures on substrates affect the quality of gloss coatings. Paint orange peel texture, named after its appearance, can develop from substrate influence and paint application technique. Texture problems are commonly quantified by waviness, wavelength, and the visual effect they have on gloss coatings. The smallest textures result in gloss reduction while larger textures result in visible ripples on the coated surface. Understanding the development of these textures and its relation to substrates and techniques are critical to quality control.
Importance of Profilometry for Texture Measurement
Unlike traditional 2D instruments used to measure gloss texture, 3D non-contact measurement quickly provides a 3D image used to understand surface characteristics with the added ability to quickly investigate areas of interest. Without speed and 3D review, a quality control environment would solely rely on 2D information that gives little predictability of the entire surface. Understanding textures in 3D allows for the best selection of processing and control measures. Assuring quality control of such parameters heavily relies on quantifiable, reproducible, and reliable inspection. Nanovea 3D Non-Contact Profilometers utilize chromatic confocal technology to have the unique capability to measure the steep angles found during fast measurement. Nanovea Profilometers succeed where other techniques fail to provide reliable data due to probe contact, surface variation, angle, or reflectivity.
Measurement Objective
In this application, the Nanovea HS2000L measures the paint orange peel texture of a gloss paint. There are endless surface parameters automatically calculated from the 3D surface scan. Here we analyze a scanned 3D surface by quantifying the characteristics of the paint orange peel texture.
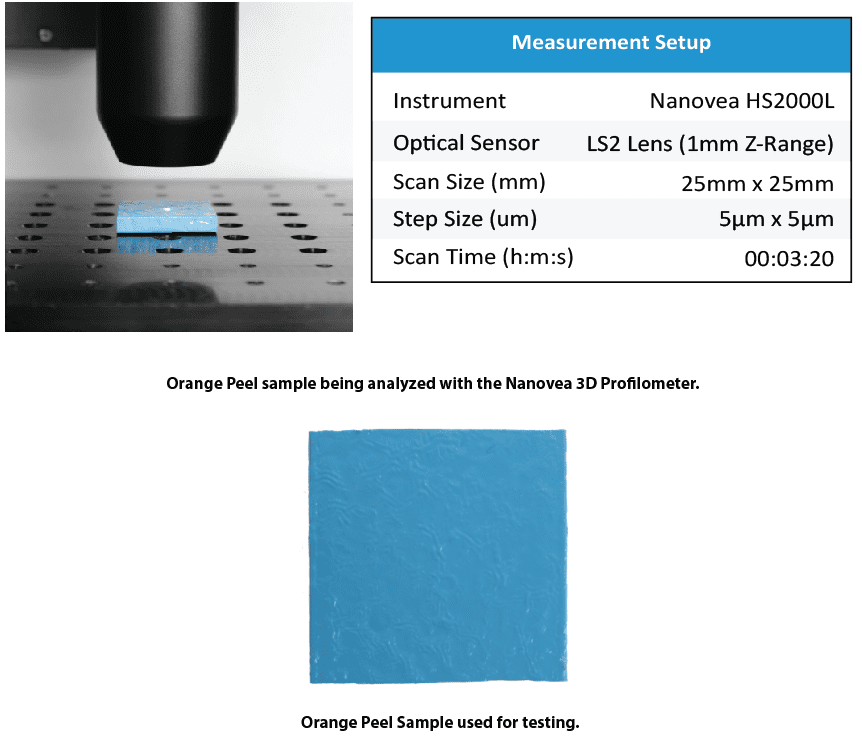
Results and Discussion

The Nanovea HS2000L quantified isotropy and height parameters of the orange peel paint. The orange peel texture quantified the random pattern direction with 94.4% isotropy. Height parameters quantify the texture with a 24.84µm height difference.

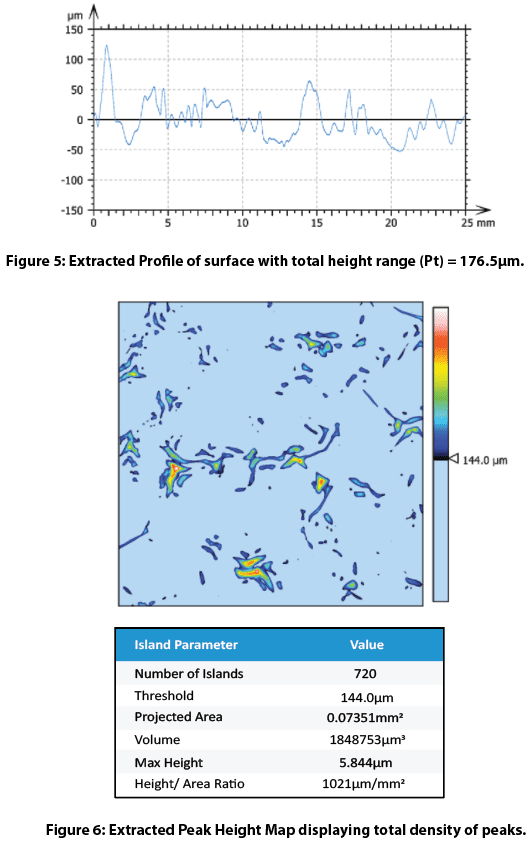
The bearing ratio curve in Figure 4 is a graphical representation of the depth distribution. This is an interactive feature within the software that allows the user to view distributions and percentages at varying depths. An extracted profile in Figure 5 gives useful roughness values for the orange peel texture. Peak extraction above a 144 micron threshold shows the orange peel texture. These parameters are easily adjusted to other areas or parameters of interest.
Conclusion
In this application, the Nanovea HS2000L 3D Non-Contact Profilometer precisely characterizes both topography and nanometer details of the paint orange peel texture on a gloss coating. Areas of interest from 3D surface measurements are quickly identified and analyzed with many useful measurements (Dimension, Roughness Finish Texture, Shape Form Topography, Flatness Warpage Planarity, Volume Area, Step-Height, etc.). Quickly chosen 2D cross-sections provide a complete set of surface measurement resources on gloss texture. Special areas of interest can be further analyzed with an integrated AFM module. Nanovea 3D Profilometer’s speed ranges from <1 mm/s to 500 mm/s for suitability in research applications to the needs of high-speed inspection. Nanovea 3D Profilometers have a wide range of configurations to suit your application.

3D Surface Analysis of a Penny with Non-contact Profilometry
Importance of Non-contact Profilometry for Coins
Currency is highly valued in modern society because it is traded for goods and services. Coin and paper bill currency circulates around the hands of many people. Constant transfer of physical currency creates surface deformation. Nanovea’s 3D Profilometer scans the topography of coins minted in different years to investigate surface differences.
Coin features are easily recognizable to the general public since they are common objects. A penny is ideal for introducing the strength of Nanovea’s Advanced Surface Analysis Software: Mountains 3D. Surface data collected with our 3D Profilometer allows for high level analyses on complex geometry with surface subtraction and 2D contour extraction. Surface subtraction with a controlled mask, stamp, or mold compares the quality of manufacturing processes while contour extraction identifies tolerances with dimensional analysis. Nanovea’s 3D Profilometer and Mountains 3D software investigates the submicron topography of seemingly simple objects, like pennies.
Measurement Objective
The full upper surface of five pennies were scanned using Nanovea’s High-Speed Line Sensor. The inner and outer radius of each penny was measured using Mountains Advanced Analysis Software. An extraction from each penny surface at an area of interest with direct surface subtraction quantified surface deformation.

Results and Discussion
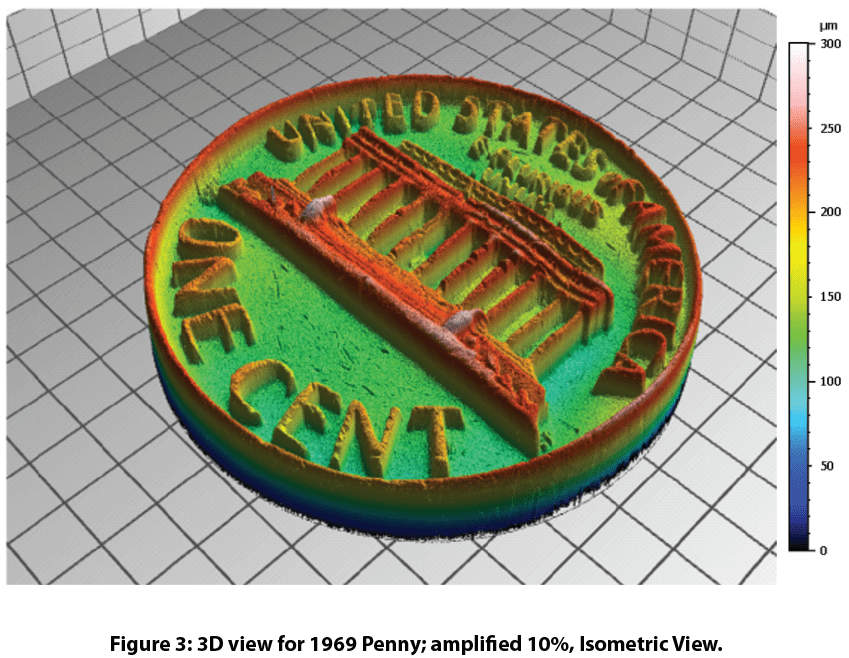
3D Surface
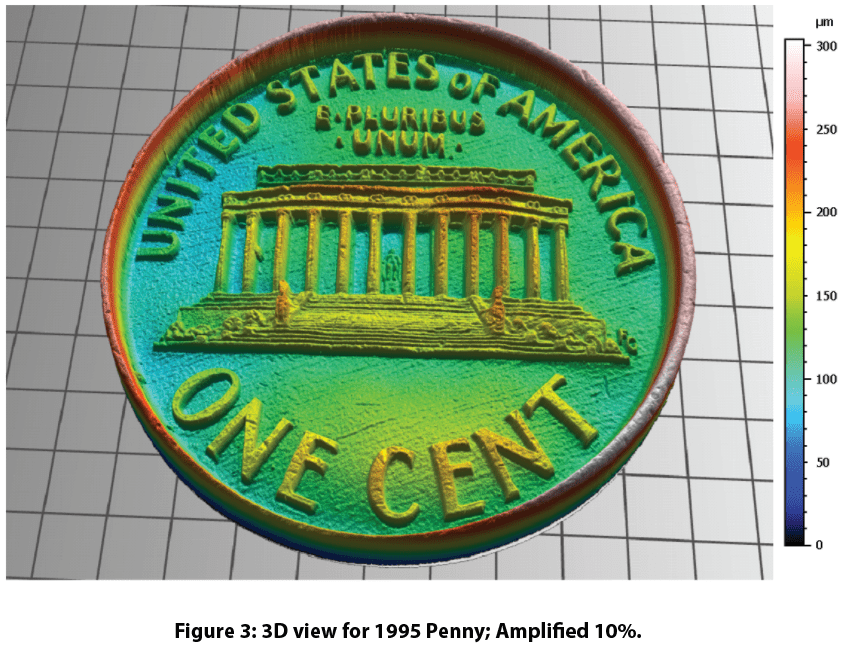
The Nanovea HS2000 profilometer took only 24 seconds to scan 4 million points in a 20mm x 20mm area with a 10um x 10um step size to acquire the surface of a penny. Below is a height map and 3D visualization of the scan. The 3D view shows the High-Speed sensor’s ability to pick up small details unperceivable to the eye. Many small scratches are visible across the surface of the penny. Texture and roughness of the coin seen in the 3D view are investigated.

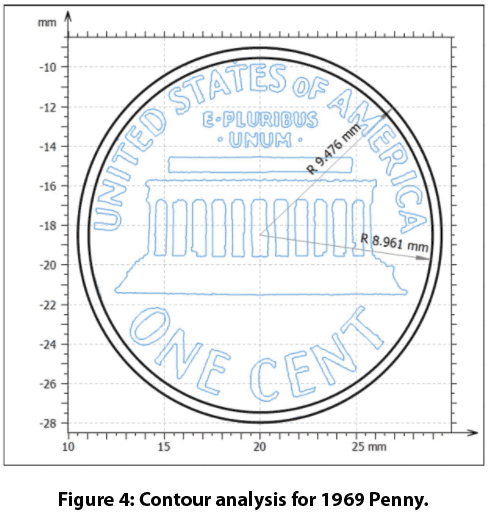
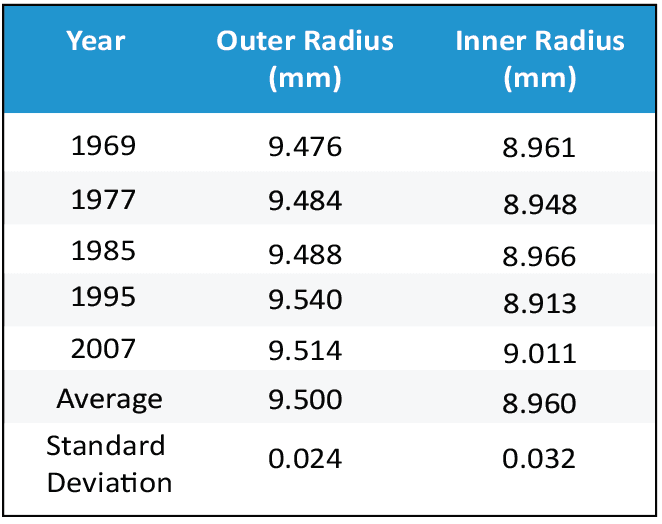
Dimensional Analysis
The contours of the penny were extracted and dimensional analysis obtained inner and outer diameters of the edge feature. The outer radius averaged 9.500 mm ± 0.024 while the inner radius averaged 8.960 mm ± 0.032. Additional dimensional analyses Mountains 3D can do on 2D and 3D data sources are distance measurements, step height, planarity, and angle calculations.
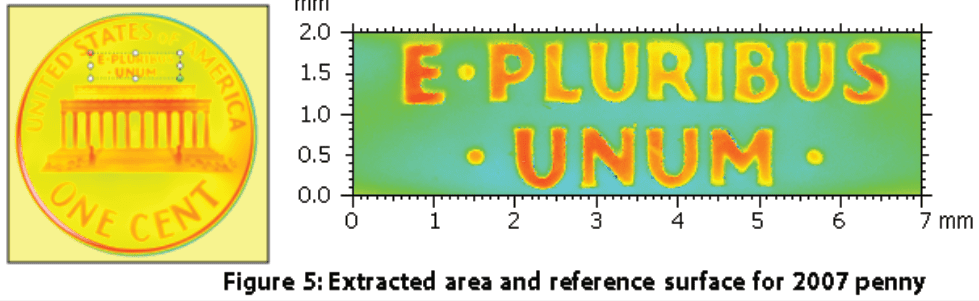
Surface Subtraction
Figure 5 shows the area of interest for the surface subtraction analysis. The 2007 penny was used as the reference surface for the four older pennies. Surface subtraction from the 2007 penny surface shows differences between pennies with holes/peaks. Total surface volume difference is obtained from adding volumes of the holes/peaks. The RMS error refers to how closely penny surfaces agree with each other.

Conclusion

Nanovea’s High-Speed HS2000L scanned five pennies minted in different years. Mountains 3D software compared surfaces of each coin using contour extraction, dimensional analysis, and surface subtraction. The analysis clearly defines the inner and outer radius between the pennies while directly comparing surface feature differences. With Nanovea’s 3D profilometer’s ability to measure any surfaces with nanometer-level resolution, combined with Mountains 3D analysis capabilities, the possible Research and Quality Control applications are endless.
Dimensional and Surface Finish of Polymeric Tubes
Importance of Dimensional and Surface Analysis of Polymeric Tubes
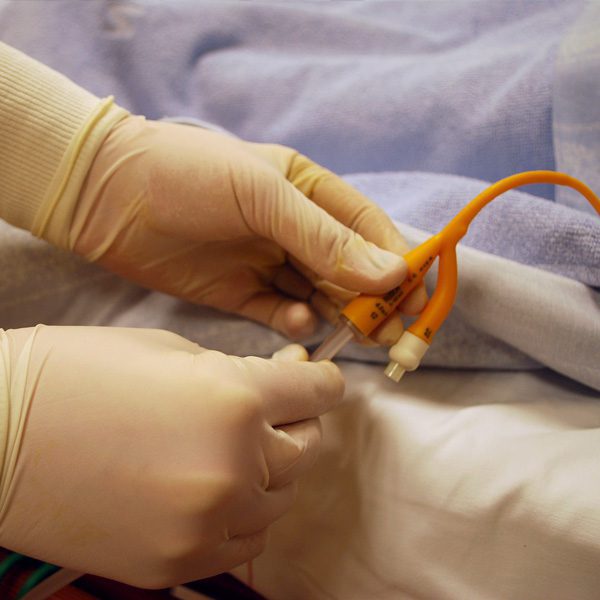
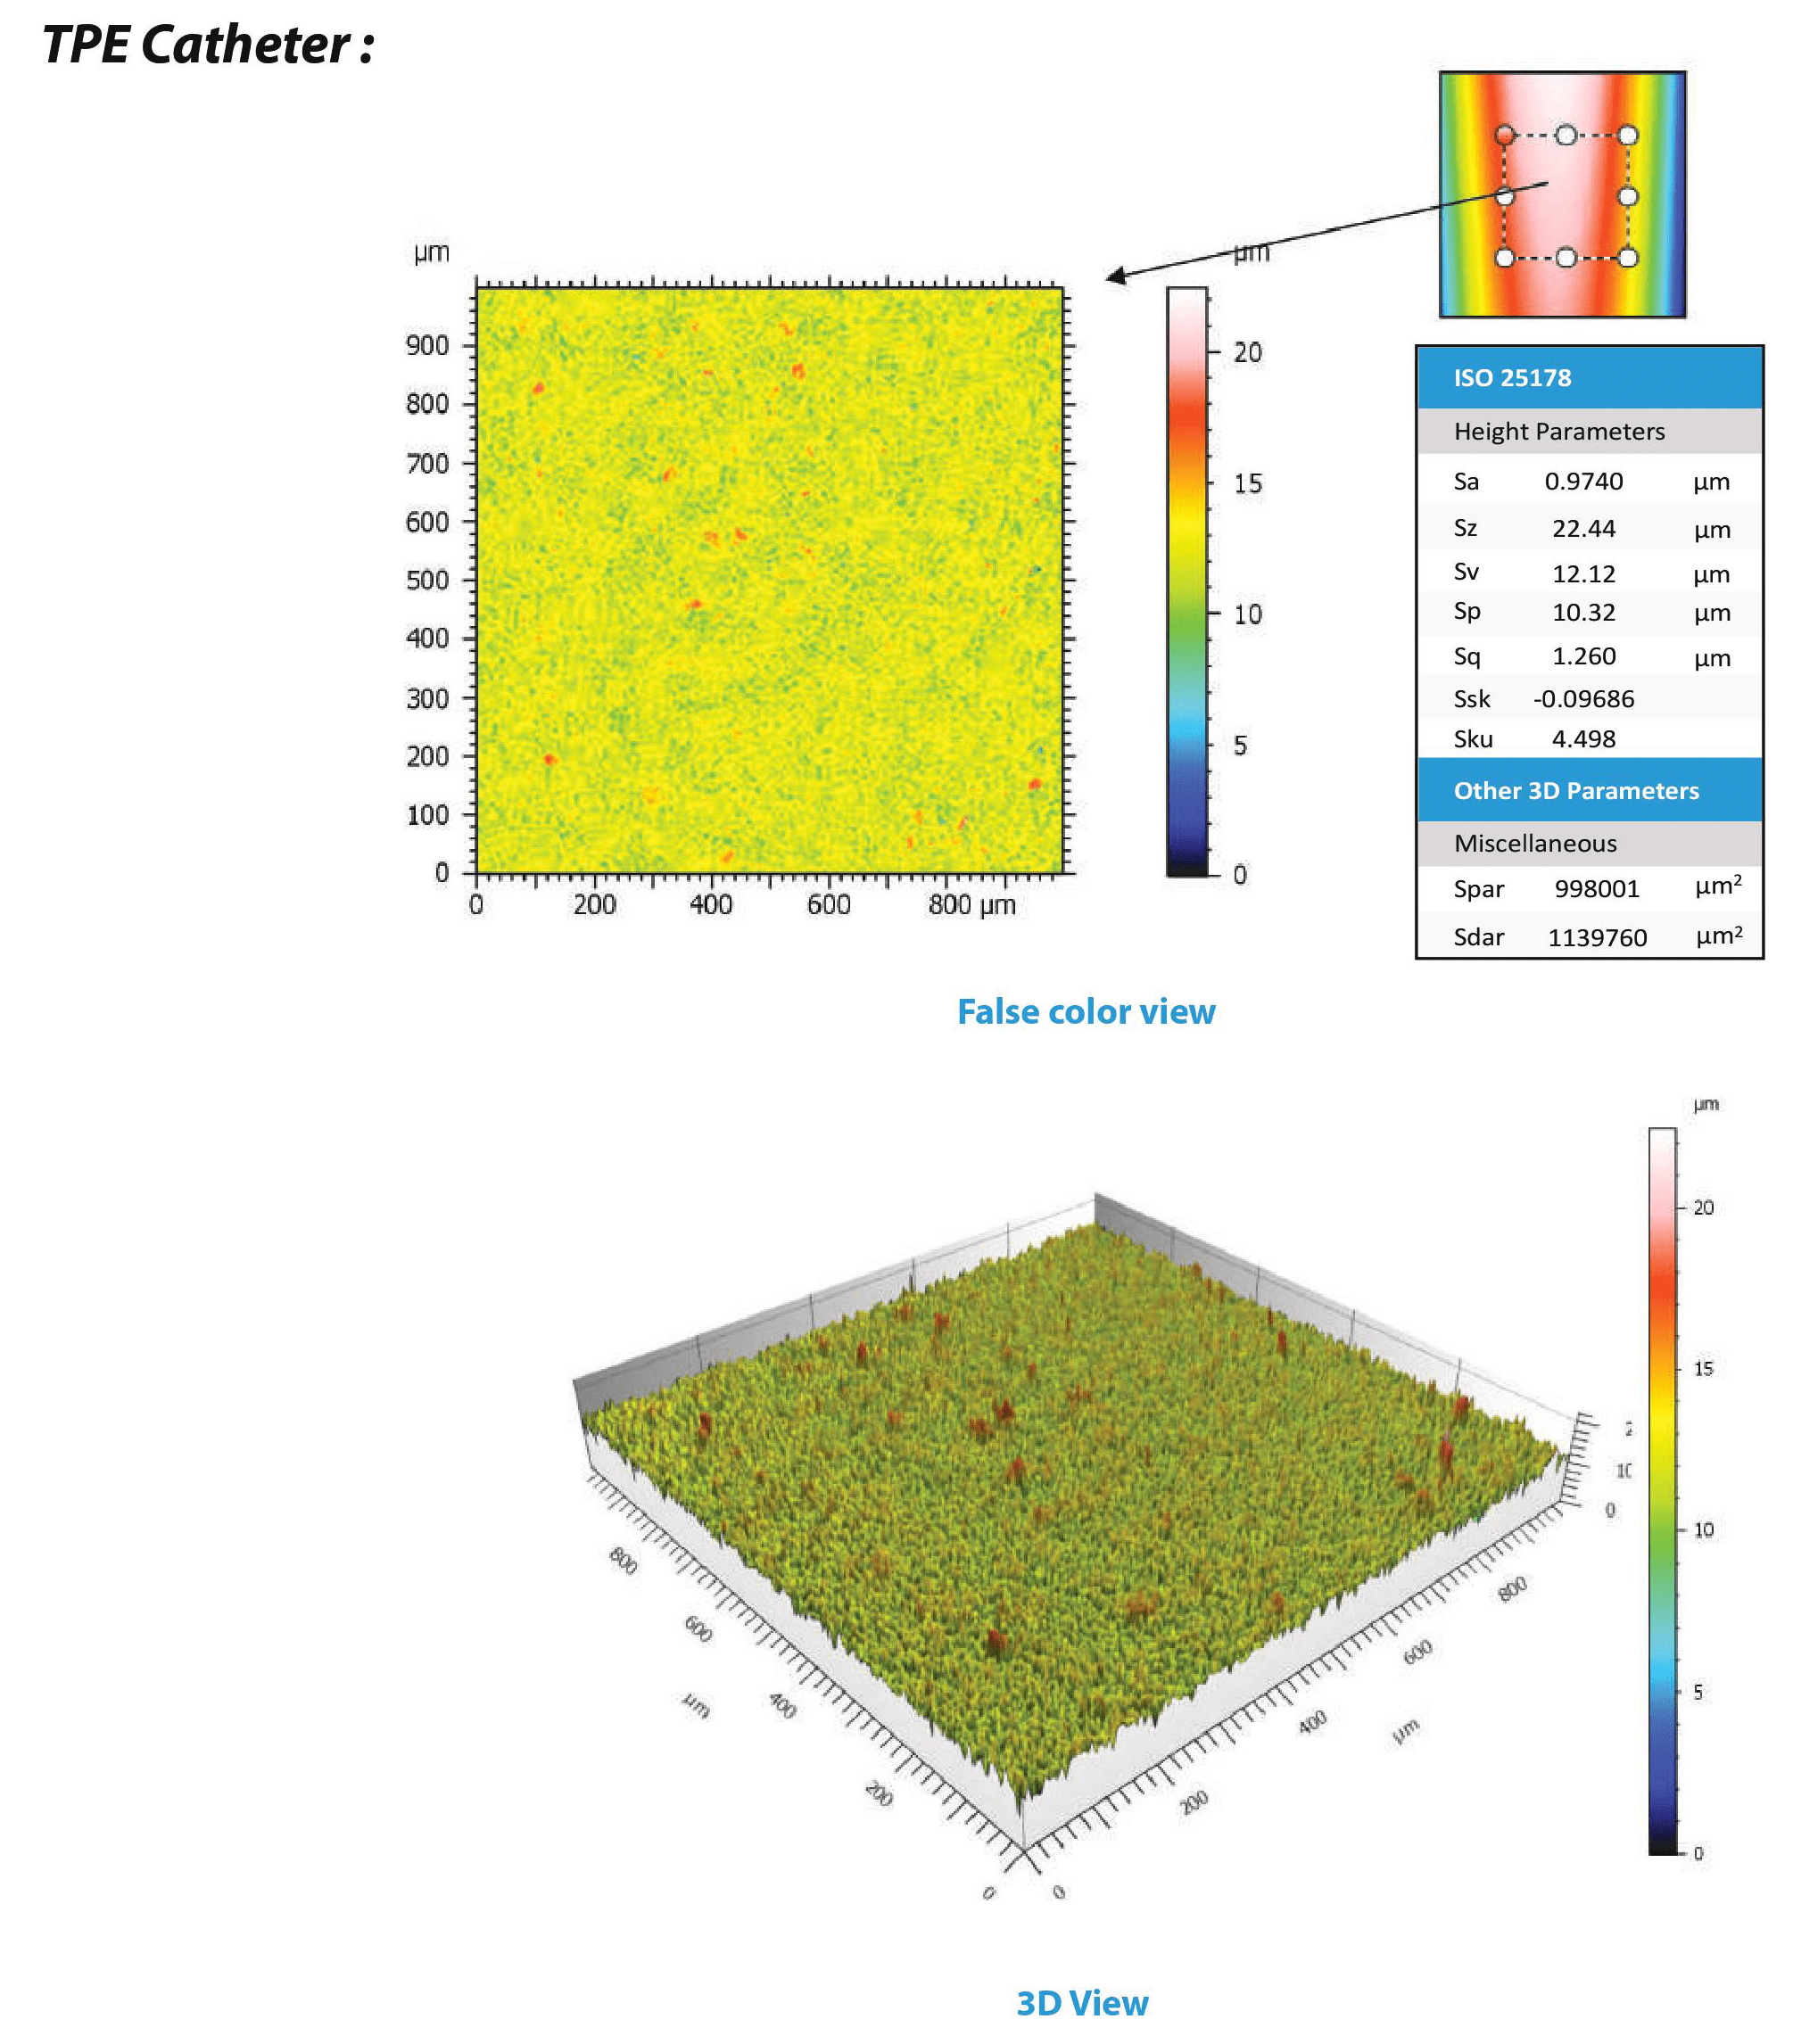
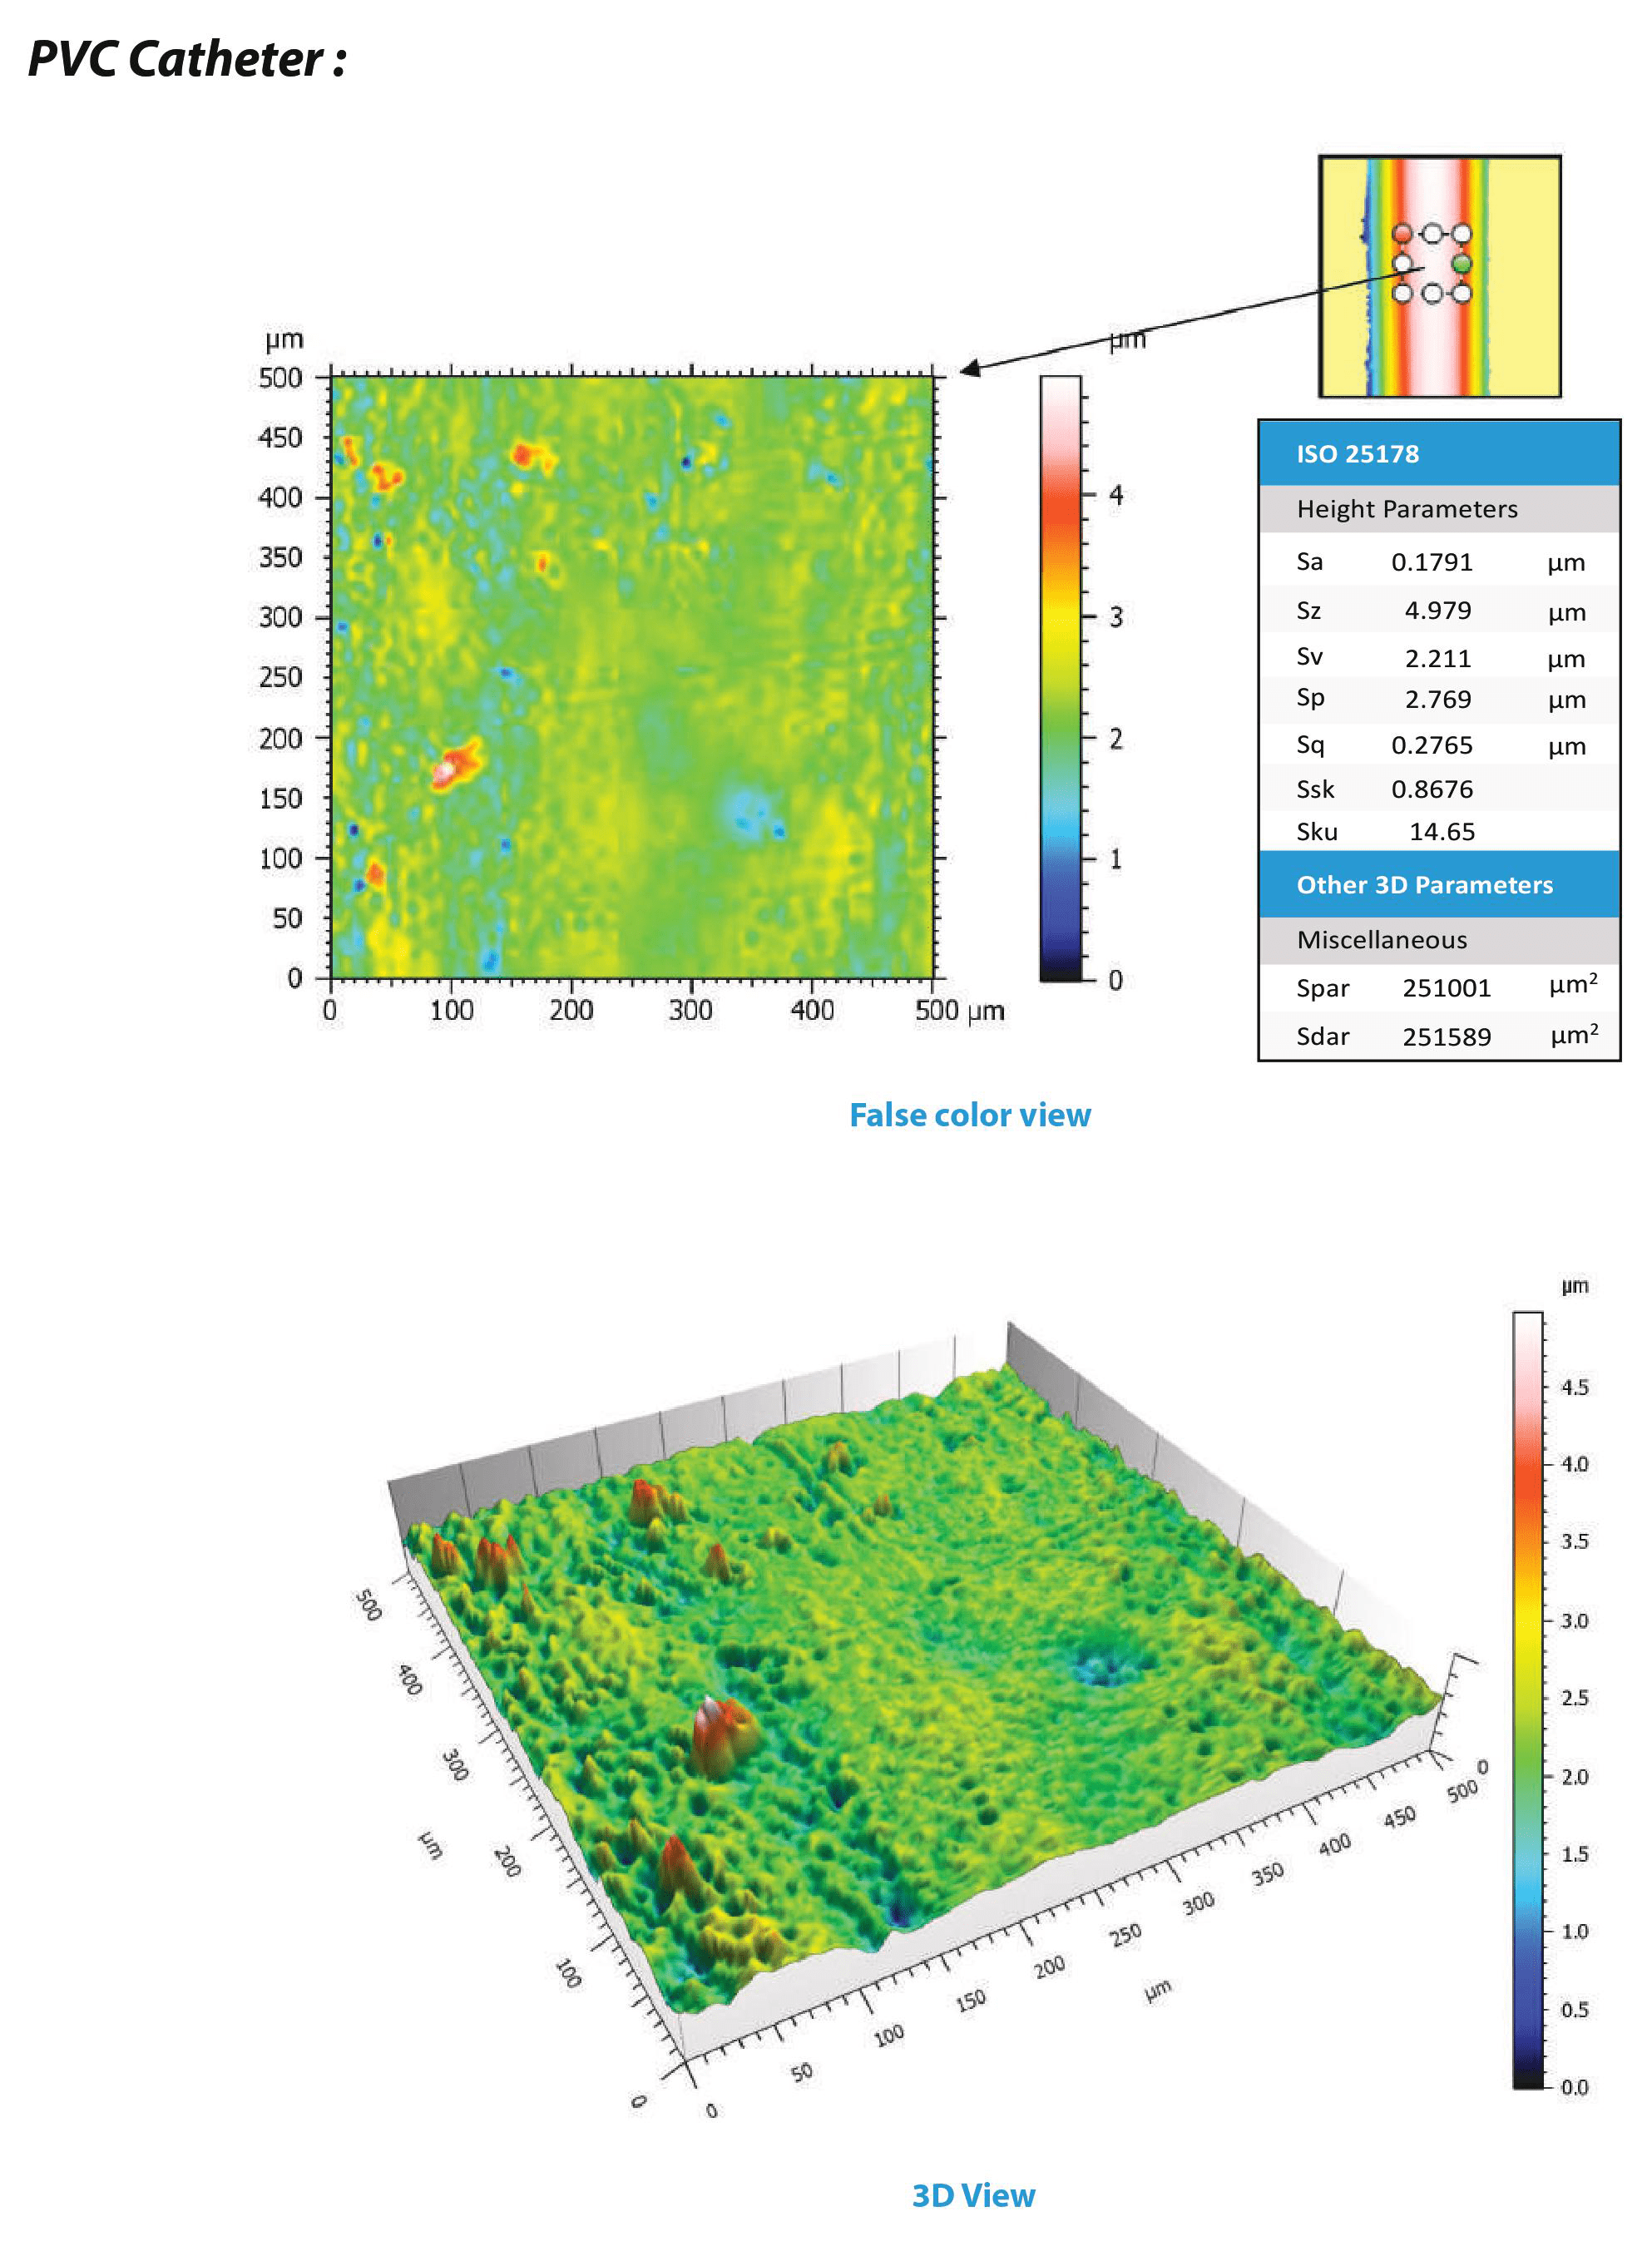
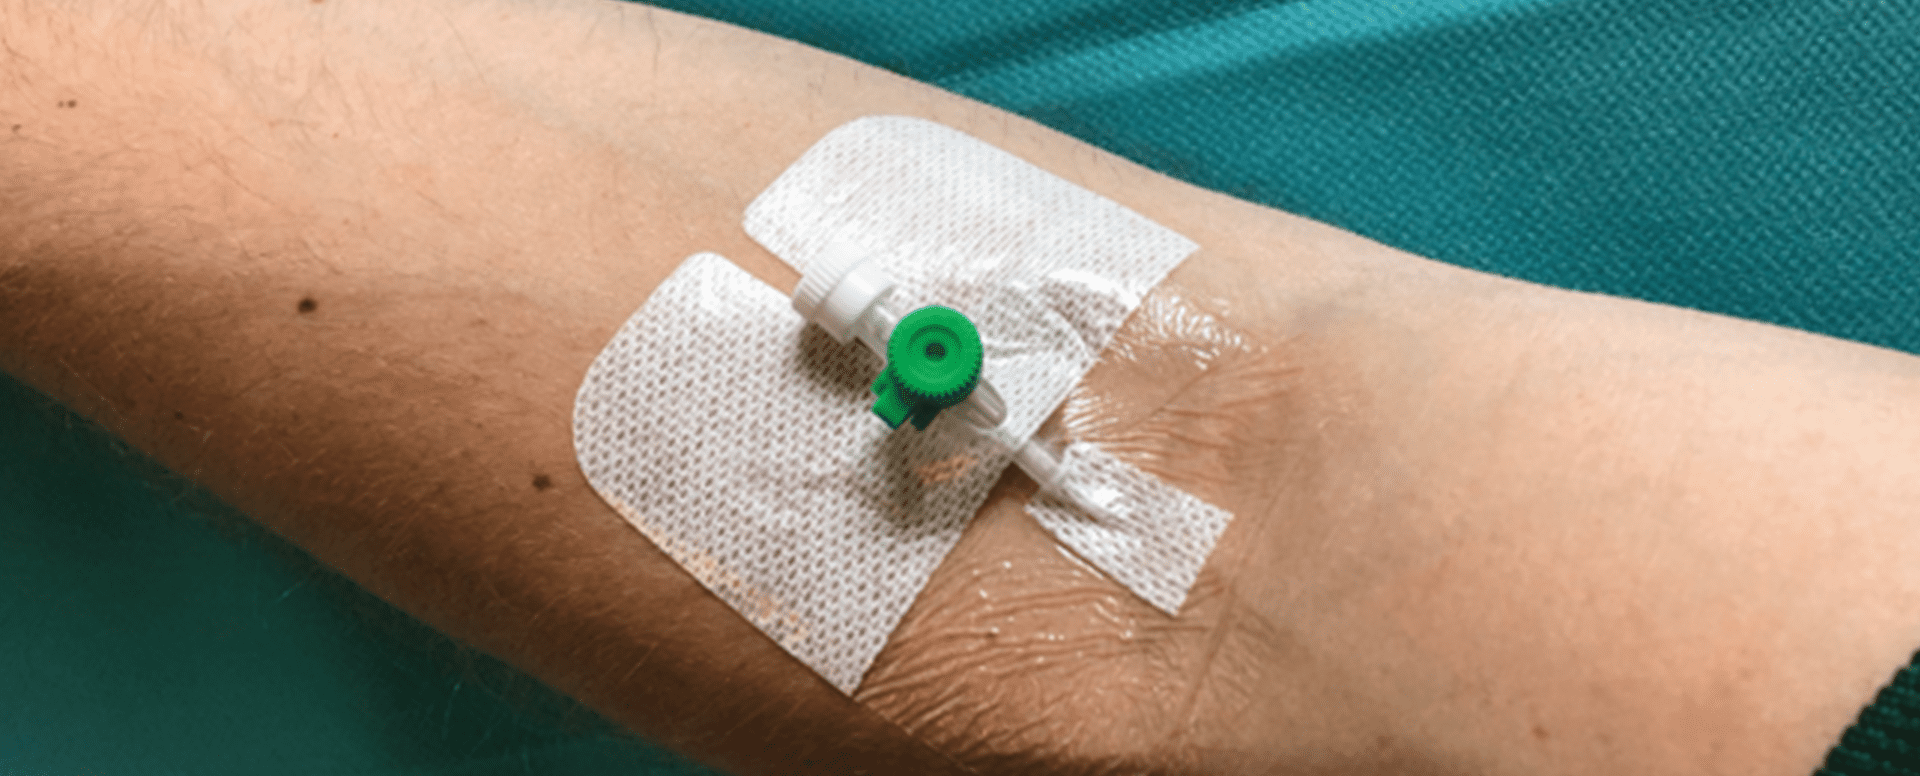
Tubes made from polymeric material are commonly used in many industries ranging from automotive, medical, electrical, and many other categories. In this study, medical catheters made of different polymeric materials were studied using the Nanovea 3D Non-Contact Profilometer to measure surface roughness, morphology, and dimensions. Surface roughness is crucial for catheters as many problems with catheters, including infection, physical trauma, and inflammation can be linked with the catheter surface. Mechanical properties, such as coefficient of friction, can also be studied by observing surface properties. These quantifiable data can be obtained to ensure the catheter can be used for medical applications.
Compared to optical microscopy and electron microscopy, 3D Non-Contact Profilometry using axial chromatism is highly preferable for characterizing catheter surfaces due to its ability to measure angles/curvature, ability to measure material surfaces despite transparency or reflectivity, minimal sample preparation, and non-invasive nature. Unlike conventional optical microscopy, the height of the surface can be obtained and used for computational analysis; e.g. finding dimensions and removing form to find surface roughness. Having little sample preparation, in contrast to electron microscopy, and non-contact nature also allows for quick data collection without fearing contamination and error from sample preparation.
Measurement Objective
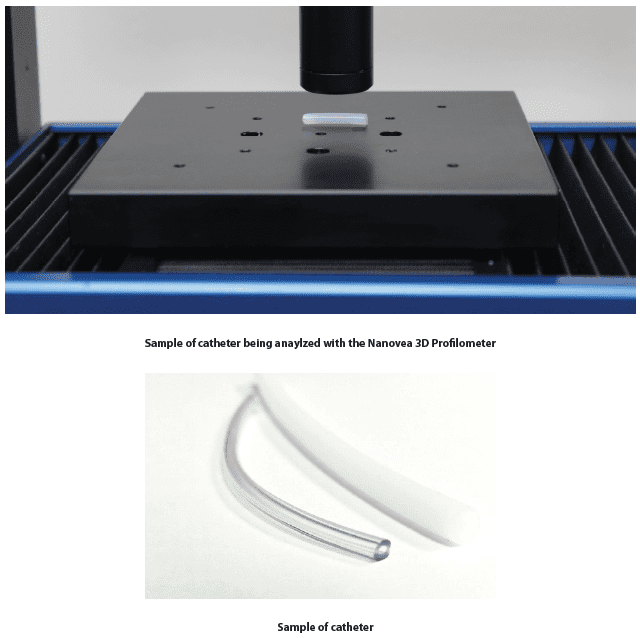
In this application, the Nanovea 3D Non-Contact Profilometer is used to scan the surface of two catheters: one made of TPE (Thermoplastic Elastomer) and the other made of PVC (Polyvinyl Chloride). The morphology, radial dimension, and height parameters of the two catheters will be obtained and compared.
Results and Discussion
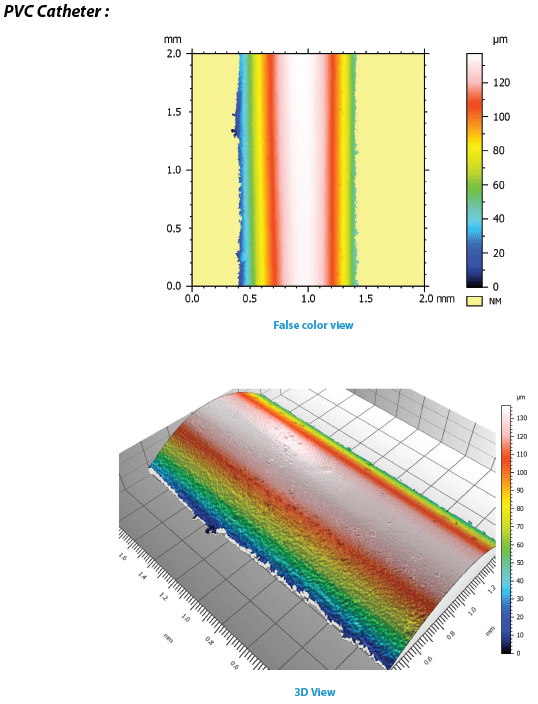
3D Surface
Despite the curvature on polymeric tubes, the Nanovea 3D Non-contact profilometer can scan the surface of the catheters. From the scan done, a 3D image can be obtained for quick, direct visual inspection of the surface.

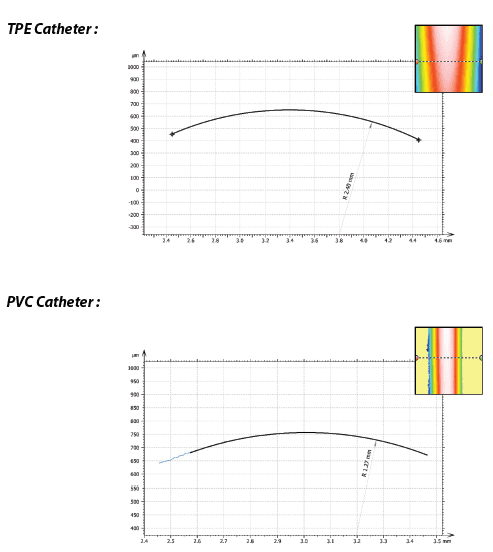
2D Dimensional Analysis
The outer radial dimension was obtained by extracting a profile from the original scan and fitting an arc to the profile. This shows the ability of the 3D Non-contact profilometer in conducting quick dimensional analysis for quality control applications. Multiple profiles can easily be obtained along the catheter’s length as well.
Surface Analysis Roughness
The outer radial dimension was obtained by extracting a profile from the original scan and fitting an arc to the profile. This shows the ability of the 3D Non-contact profilometer in conducting quick dimensional analysis for quality control applications. Multiple profiles can easily be obtained along the catheter’s length as well.
Conclusion
In this application, we have shown how the Nanovea 3D Non-contact profilometer can be used to characterize polymeric tubes. Specifically, surface metrology, radial dimensions, and surface roughness were obtained for medical catheters. The outer radius of the TPE catheter was found to be 2.40mm while the PVC catheter was 1.27mm. The surface of the TPE catheter was found to be rougher than the PVC catheter. The Sa of TPE was 0.9740µm compared to 0.1791µm of PVC. While medical catheters were used for this application, 3D Non-Contact Profilometry can be applied to a large variety of surfaces as well. Obtainable data and calculations are not limited to what is shown.

Honeycomb Panel Surface Finish with 3D Profilometry
INTRODUCTION
Roughness, porosity, and texture of the honeycomb panel surface are critical to quantify for the final panel design. These surface qualities can directly correlate to the aesthetics and functional characteristics of the panel surface. A better understanding of the surface texture and porosity can help optimize the panel surface processing and manufacturability. A quantitative, precise, and reliable surface measurement of the honeycomb panel is needed to control surface parameters for application and painting requirements. The Nanovea 3D Non-Contact sensors utilize unique chromatic confocal technology capable of precisely measuring these panel surfaces.
MEASUREMENT OBJECTIVE
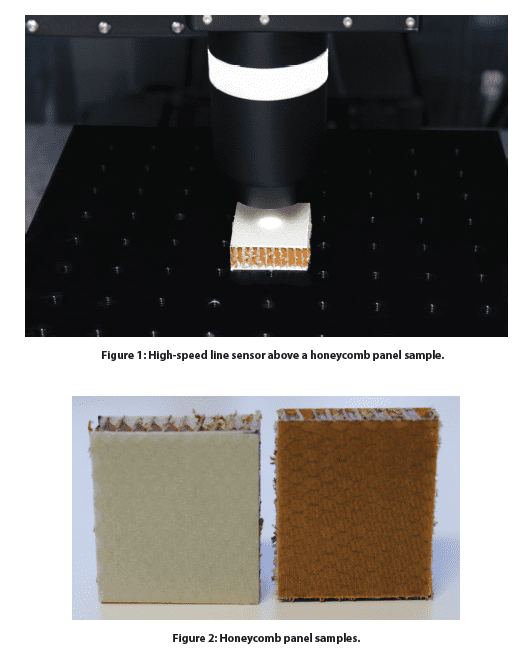
In this study, the Nanovea HS2000 platform equipped with a high-speed Line Sensor was used to measure and compare two honeycomb panels with different surface finishes. We showcase the Nanovea non-contact profilometer’s ability to provide fast and precise 3D profiling measurements and comprehensive in-depth analysis of the surface finish.
RESULTS AND DISCUSSION
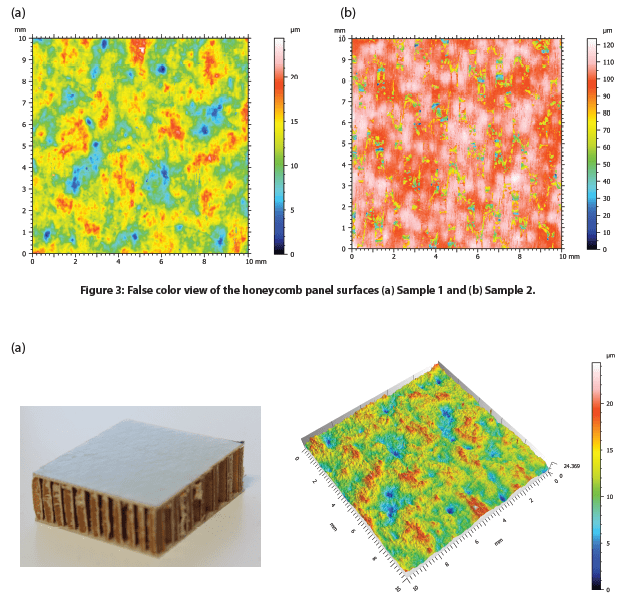
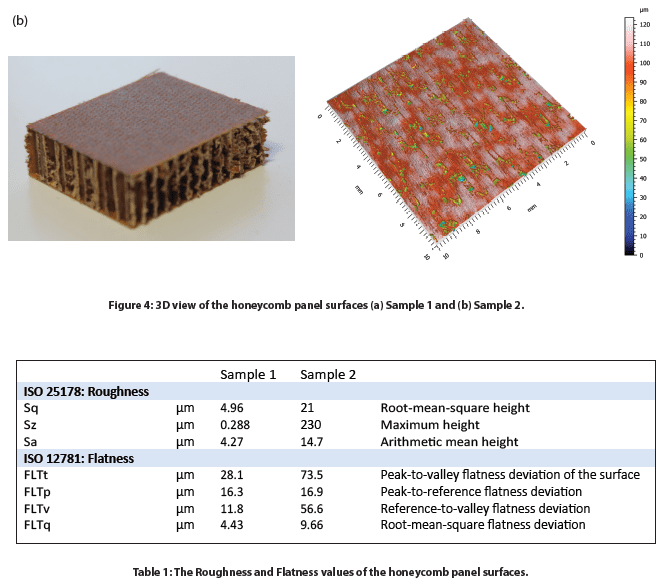
The surface of two honeycomb panel samples with varied surface finishes, namely Sample 1 and Sample 2, were measured. The false color and 3D view of the Samples 1 and 2 surfaces are shown in Figure 3 and Figure 4, respectively. The roughness and flatness values were calculated by advanced analysis software and are compared in Table 1. Sample 2 exhibits a more porous surface compared to Sample 1. As a result, Sample 2 possesses a higher roughness Sa of 14.7 µm, compared to an Sa value of 4.27 µm for Sample 1.
The 2D profiles of the honeycomb panel surfaces were compared in Figure 5, allowing users to have a visual comparison of the height change at different locations of the sample surface. We can observe that Sample 1 has a height variation of ~25 µm between the highest peak and lowest valley location. On the other hand, Sample 2 shows several deep pores across the 2D profile. The advanced analysis software has the ability to automatically locate and measure the depth of six relatively deep pores as shown in the table of Figure 4.b Sample 2. The deepest pore amongst the six possesses a maximum depth of nearly 90 µm (Step 4).
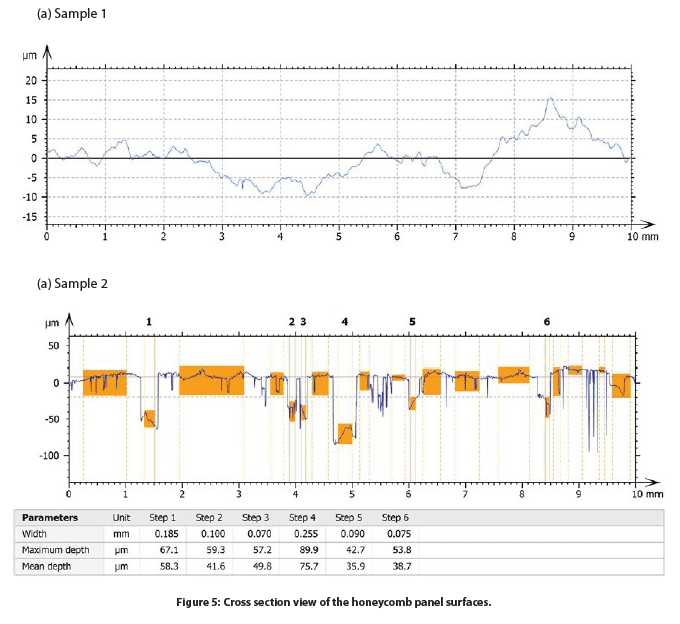
To further investigate the pore size and distribution of Sample 2, porosity evaluation was performed and discussed in the following section. The sliced view is displayed in Figure 5 and the results are summarized in Table 2. We can observe that the pores, marked in blue color in Figure 5, have a relatively homogeneous distribution on the sample surface. The projected area of the pores constitutes 18.9% of the whole sample surface. The volume per mm² of the total pores is ~0.06 mm³. The pores have an average depth of 42.2 µm, and the maximum depth is 108.1 µm.

CONCLUSION

In this application, we have showcased that the Nanovea HS2000 platform equipped with a high-speed Line Sensor is an ideal tool for analyzing and comparing the surface finish of honeycomb panel samples in a fast and accurate manner. The high-resolution profilometry scans paired with an advanced analysis software allow for a comprehensive and quantitative evaluation of the surface finish of honeycomb panel samples.
The data shown here represents only a small portion of the calculations available in the analysis software. Nanovea Profilometers measure virtually any surface for a wide range of applications in the Semiconductor, Microelectronic, Solar, Fiber Optics, Automotive, Aerospace, Metallurgy, Machining, Coatings, Pharmaceutical, Biomedical, Environmental and many other industries.

High Speed Scanning w/ Non-contact Profilometry
Introduction:
Quick and easy set-up surface measurements save time, effort and are essential for quality control, research and development and production facilities. The Nanovea Non-Contact Profilometer is capable of performing both 3D & 2D surface scans to measure nano to macro scale features on any surface, providing broad range usability.


Surface Roughness and Features of a Solar Cell
Importance of Solar Panel Testing
Maximizing a solar cell’s energy absorption is key for the technology’s survival as a renewable resource. The multiple layers of coating and glass protection allow for the absorption, transmittance, and reflection of light that is necessary for the photovoltaic cells to function. Given that most consumer solar cells operate at 15-18% efficiency, optimizing their energy output is an ongoing battle.
Studies have shown that surface roughness plays a pivotal role in the reflectance of light. The initial layer of glass must be as smooth as possible to mitigate the reflectance of light, but the subsequent layers do not follow this guideline. A degree of roughness is necessary at each coatings interface to another to increase the possibility of light scattering within their respective depletion zones and increase the absorption of light within the cell1. Optimizing the surface roughness in these regions allows the solar cell to operate to the best of its ability and with the Nanovea HS2000 High Speed Sensor, measuring surface roughness can be done quickly and accurately.
Measurement Objective
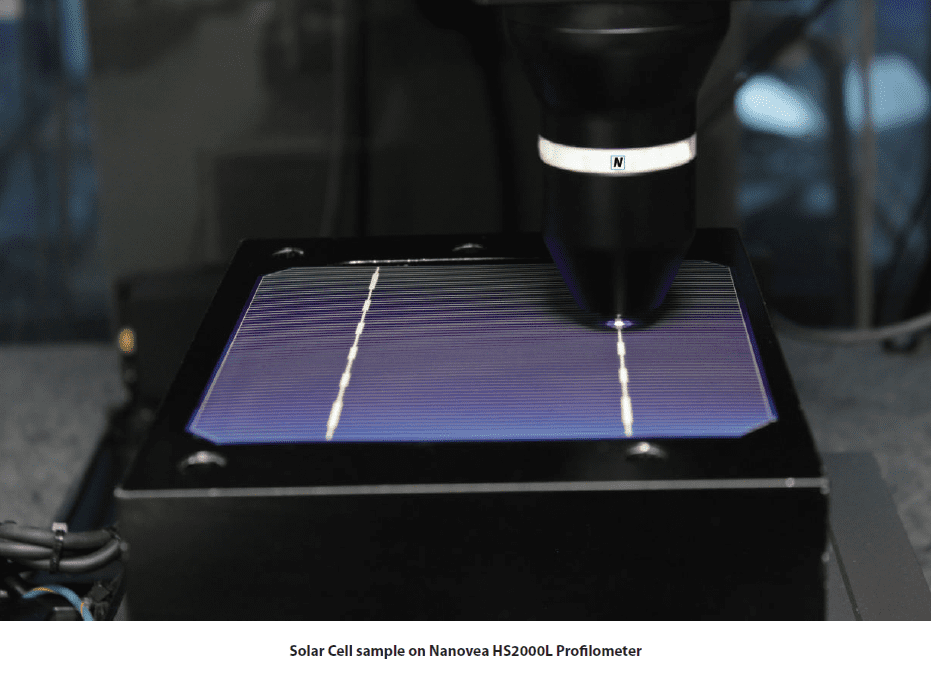
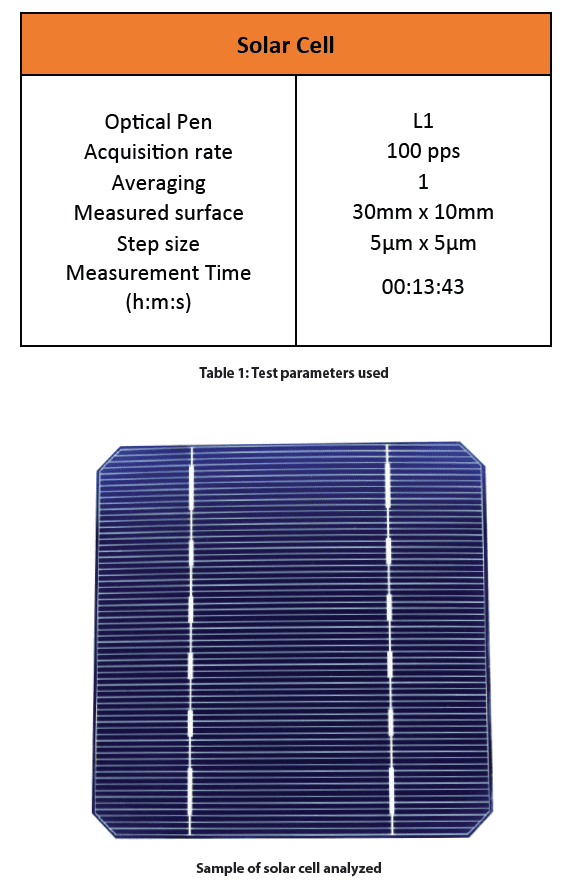
In this study we will display the capabilities of the Nanovea Profilometer HS2000 with High Speed Sensor by measuring the surface roughness and geometric features of a photovoltaic cell. For this demonstration a monocrystalline solar cell with no glass protection will be measured but the methodology can be used for various other applications.
Test Procedure and Procedures
The following test parameters were used to measure the surface of the solar cell.
Results and Discussion
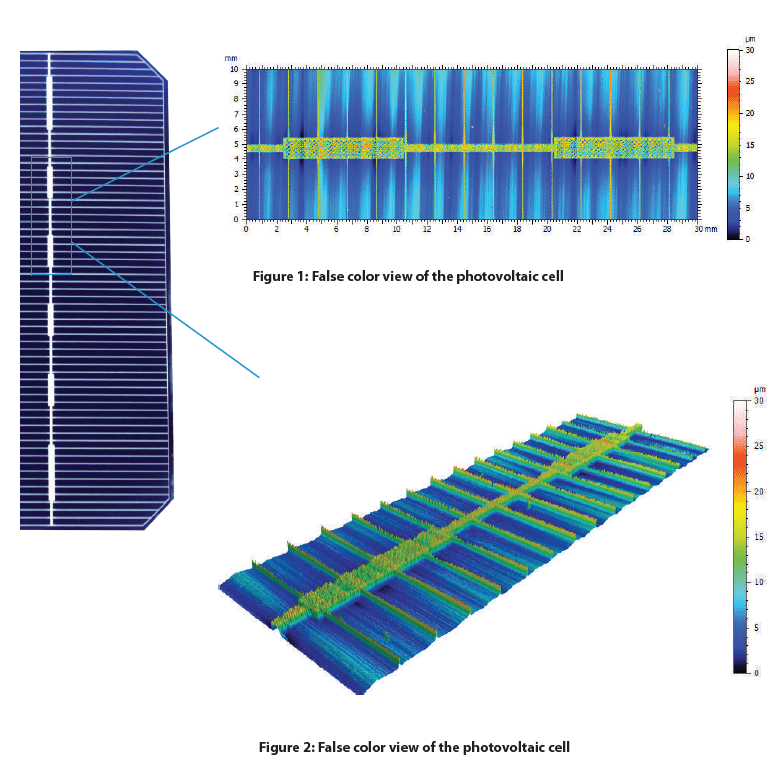
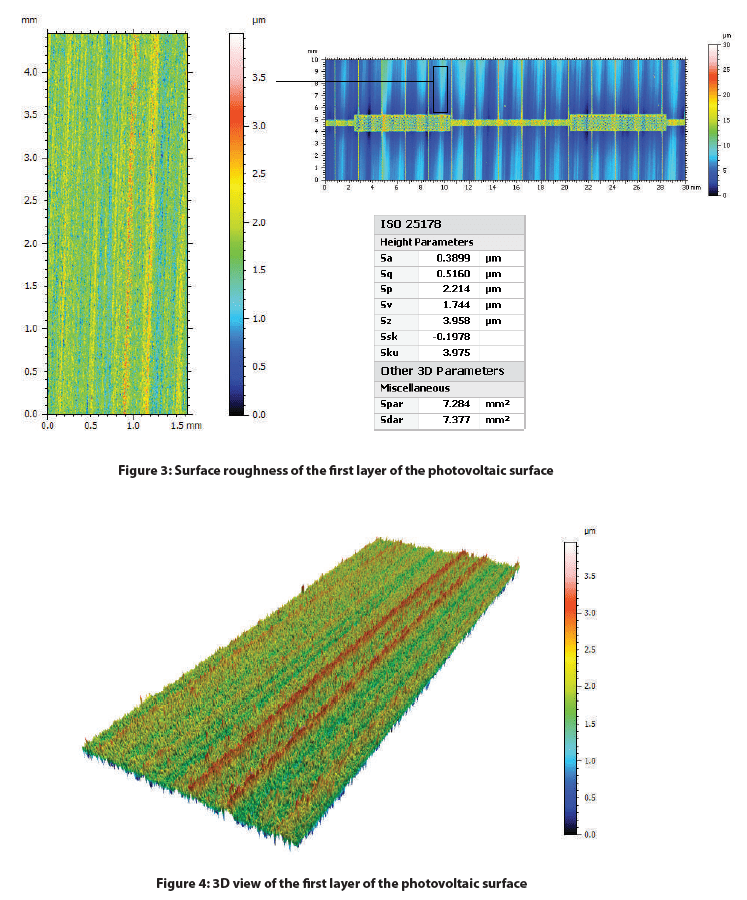
Depicted below is the 2D false-color view of the solar cell and an area extraction of the surface with its respective height parameters. A Gaussian filter was applied to both surfaces and a more aggressive index was used to flatten the extracted area. This excludes form (or waviness) larger than the cut-off index, leaving behind features that represent the solar cell’s roughness.
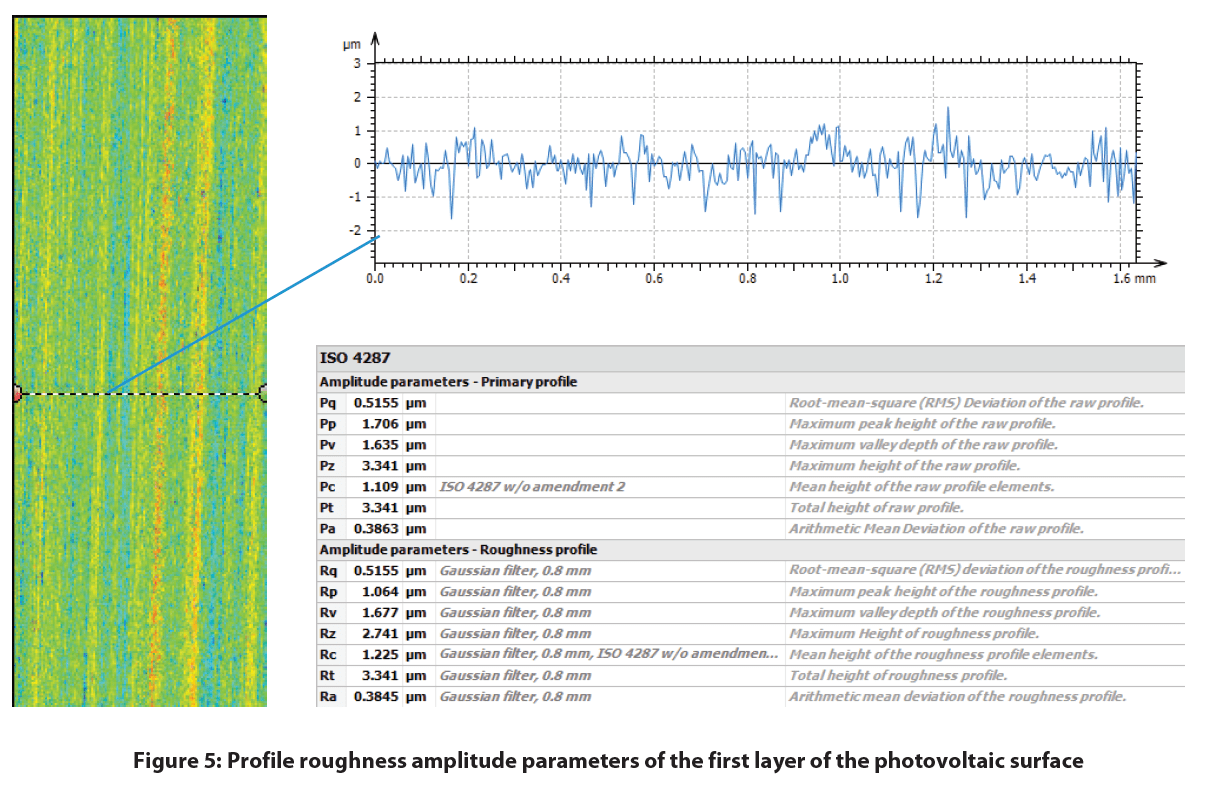
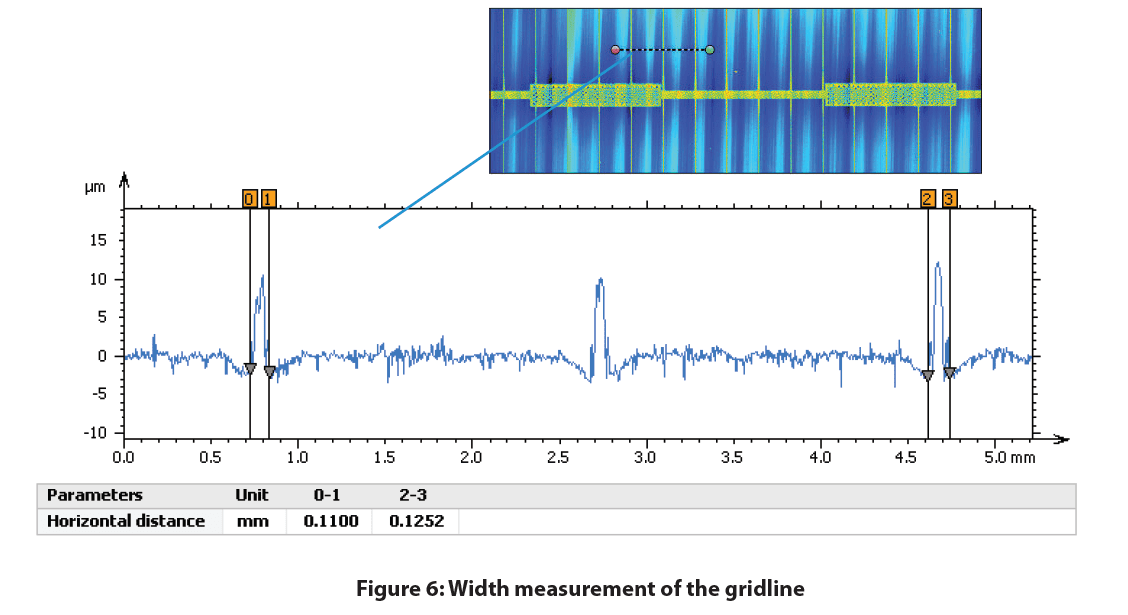
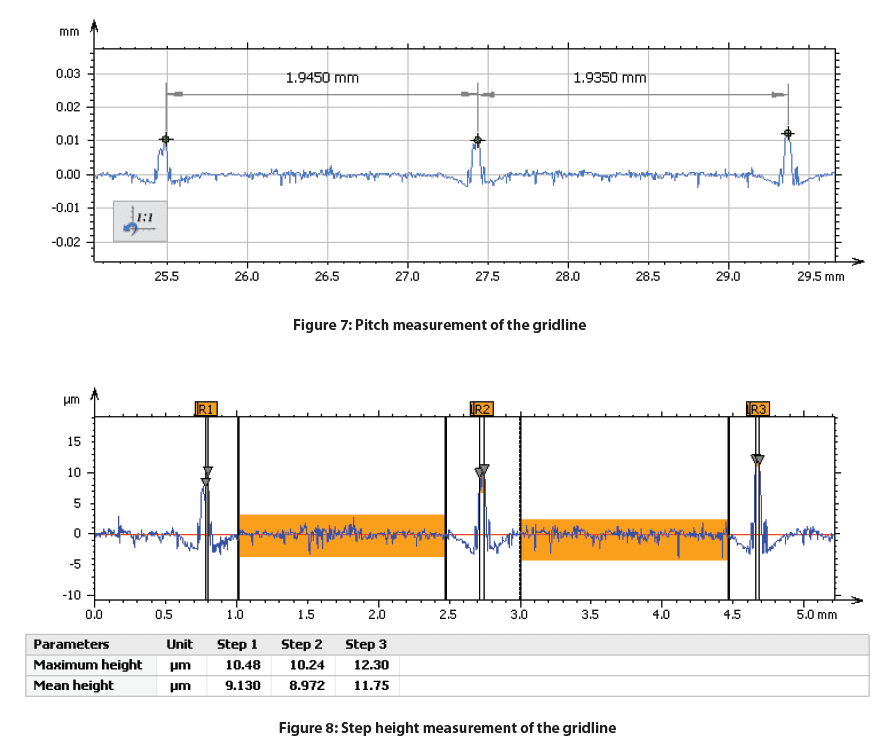
A profile was taken perpendicular to the orientation of the gridlines to measure their geometric characteristics which is shown below. The gridline width, step height, and pitch can be measured for any specific location on the solar cell.
Conclusion

In this study we were able to display the Nanovea HS2000 Line Sensor’s ability to measure a monocrystalline photovoltaic cell’s surface roughness and features. With the ability to automate accurate measurements of multiple samples and set pass fail limits, the Nanovea HS2000 Line Sensor is a perfect choice for quality control inspections.
Reference
1 Scholtz, Lubomir. Ladanyi, Libor. Mullerova, Jarmila. “Influence of Surface Roughness on Optical Characteristics of Multilayer Solar Cells “ Advances in Electrical and Electronic Engineering, vol. 12, no. 6, 2014, pp. 631-638.
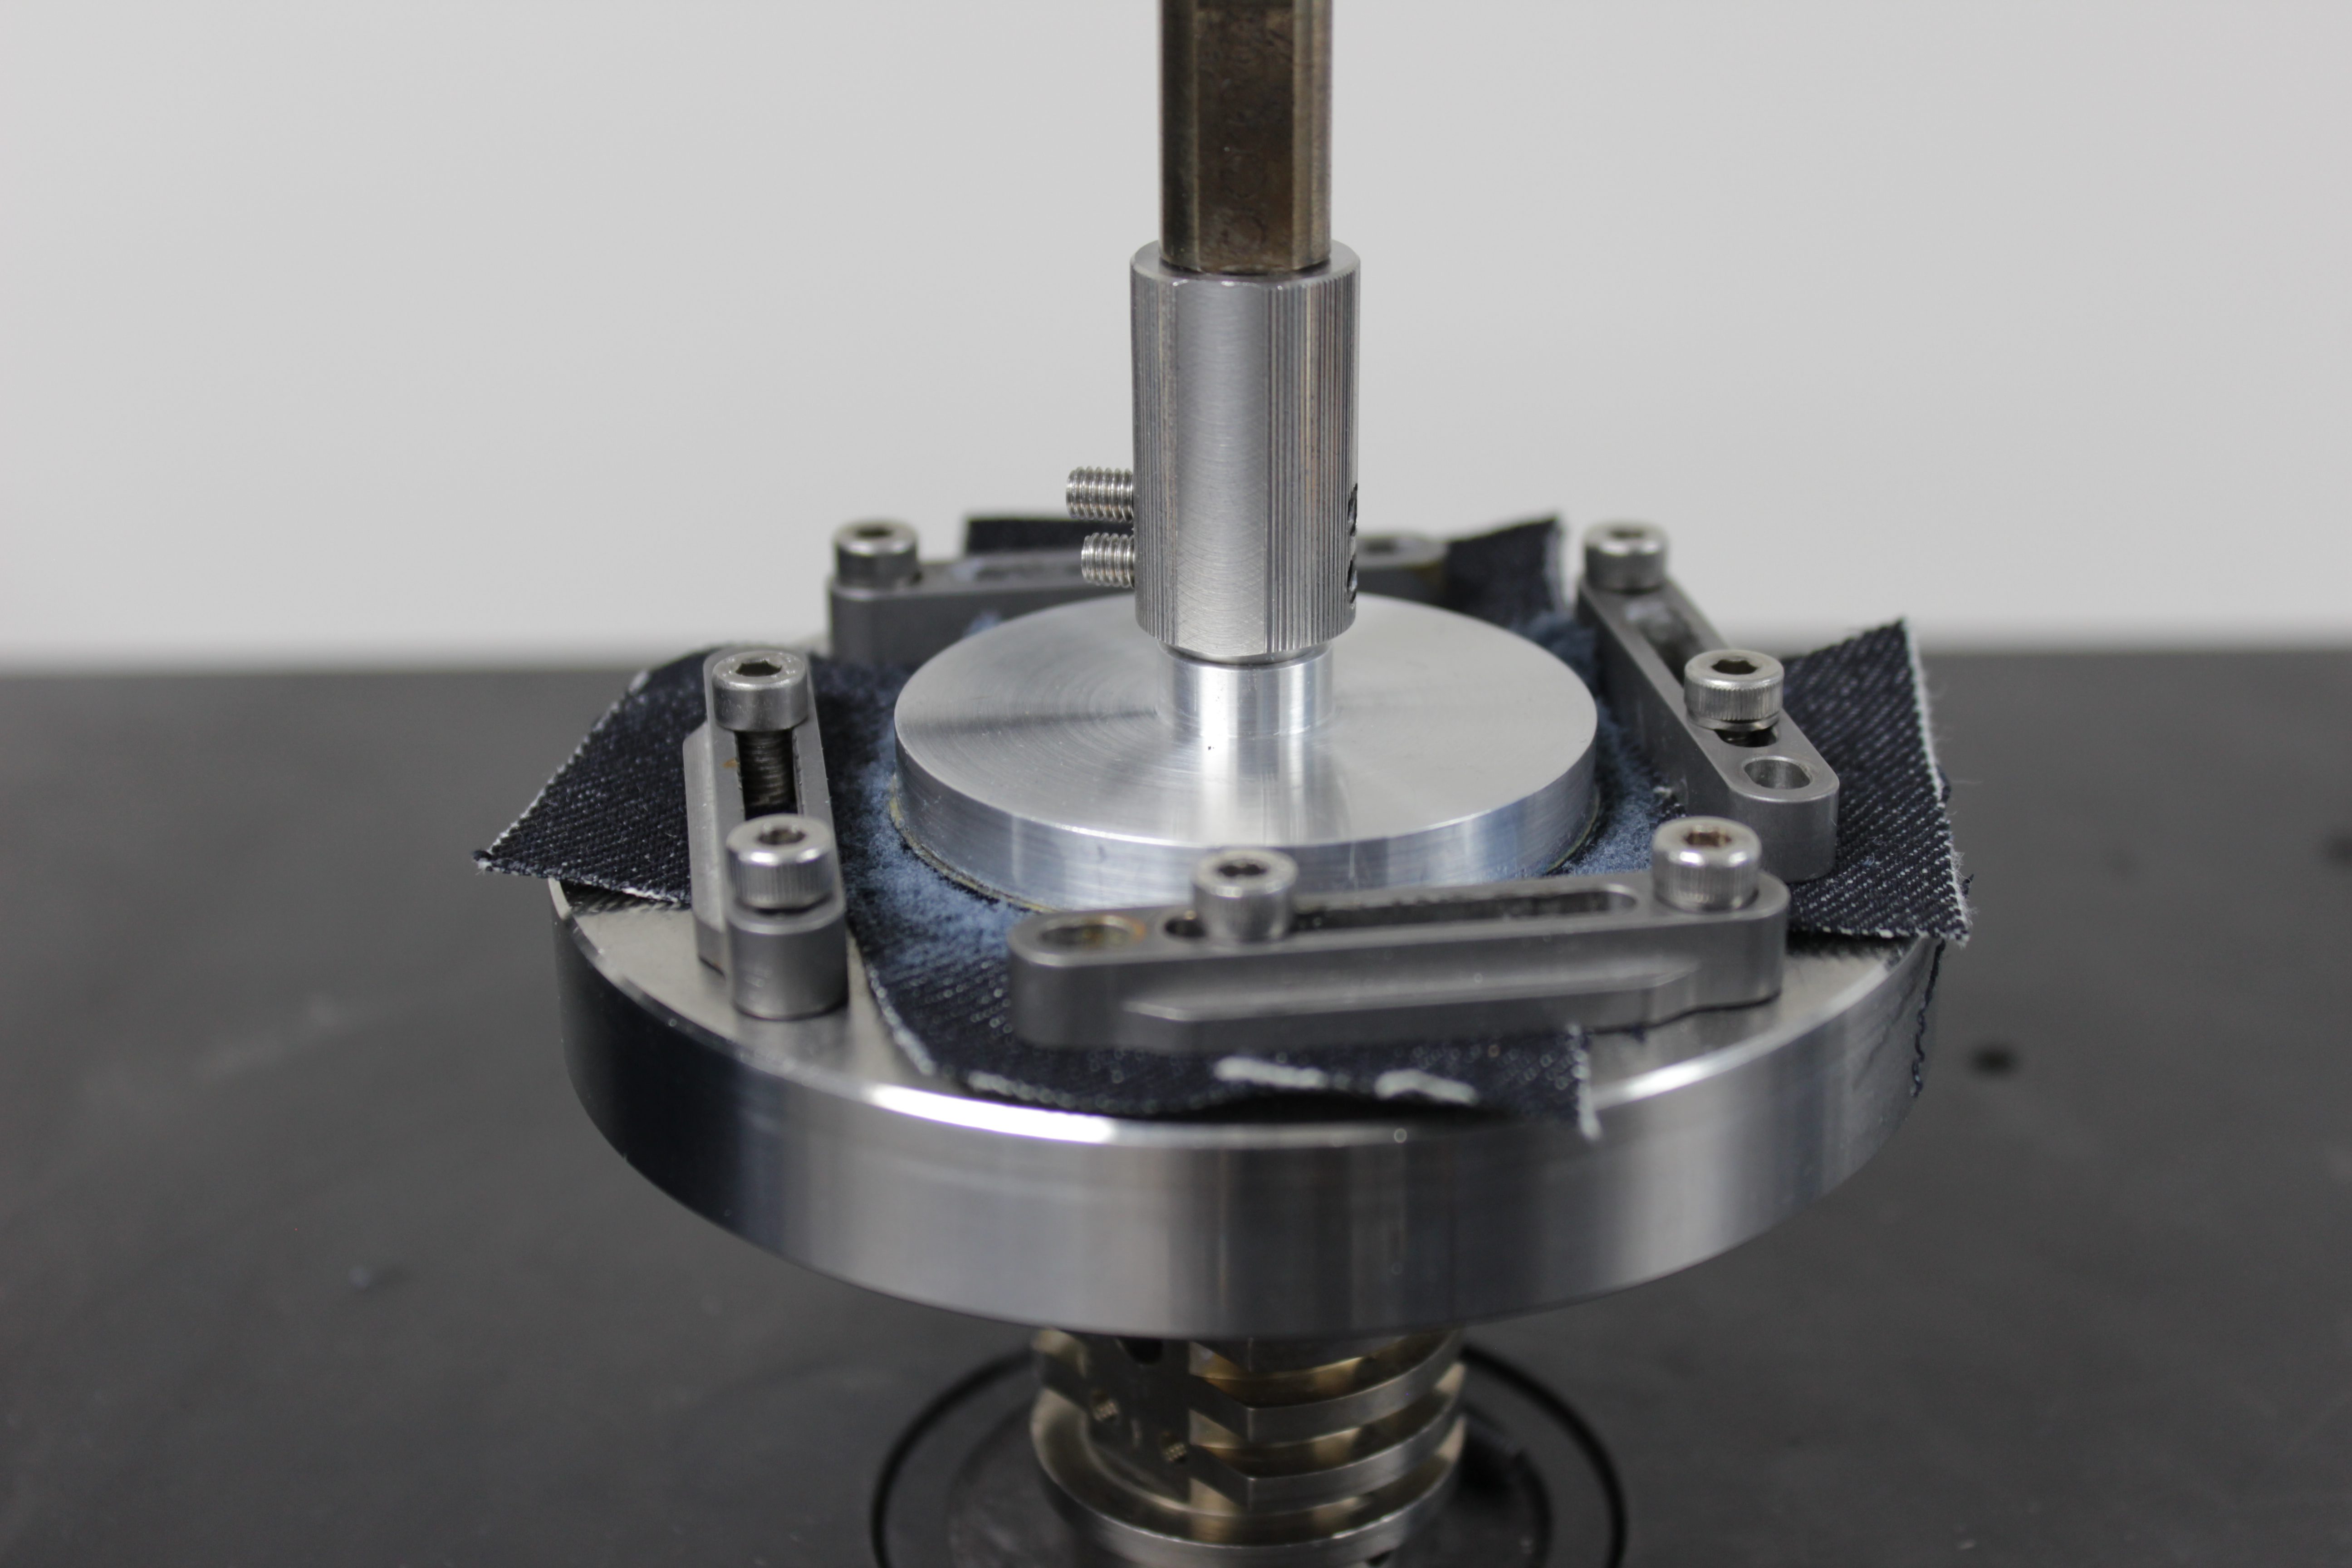
Comparing Abrasion Wear on Denim
Introduction
The form and function of a fabric is determined by its quality and durability. Daily usage of fabrics cause wear and tear on the material, e.g. piling, fuzzing, and discoloration. Subpar fabric quality used for clothing can often lead to consumer dissatisfaction and brand damage.
Attempting to quantify the mechanical properties of fabrics can pose many challenges. The yarn structure and even the factory in which it was produced can result in poor reproducibility of test results. Making it difficult to compare test results from different laboratories. Measuring the wear performance of fabrics is critical to the manufacturers, distributors, and retailers in the textile production chain. A well controlled and reproducible wear resistance measurement is crucial to ensure reliable quality control of the fabric.
Click to read the full application note!
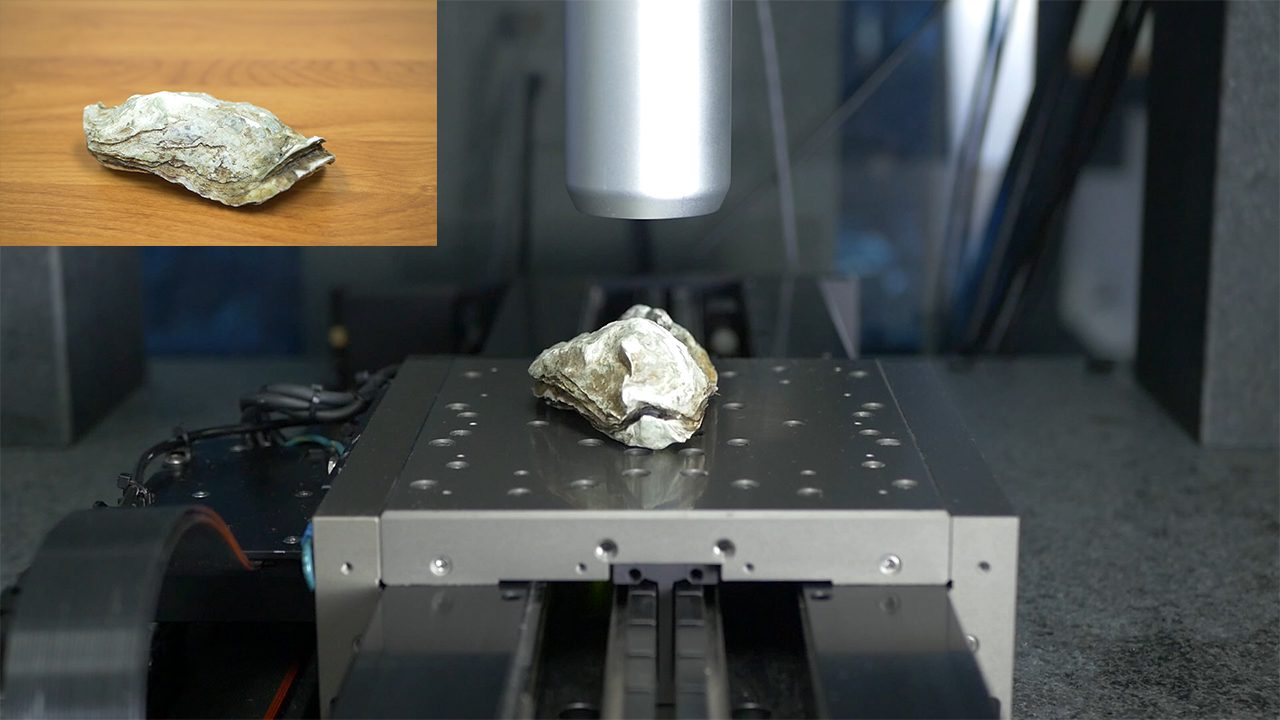
High Speed Characterization of an Oyster Shell
Large samples with complex geometries can prove difficult to work with due to sample preparation, size, sharp angles, and curvature. In this study an oyster shell will be scanned to demonstrate the Nanovea HS2000 Line Sensor’s capability to scan a large, biological sample with complex geometry. While a biological sample was used in this study, the same concepts can be applied to other samples.


