Category: Profilometry | Roughness and Finish

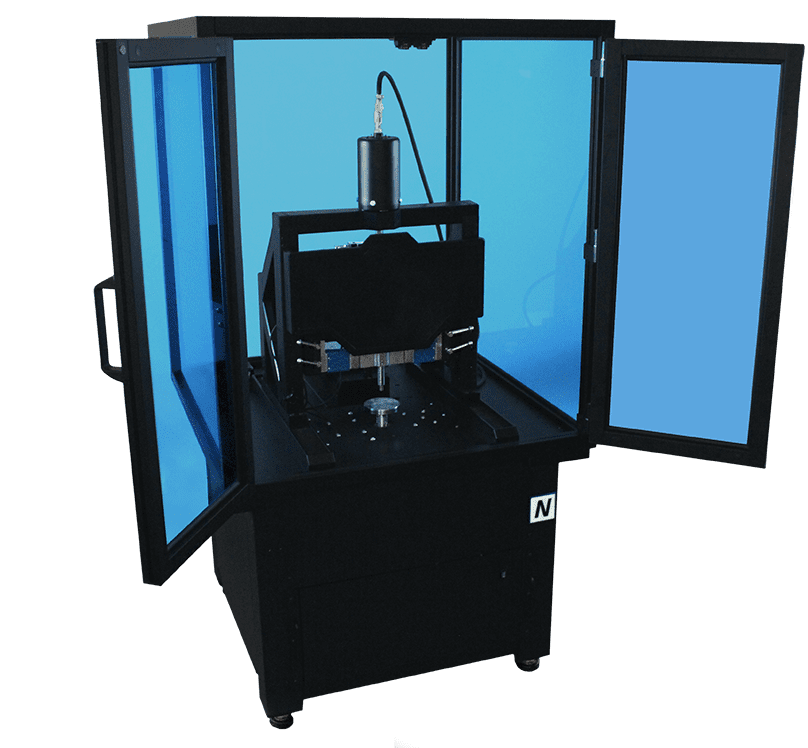
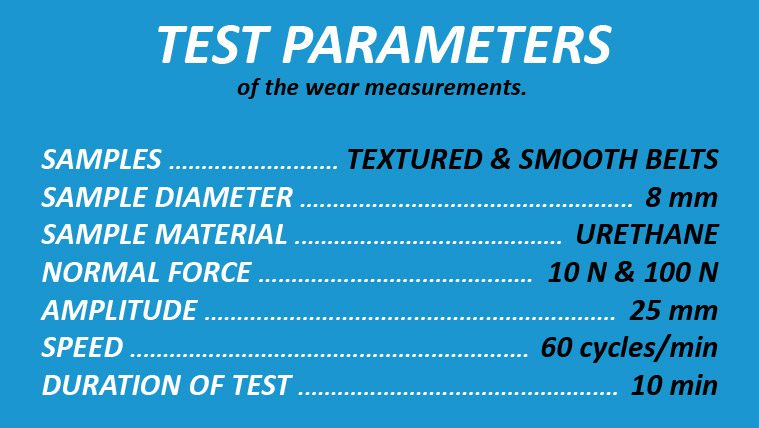
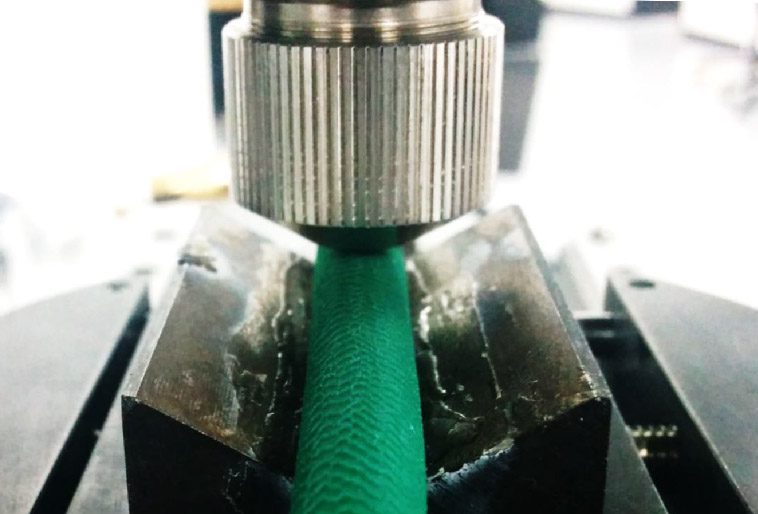
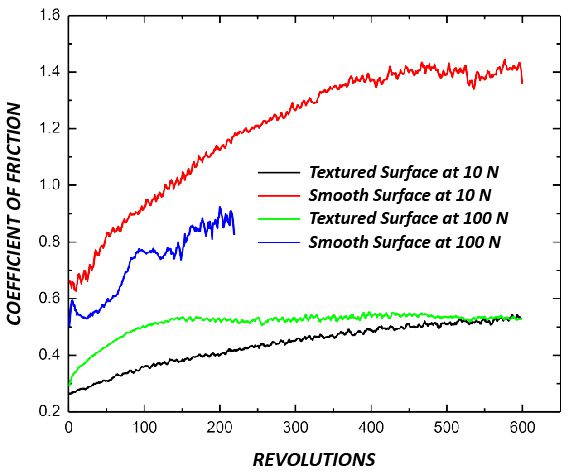
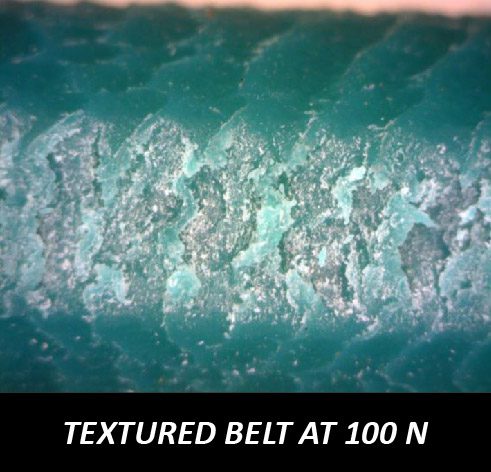
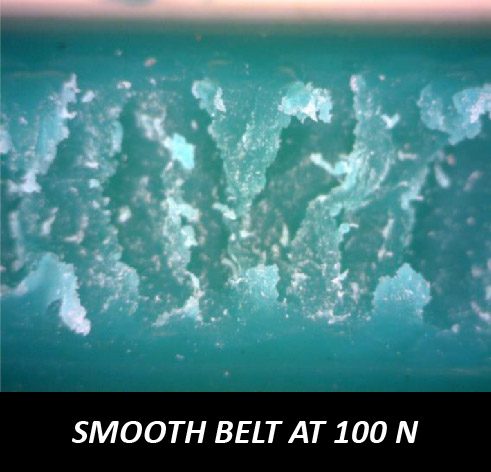
Polymer Belt Wear and Friction using a Tribometer

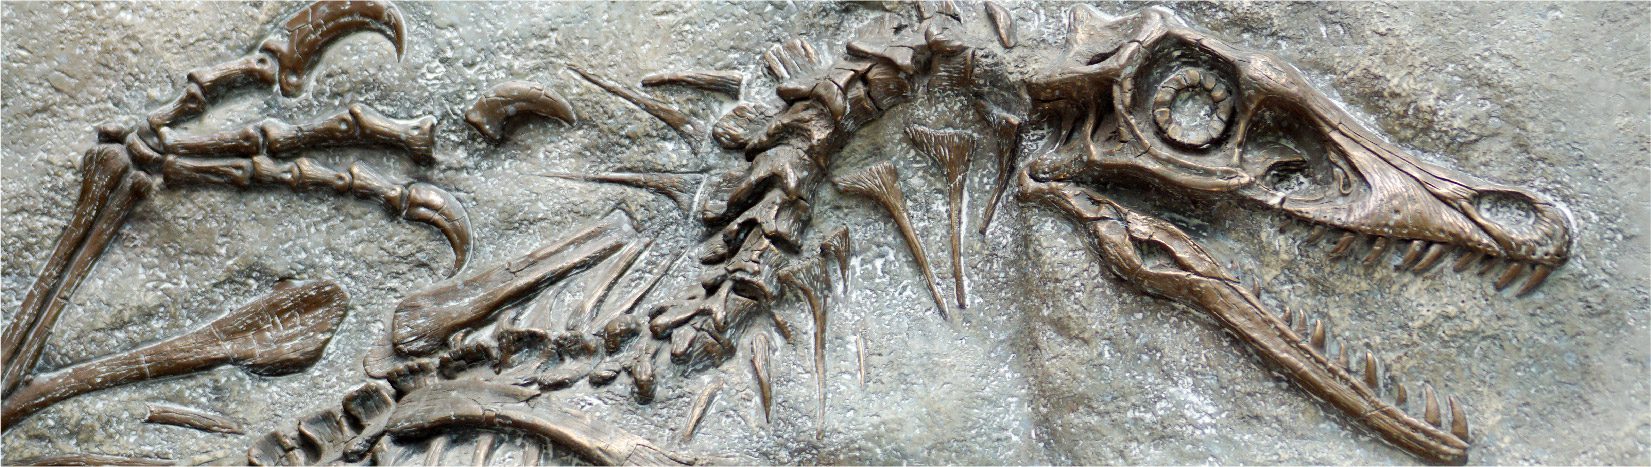
Fossil Microstructure Using 3D Profilometry

Processed Leather Surface Finish using 3D Profilometry

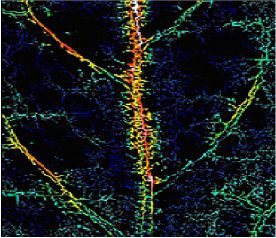
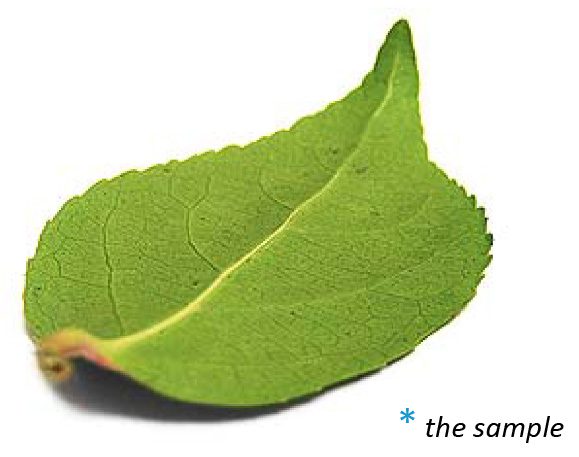
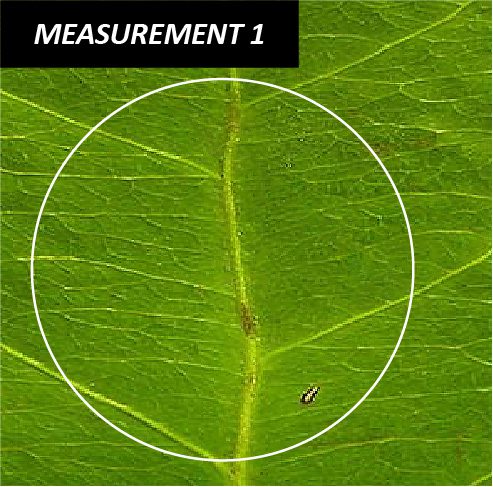
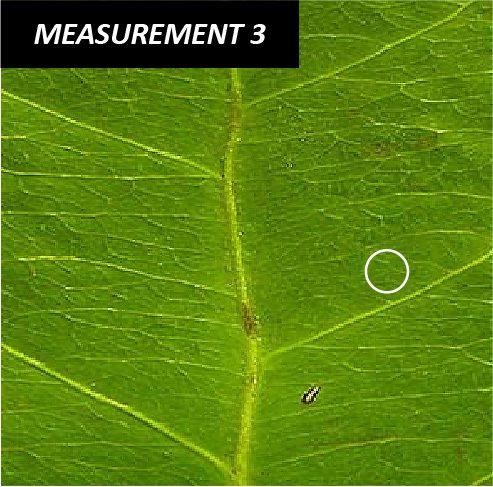
Organic Surface Topography using Portable 3D Profilometer

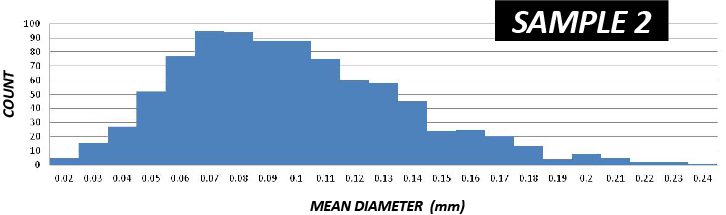
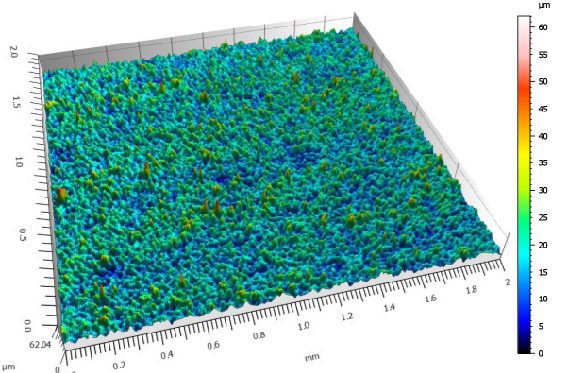
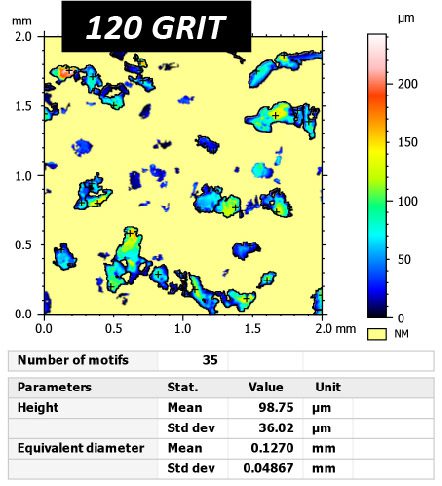
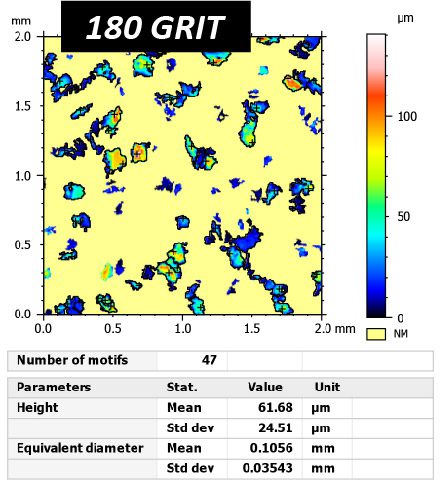
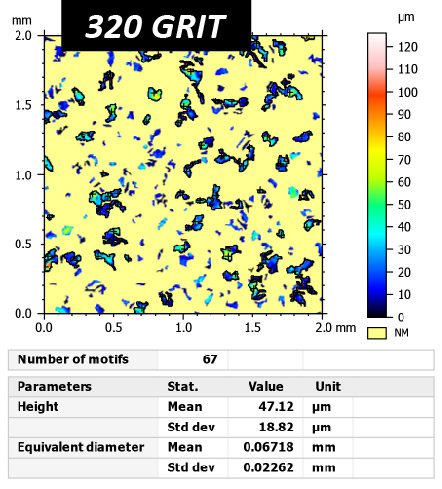
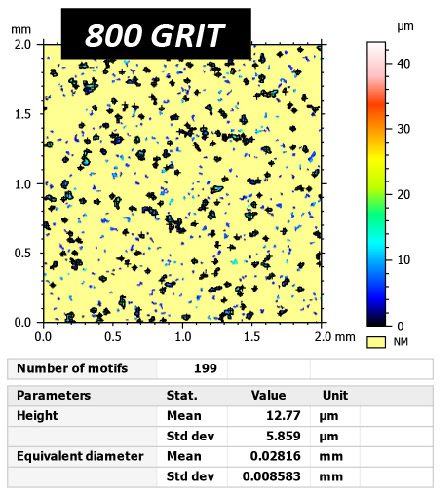
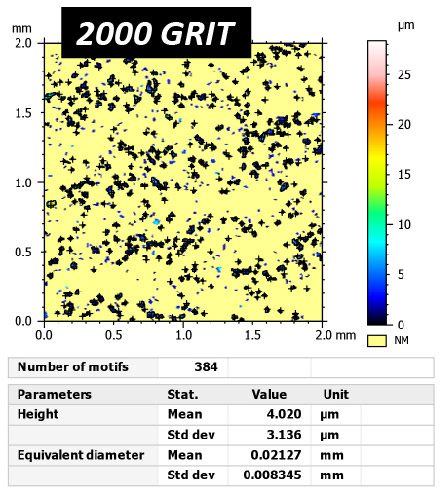
Sandpaper: Roughness & Particle Diameter Analysis
Surface Boundary Measurement
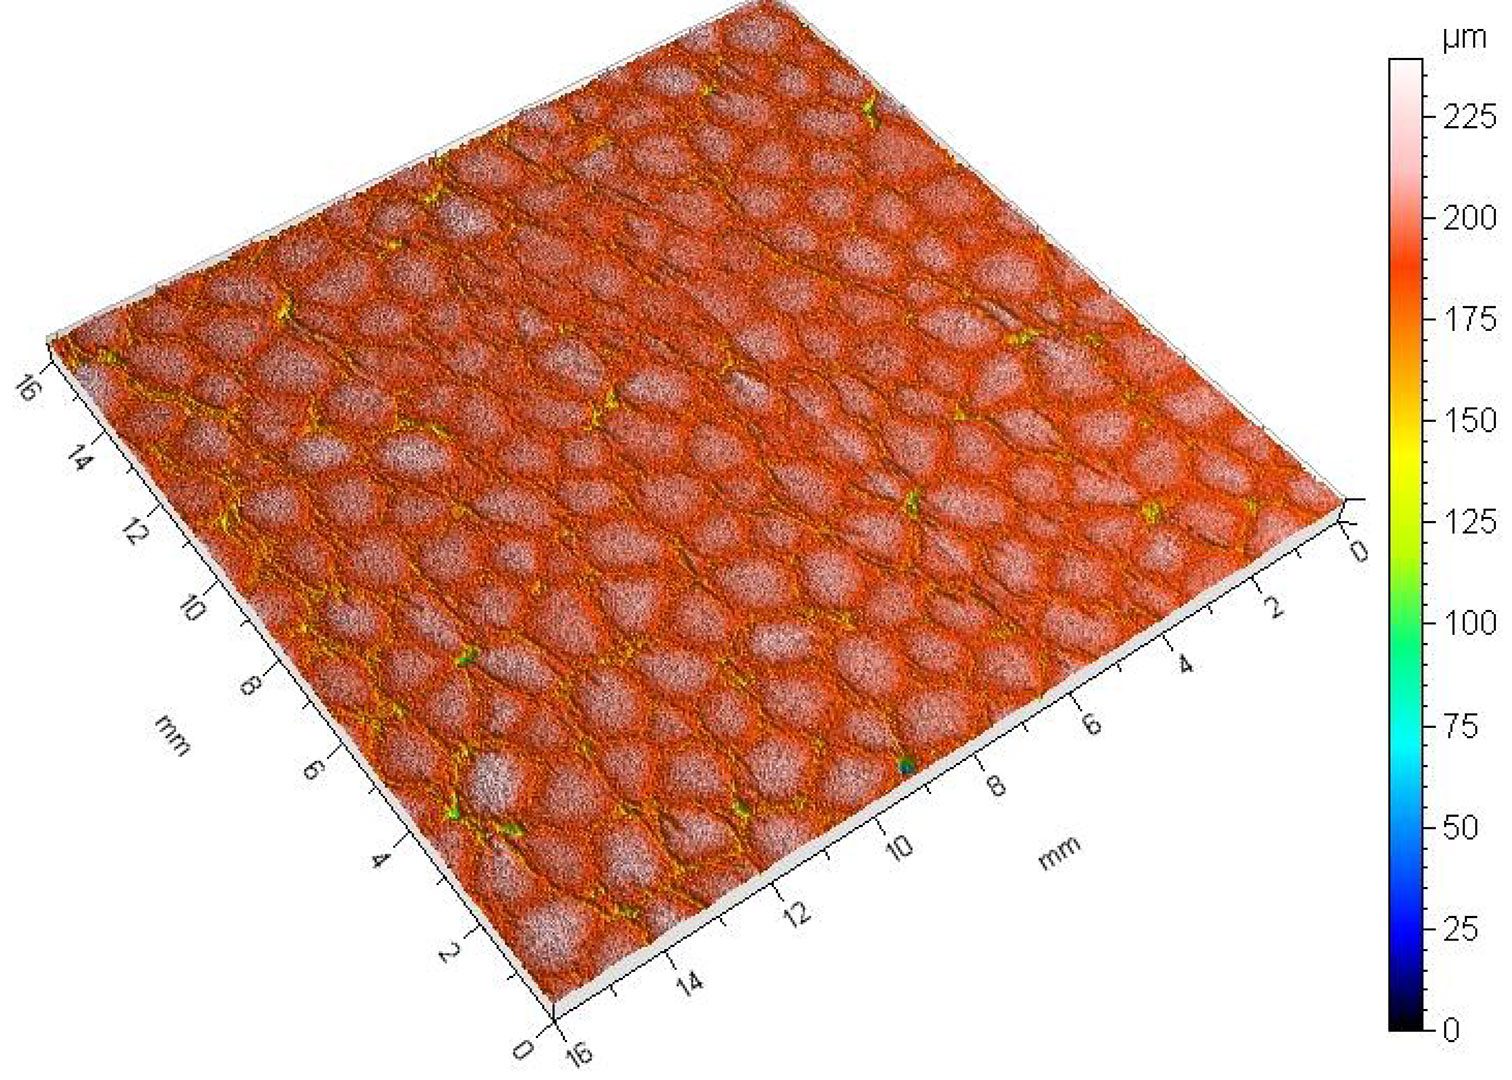
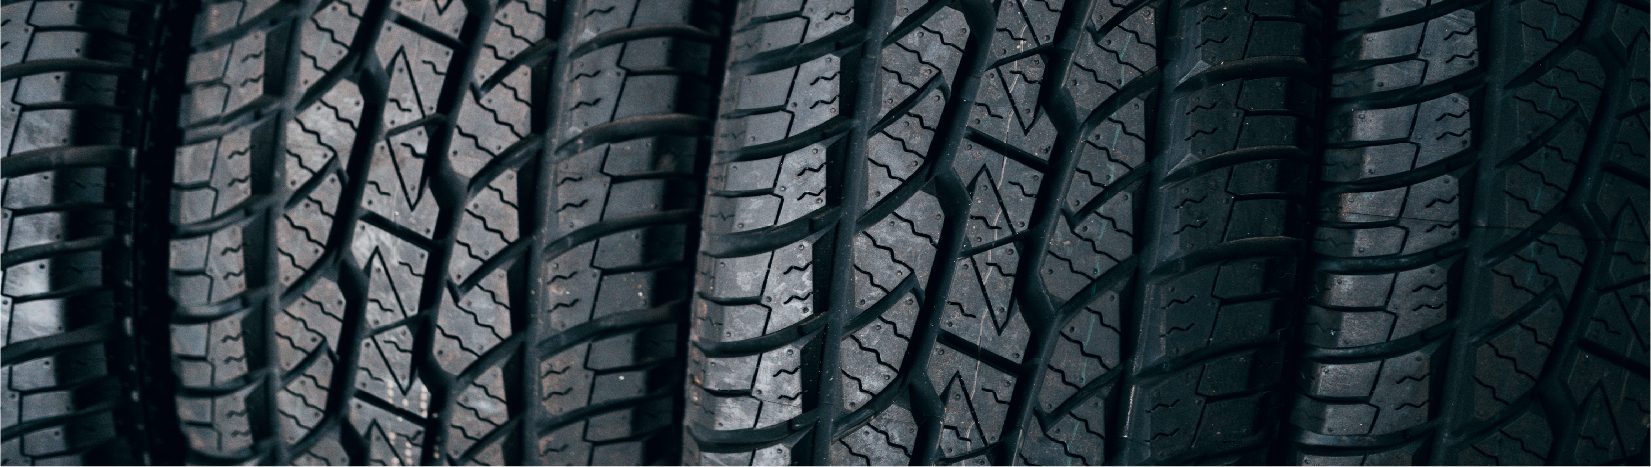
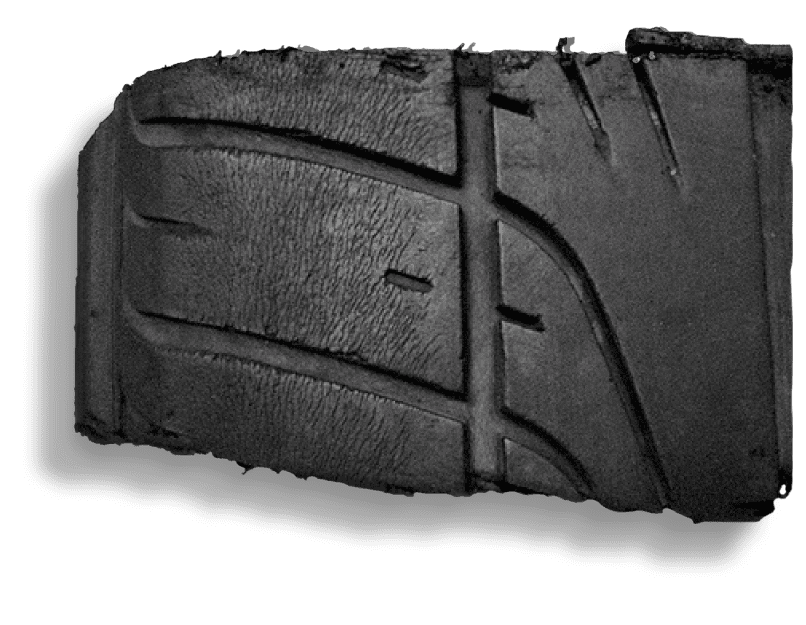
Tire Tread Depth & Rubber Surface Roughness Measurement | 3D Optical Profiler

Fish Scale Surface Analysis Using 3D Optical Profiler

Pharmaceutical Tablets Surface Roughness Inspection
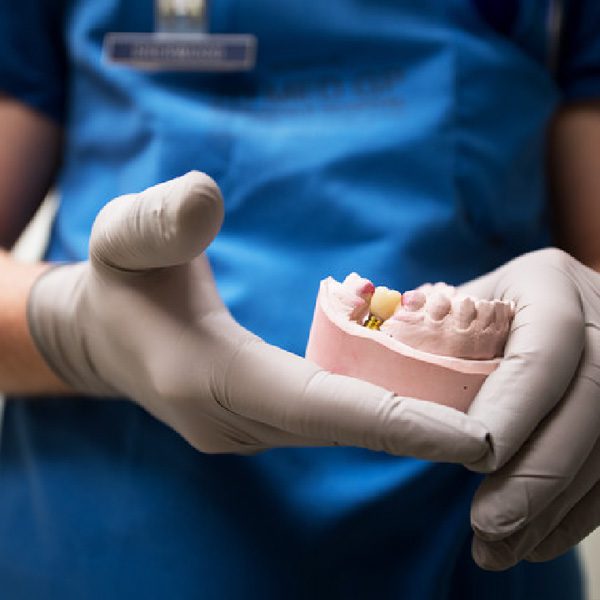
Dental Tools: Dimensional and Surface Roughness Analysis

INTRODUCTION
Having precise dimensions and optimal surface roughness are vital to the functionality of dental screws. Many dental screw dimensions require high precision such as radii, angles, distances, and step heights. Understanding local surface roughness is also highly important for any medical tool or part being inserted inside the human body to minimize sliding friction.
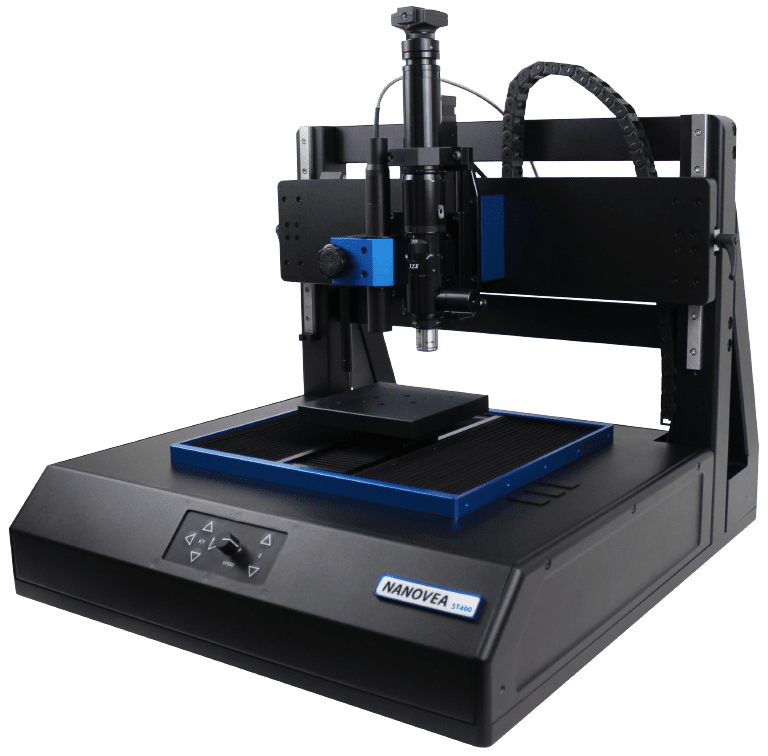
NON-CONTACT PROFILOMETRY FOR DIMENSIONAL STUDY
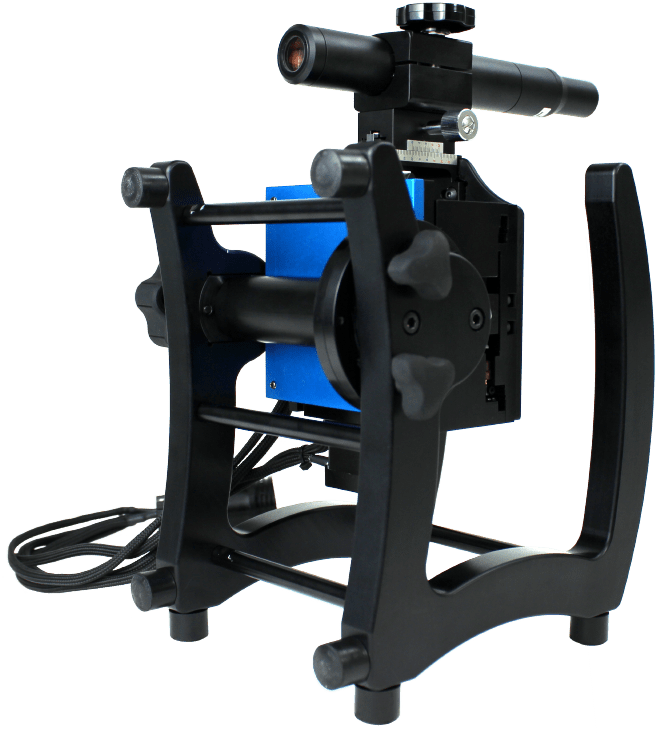
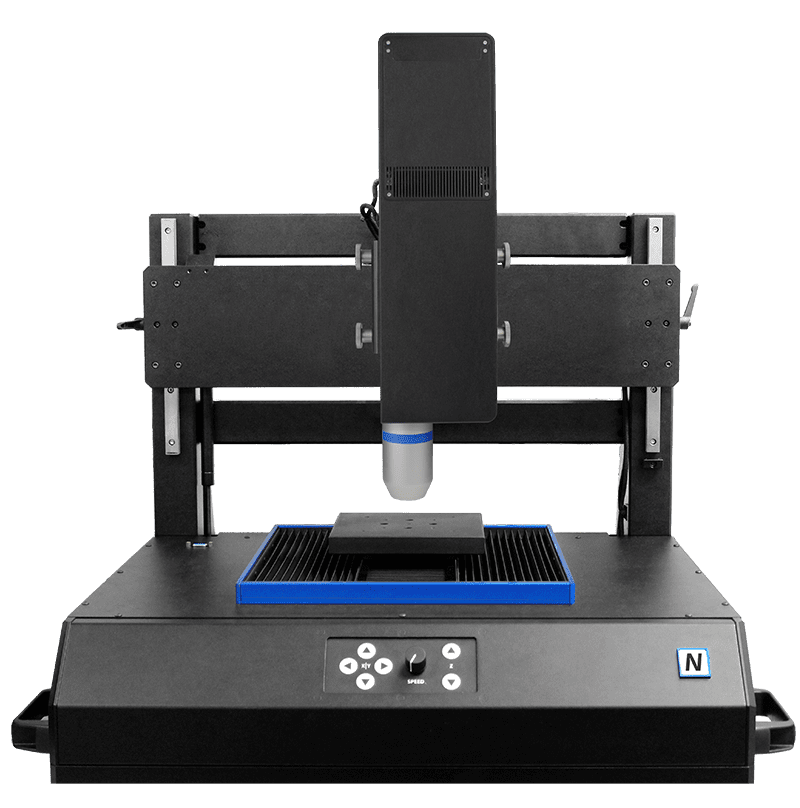
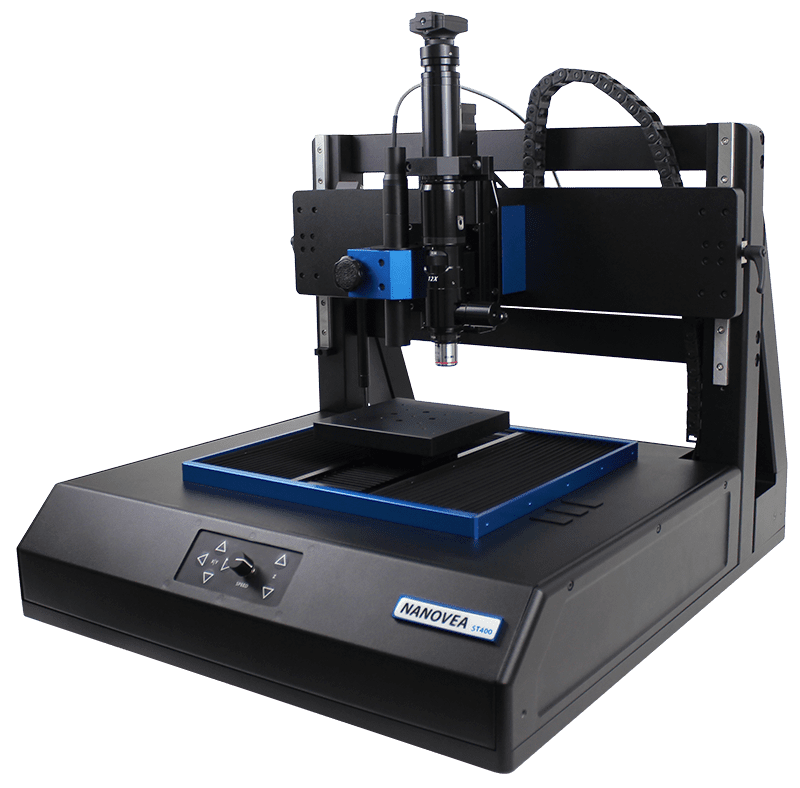
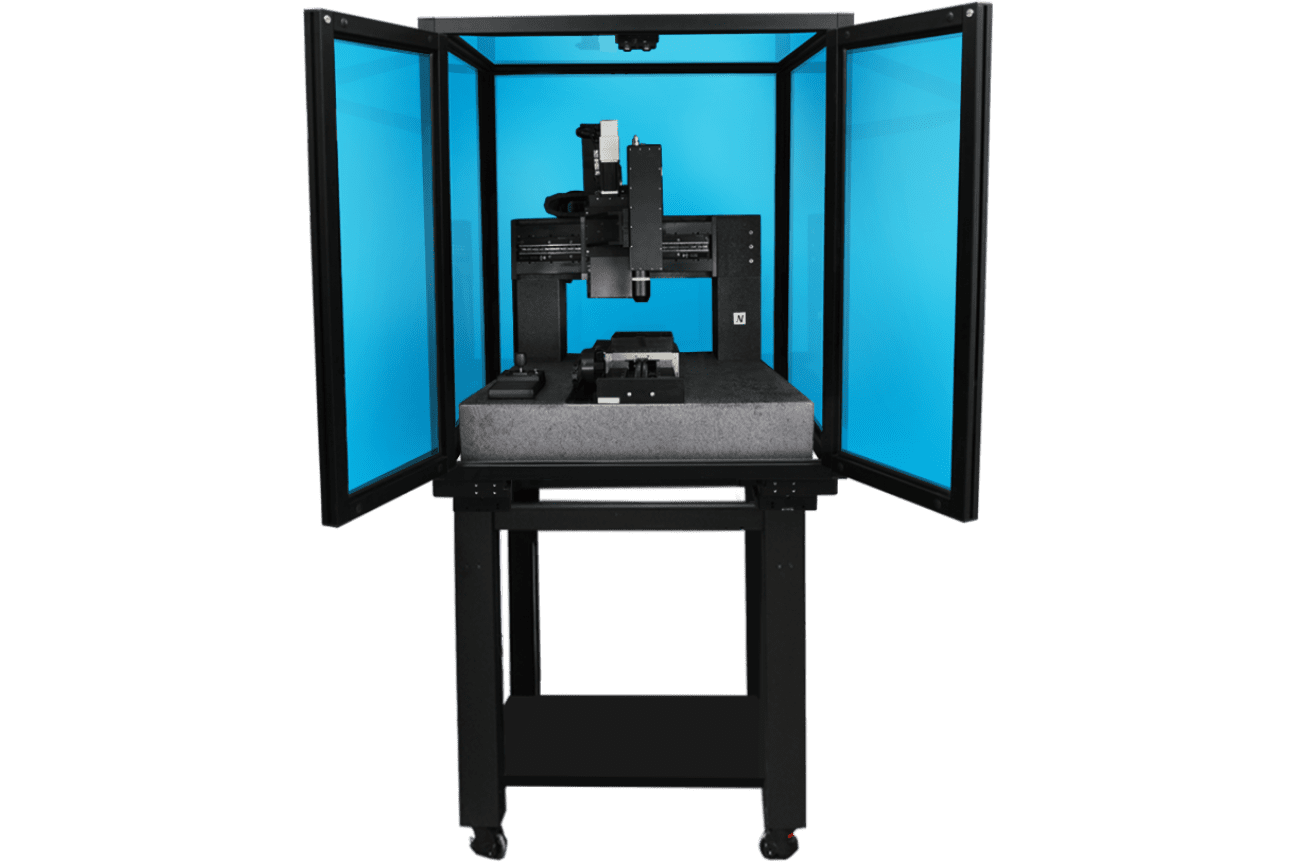
Nanovea 3D Non-Contact Profilers use a chromatic light-based technology to measure any material surface: transparent, opaque, specular, diffusive, polished or rough. Unlike a touch probe technique, the non-contact technique can measure inside tight areas and will not add any intrinsic errors due to deformation caused by the tip pressing on a softer plastic material. Chromatic light-based technology also offers superior lateral and height accuracies compared to focus variation technology. Nanovea Profilers can scan large surfaces directly without stitching and profile the length of a part in a few seconds. Nano through macro range surface features and high surface angles can be measured due to the profiler’s ability to measure surfaces without any complex algorithms manipulating the results.
MEASUREMENT OBJECTIVE
In this application, the Nanovea ST400 Optical Profiler was used to measure a dental screw along flat and thread features in a single measurement. The surface roughness was calculated from the flat area, and various dimensions of the threaded features were determined.
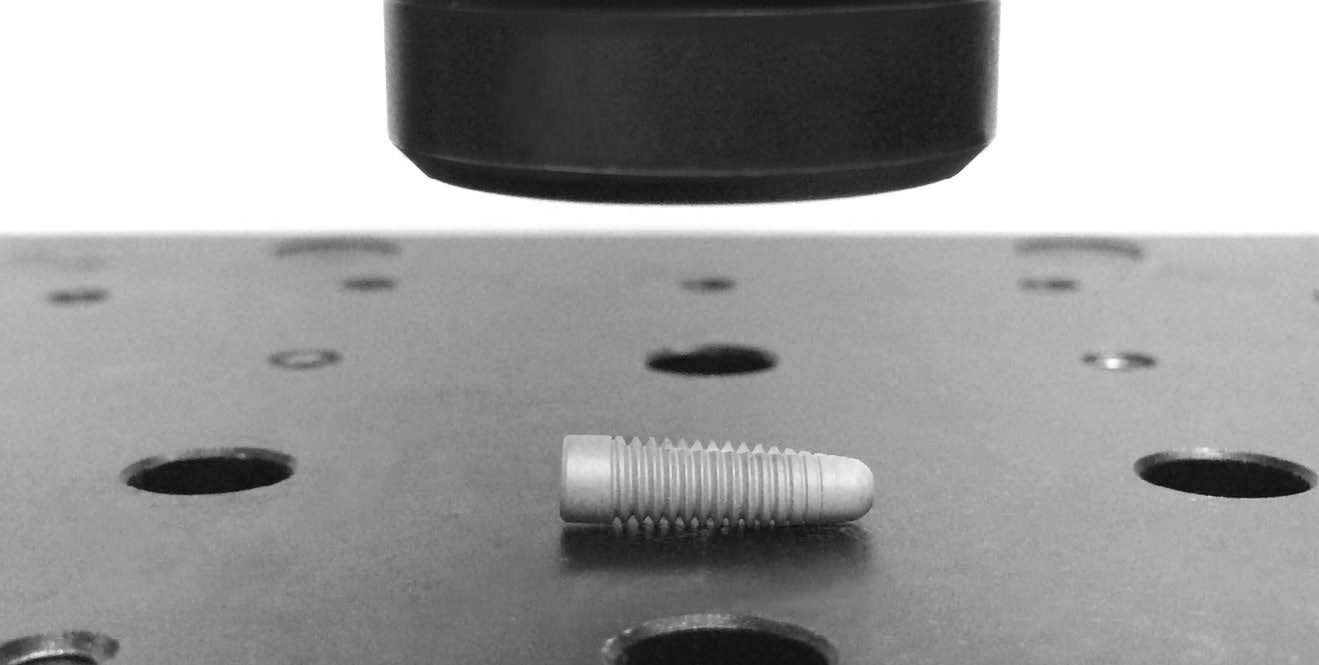
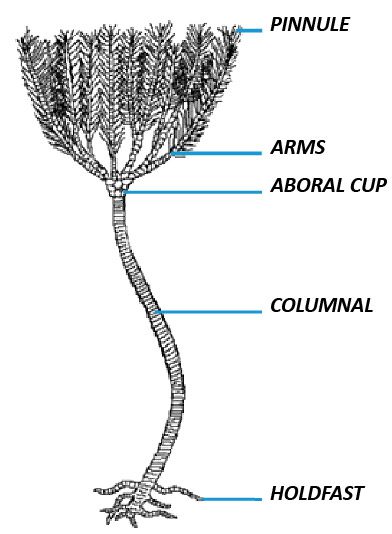
Sample of dental screw analyzed by NANOVEA Optical Profiler.
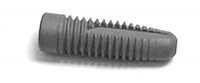
Dental screw sample analyzed.
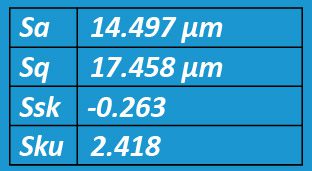
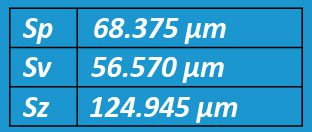
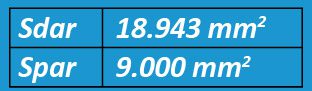
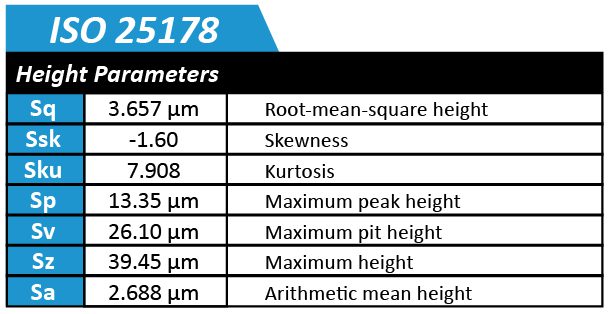
RESULTS
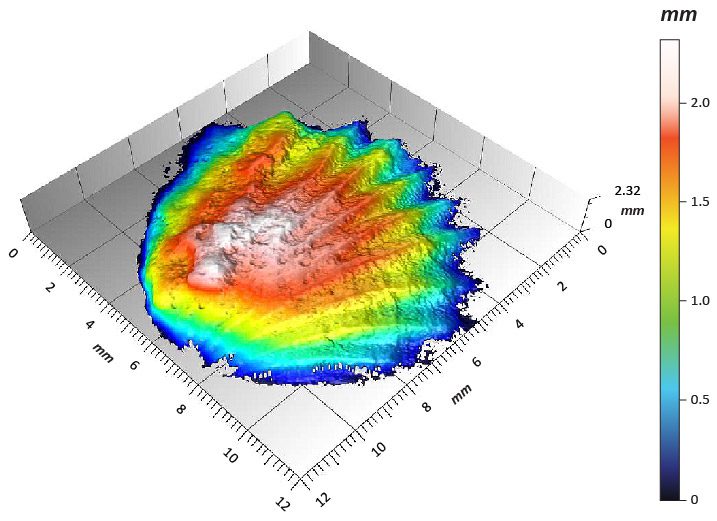
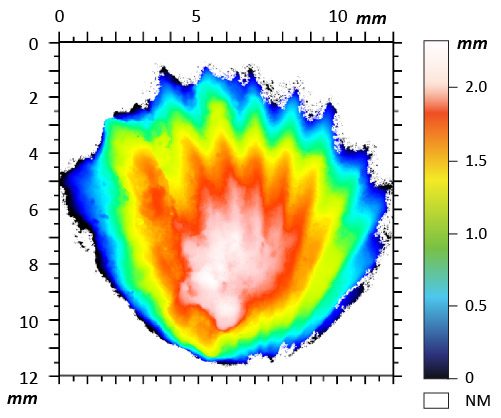
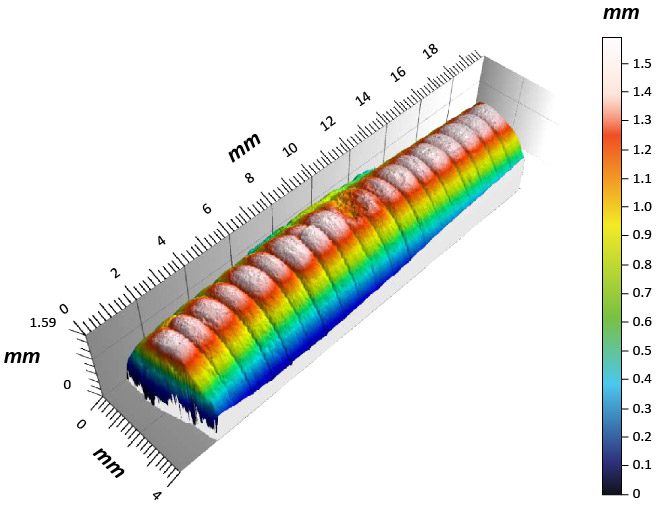
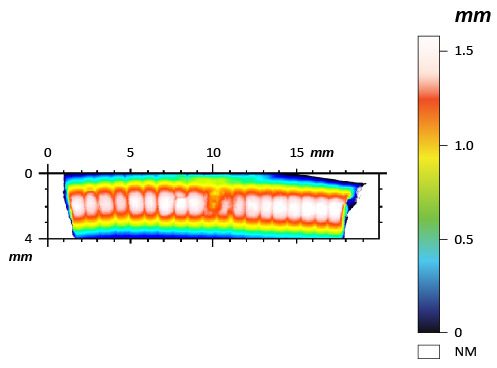
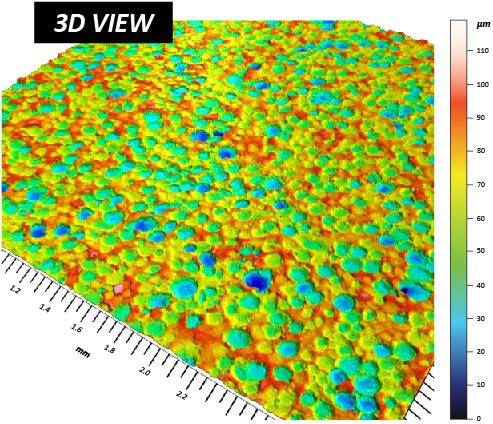
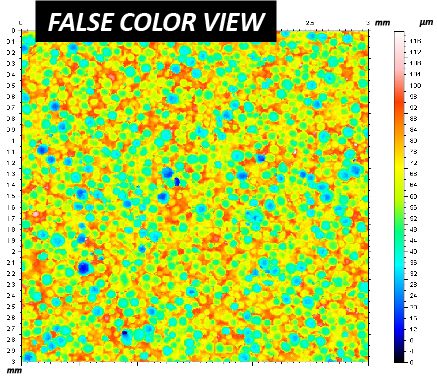
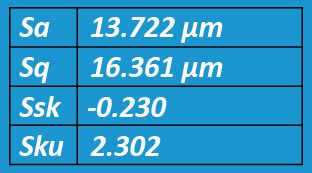
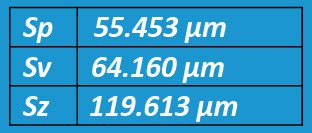
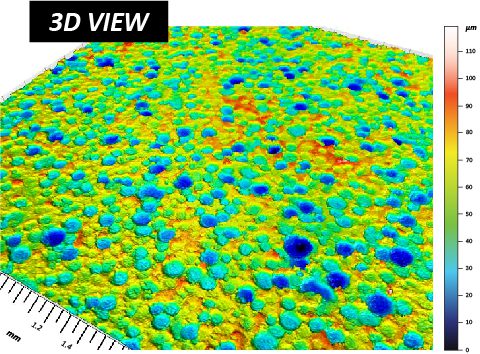
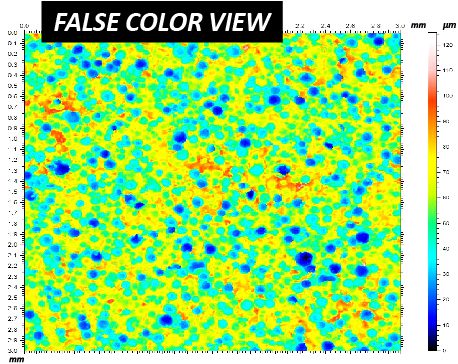
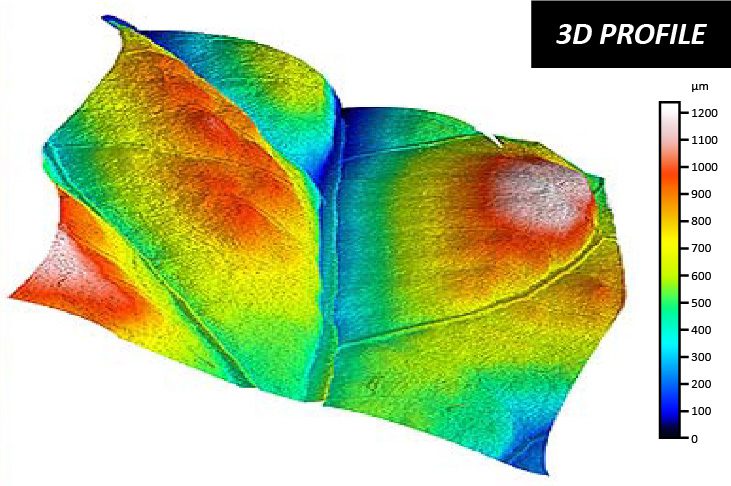
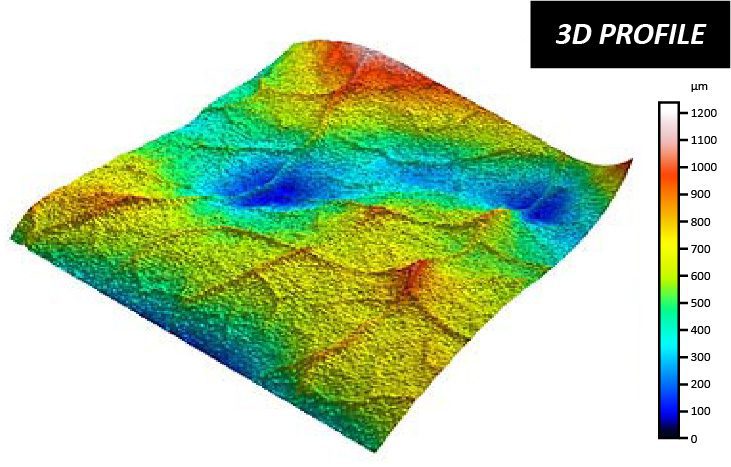
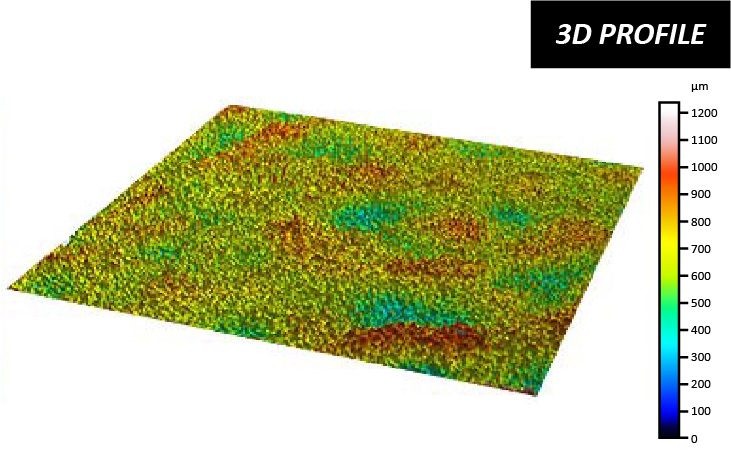
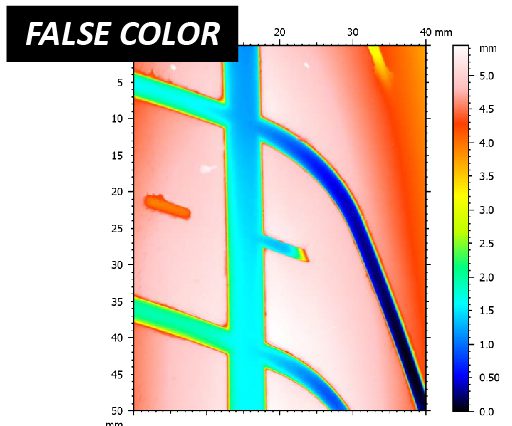
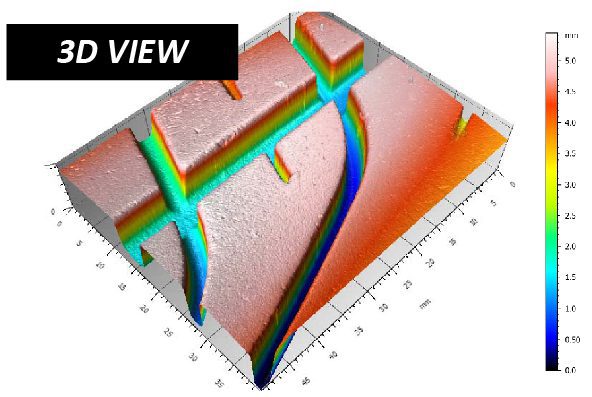
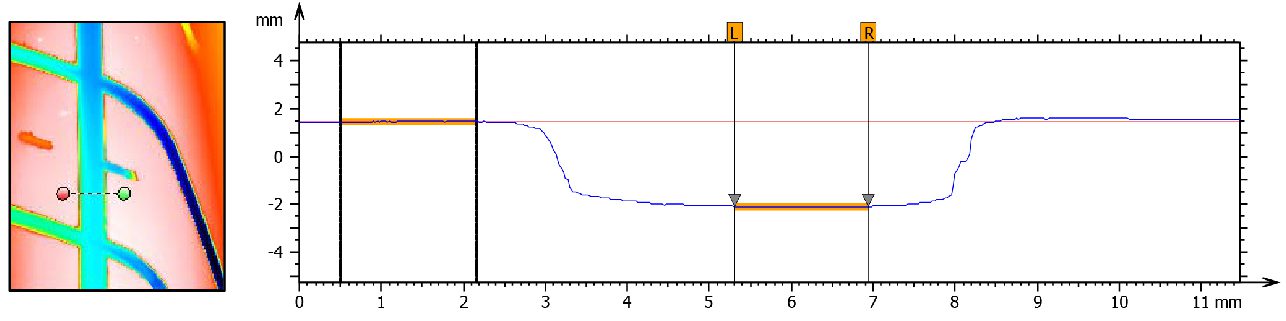
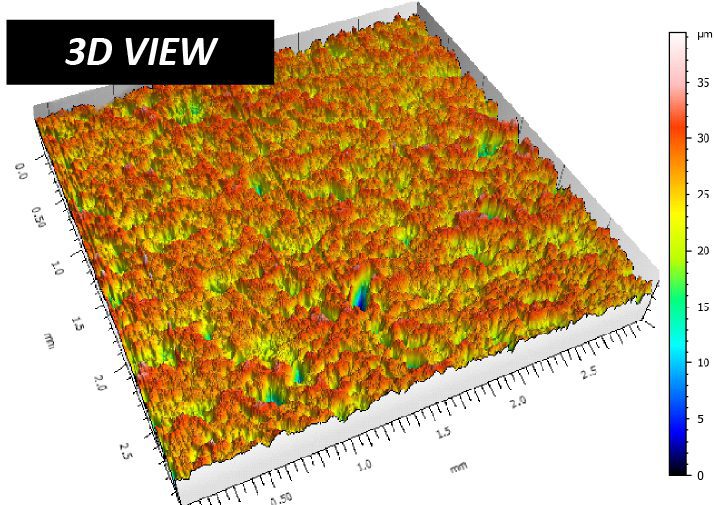
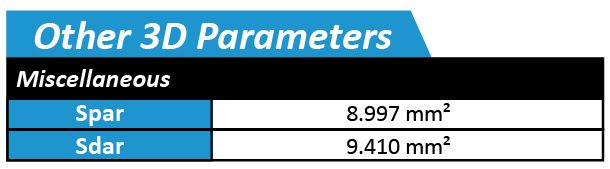
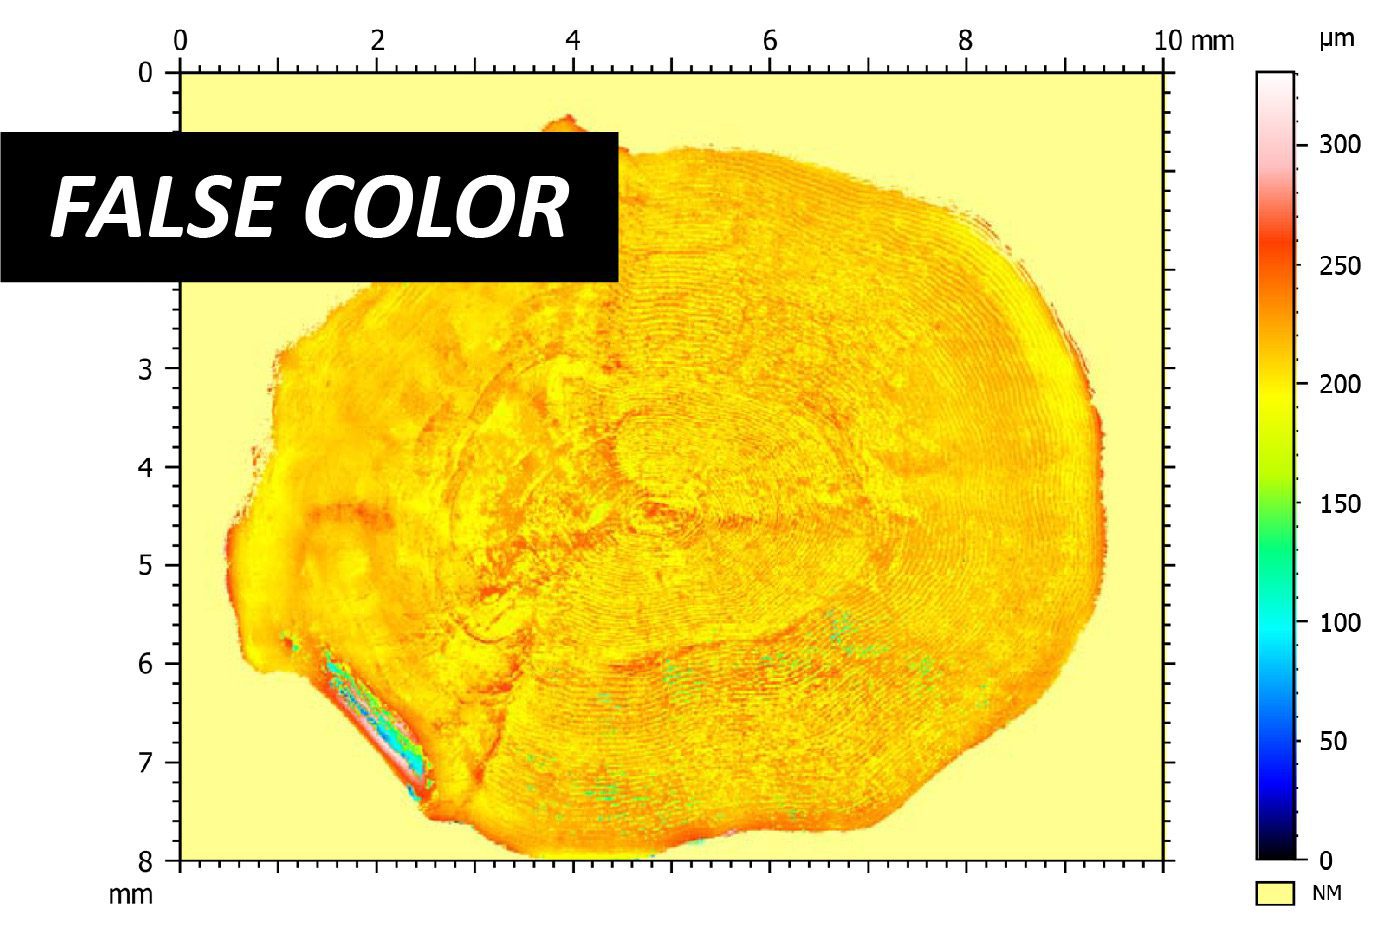
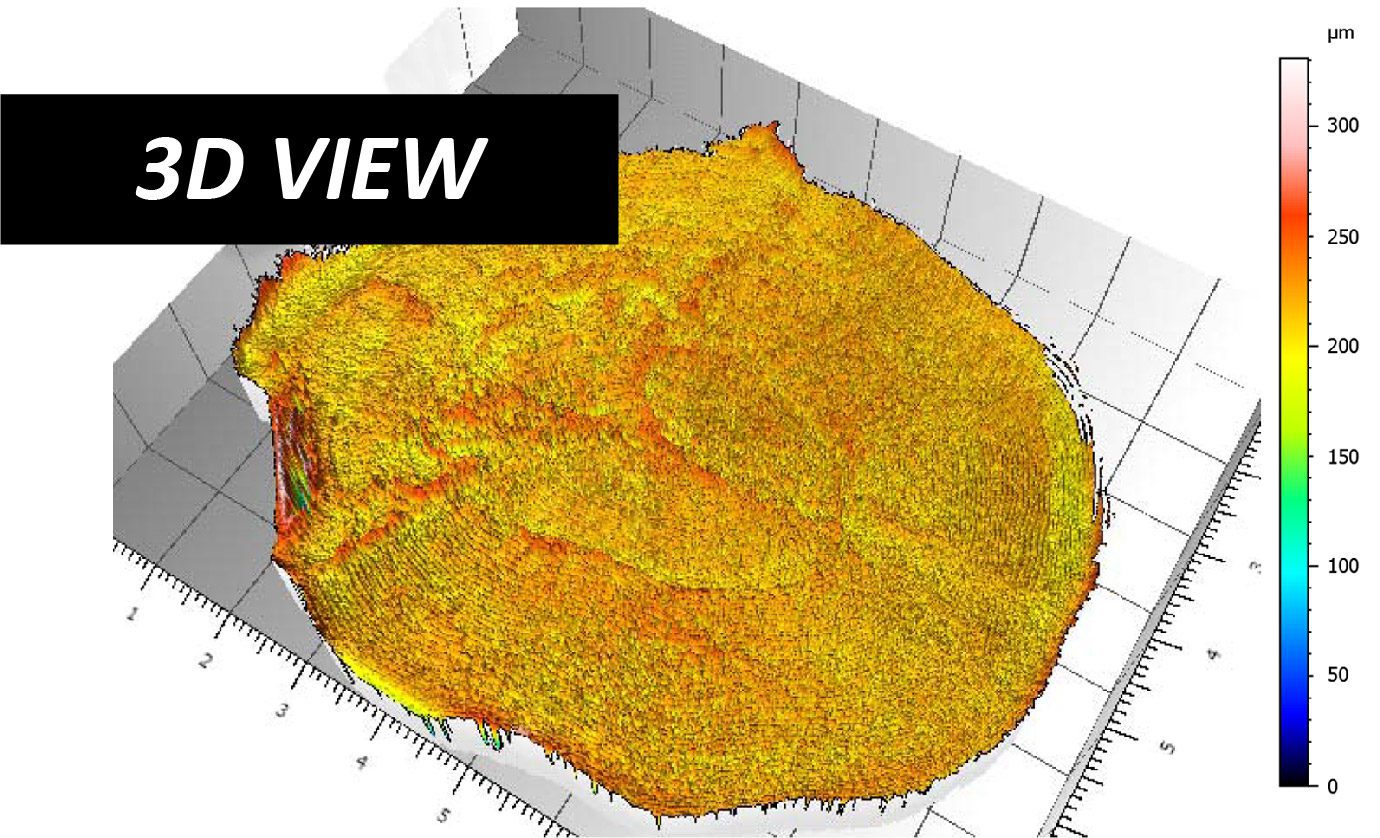
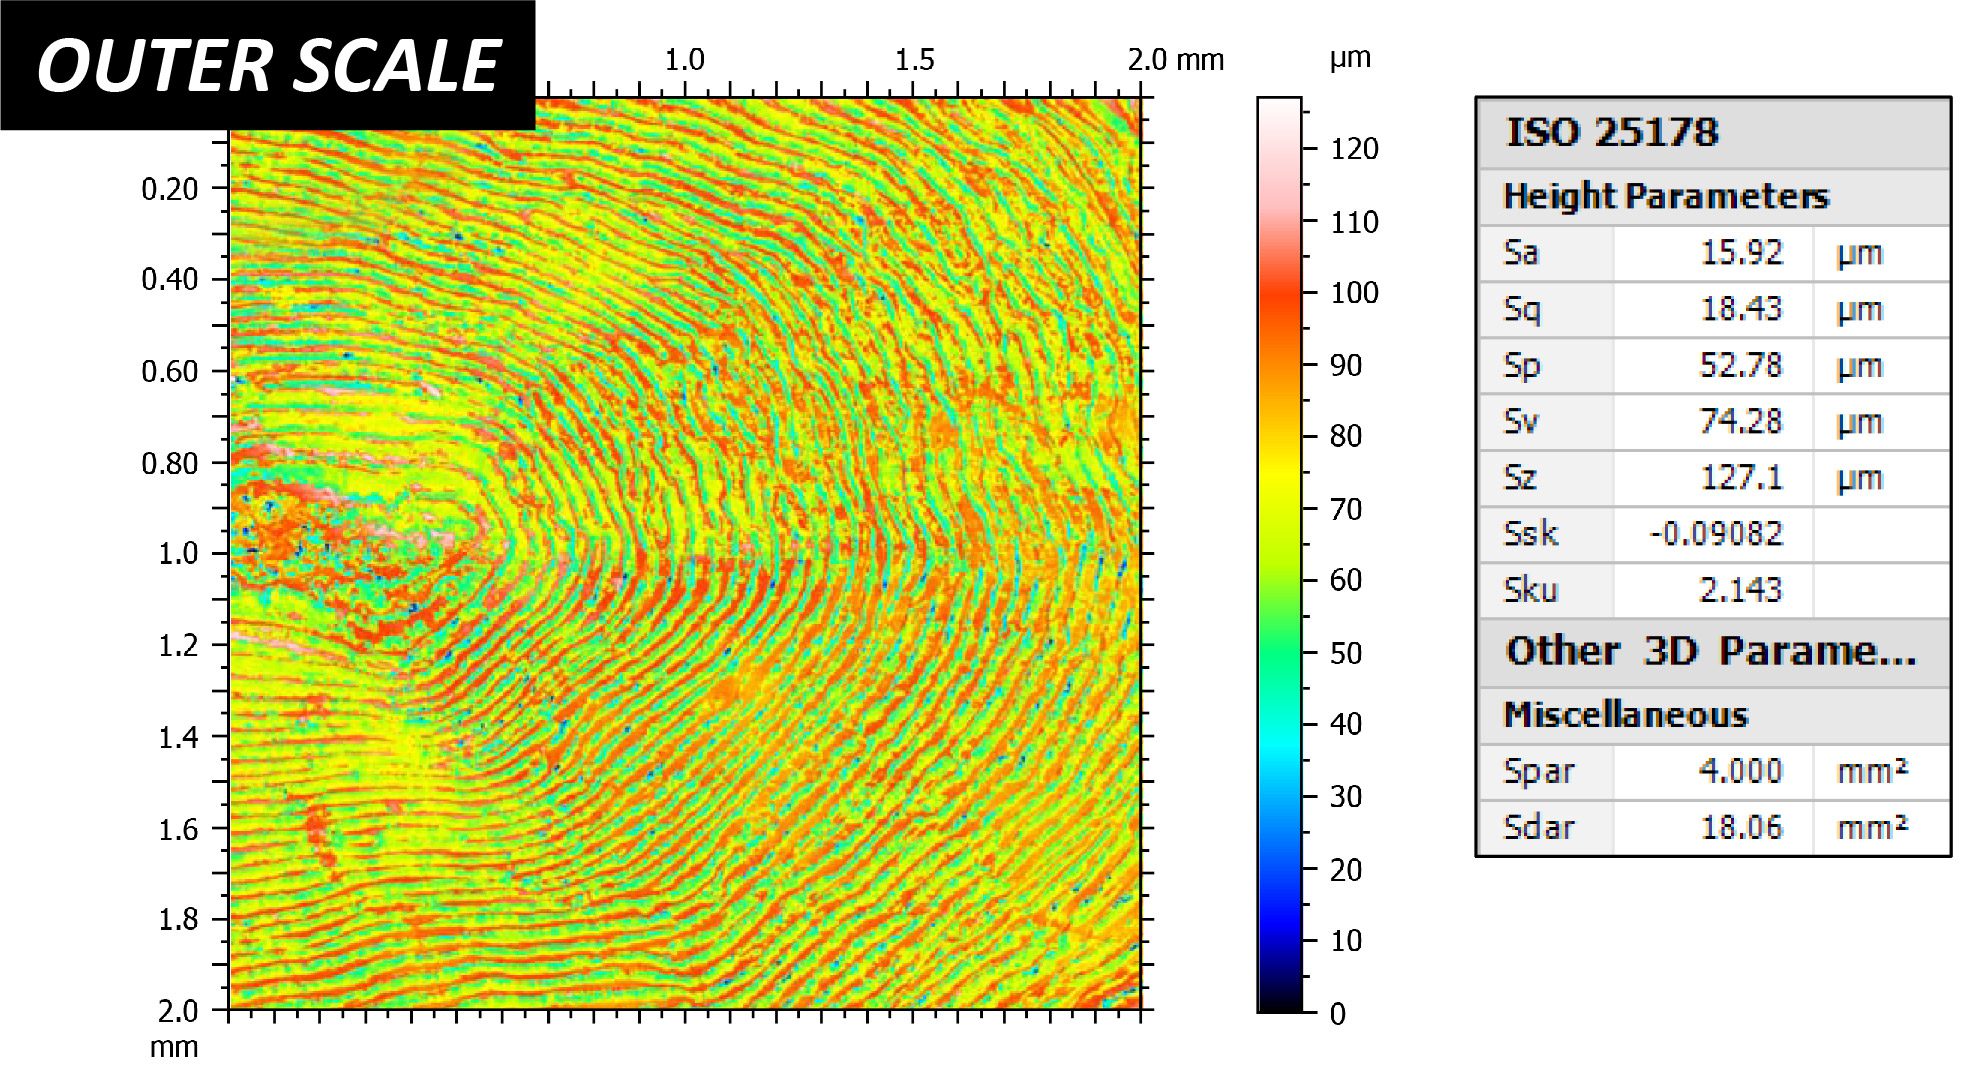
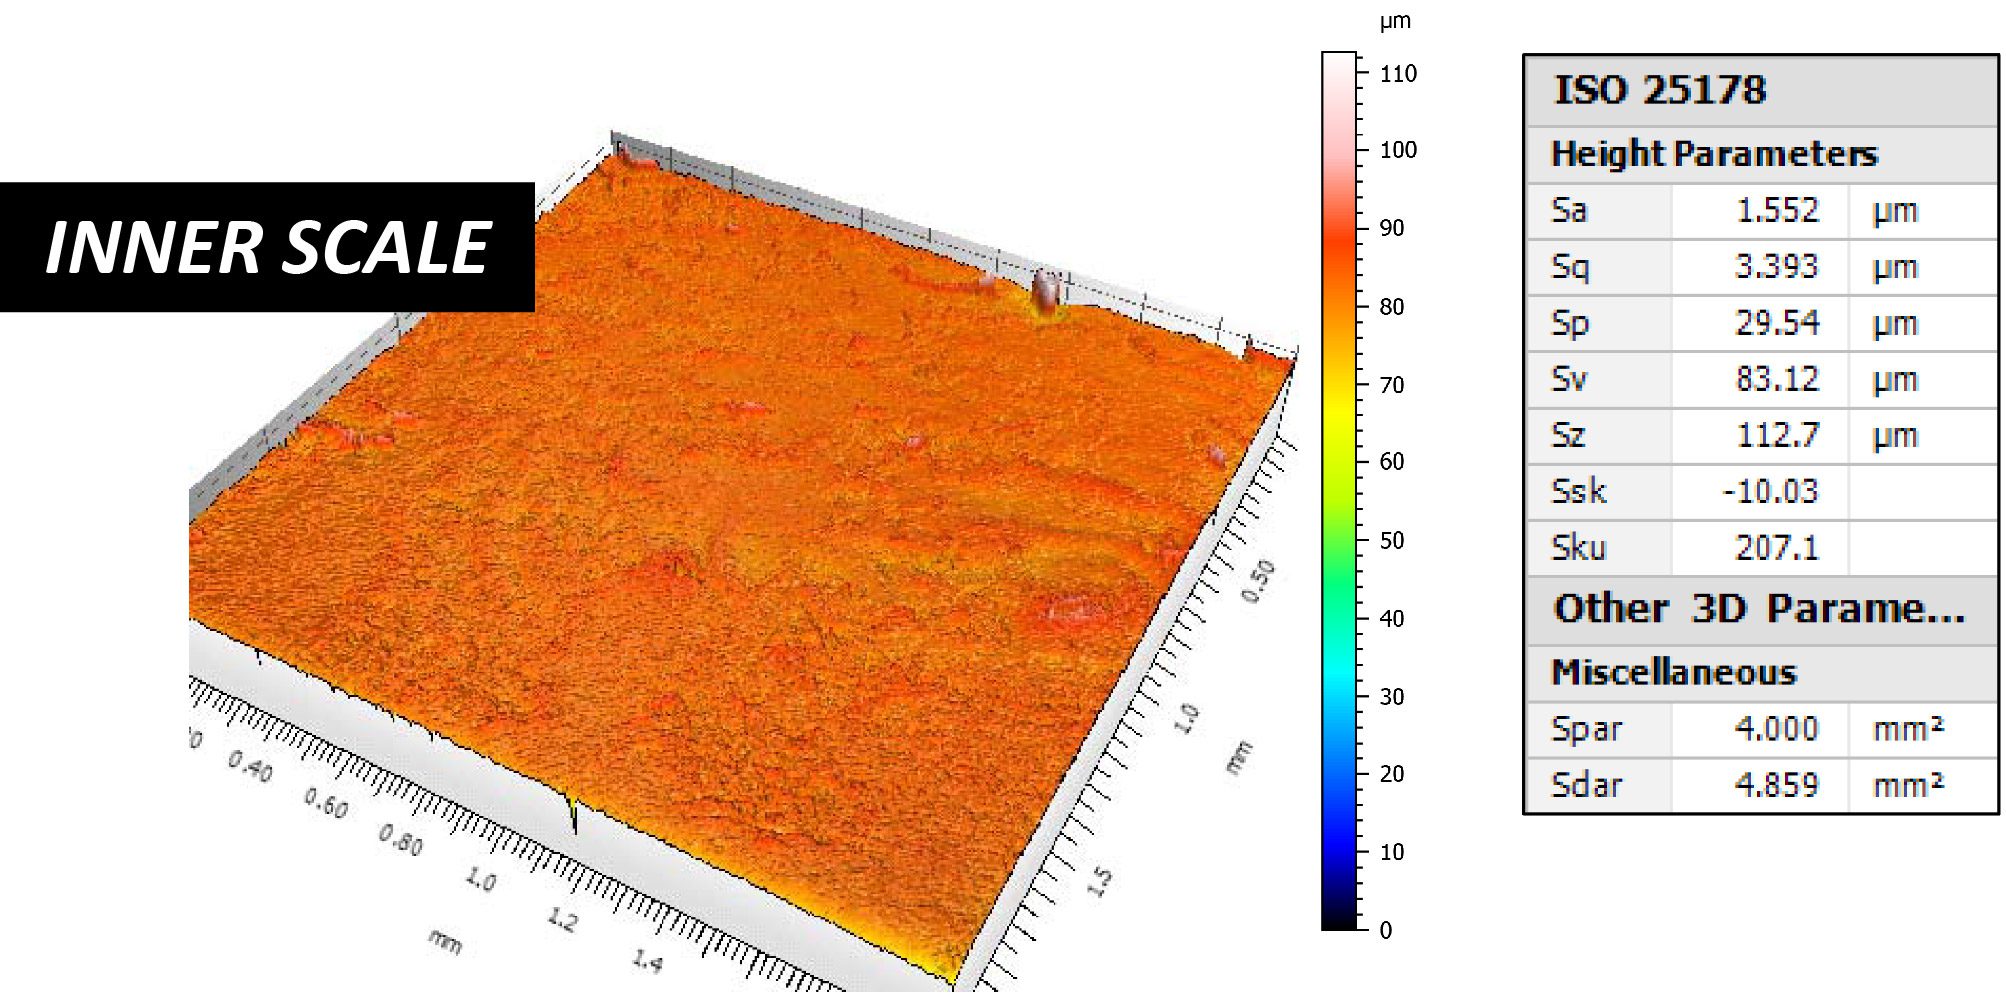
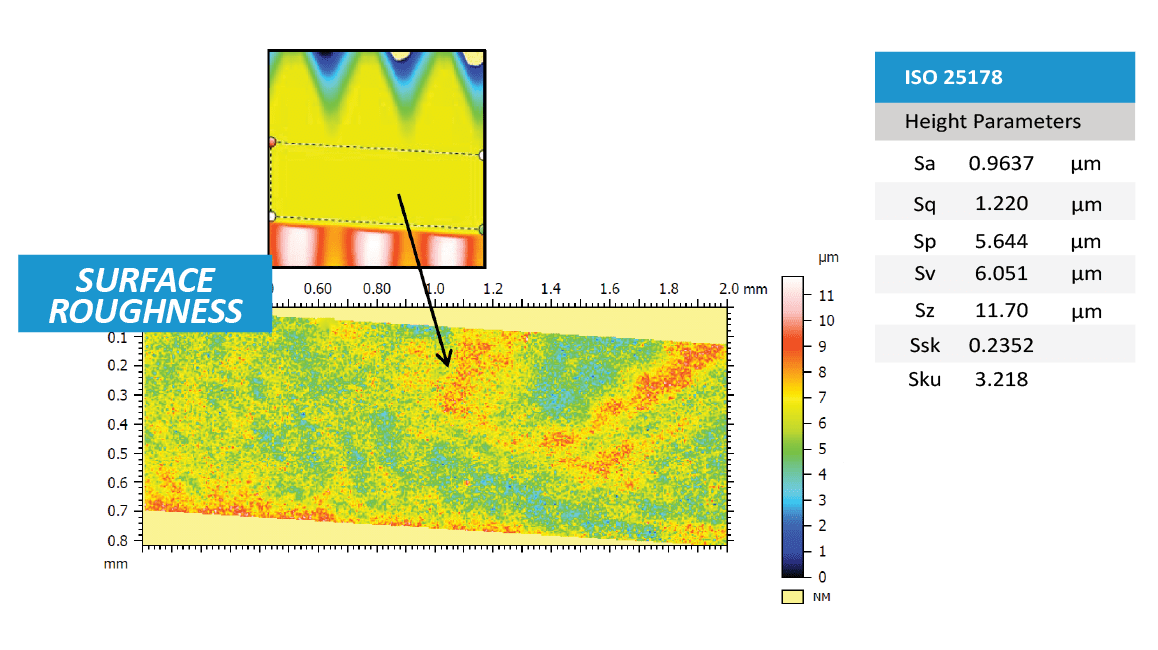
3D Surface
The 3D View and False Color View of the dental screw shows a flat area with threading starting on either side. It provides users a straightforward tool to directly observe the morphology of the screw from different angles. The flat area was extracted from the full scan to measure its surface roughness.


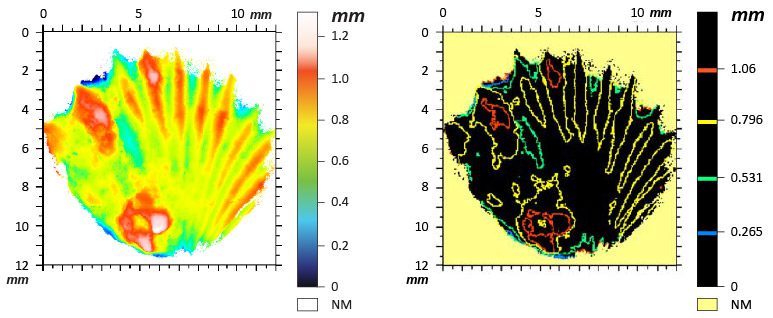
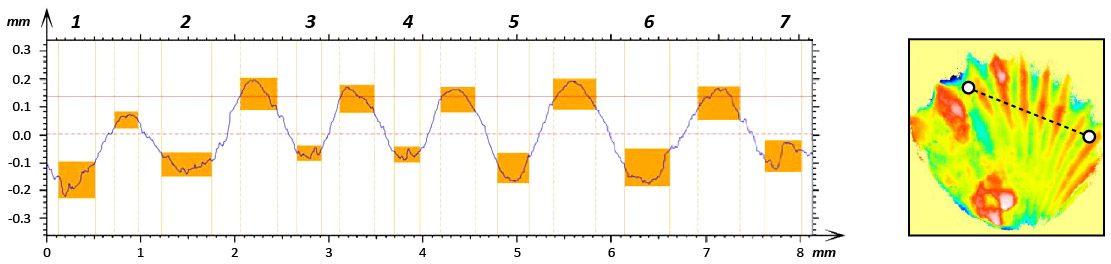
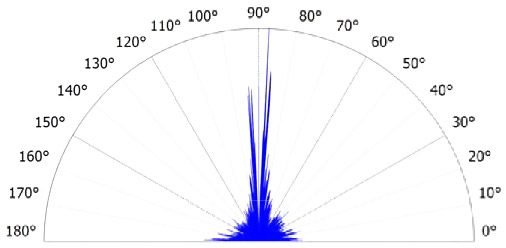
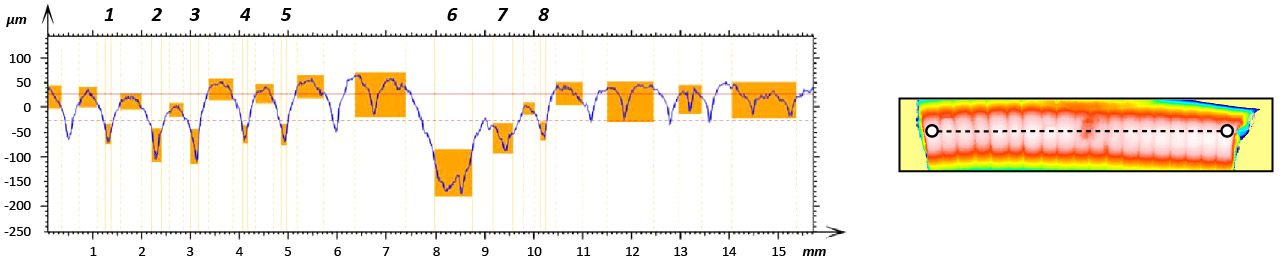
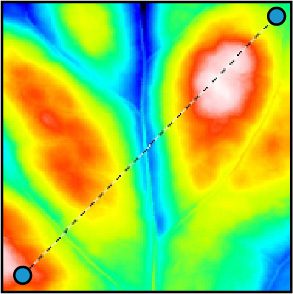
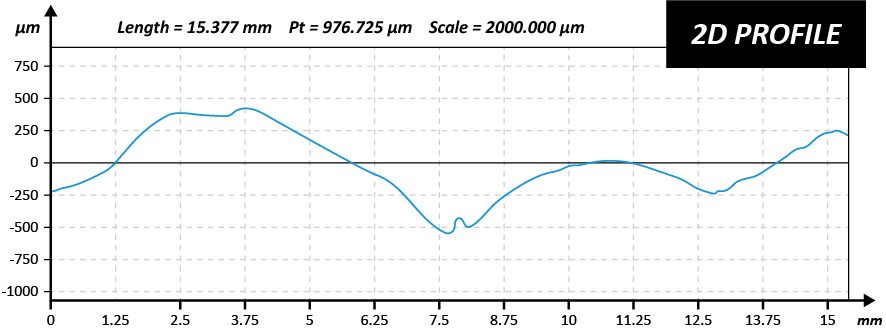
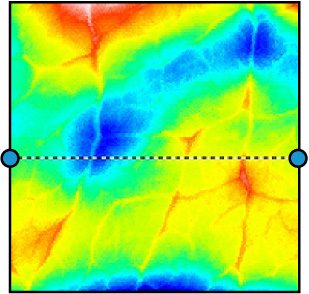
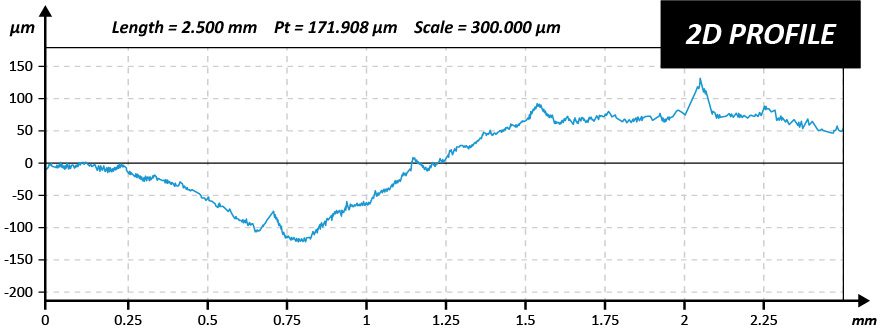
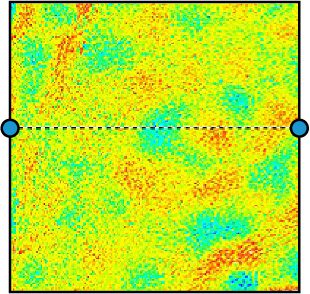
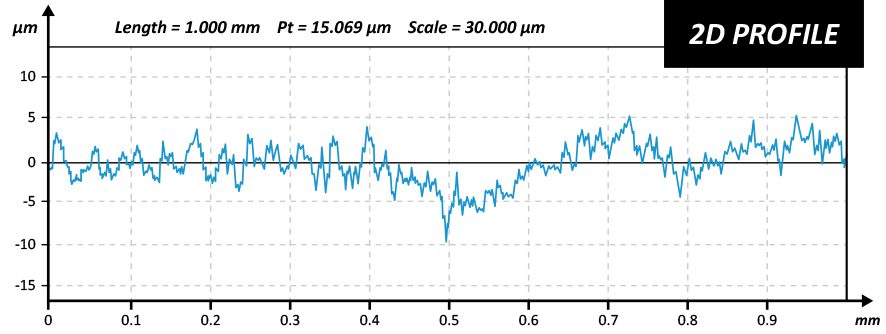
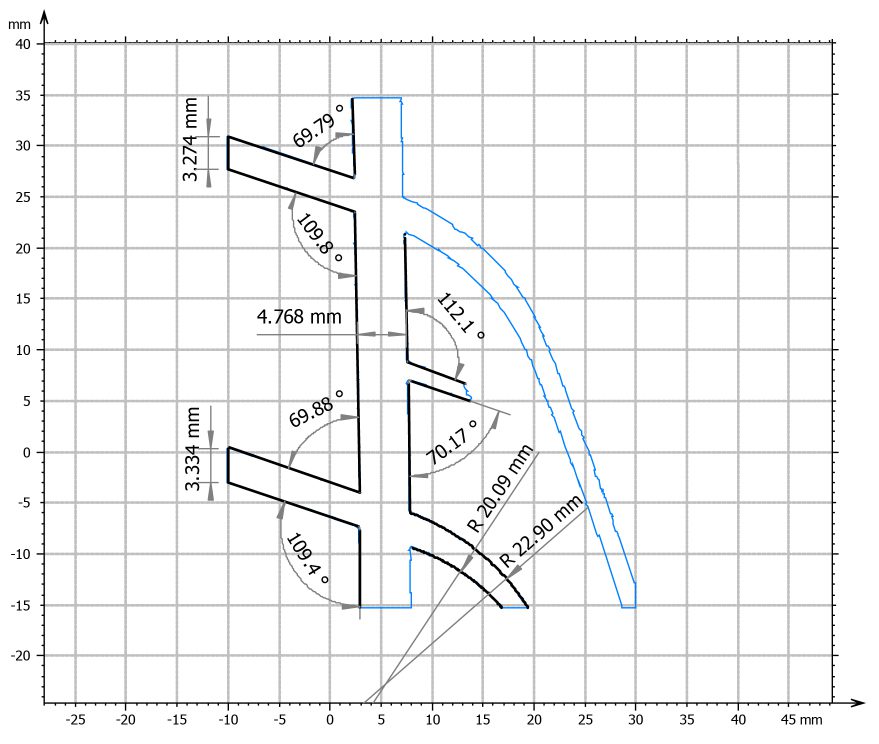
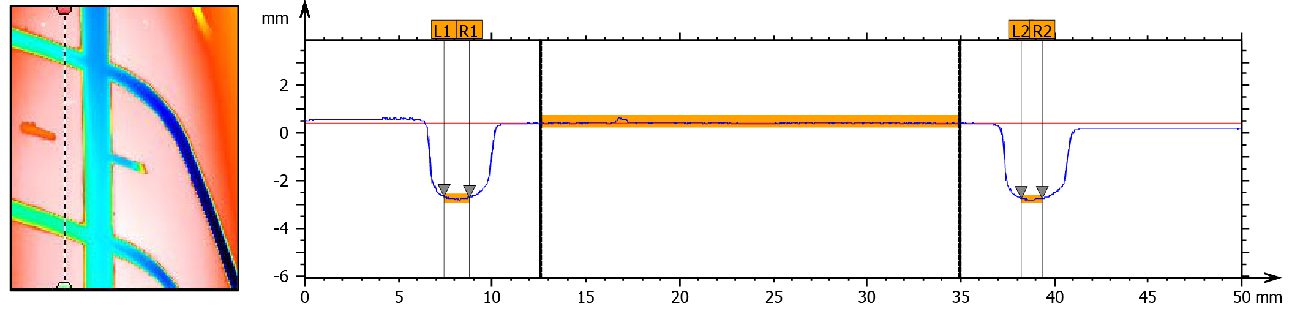
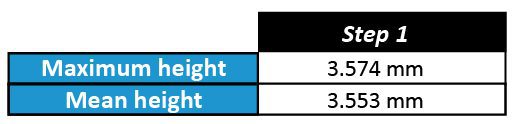
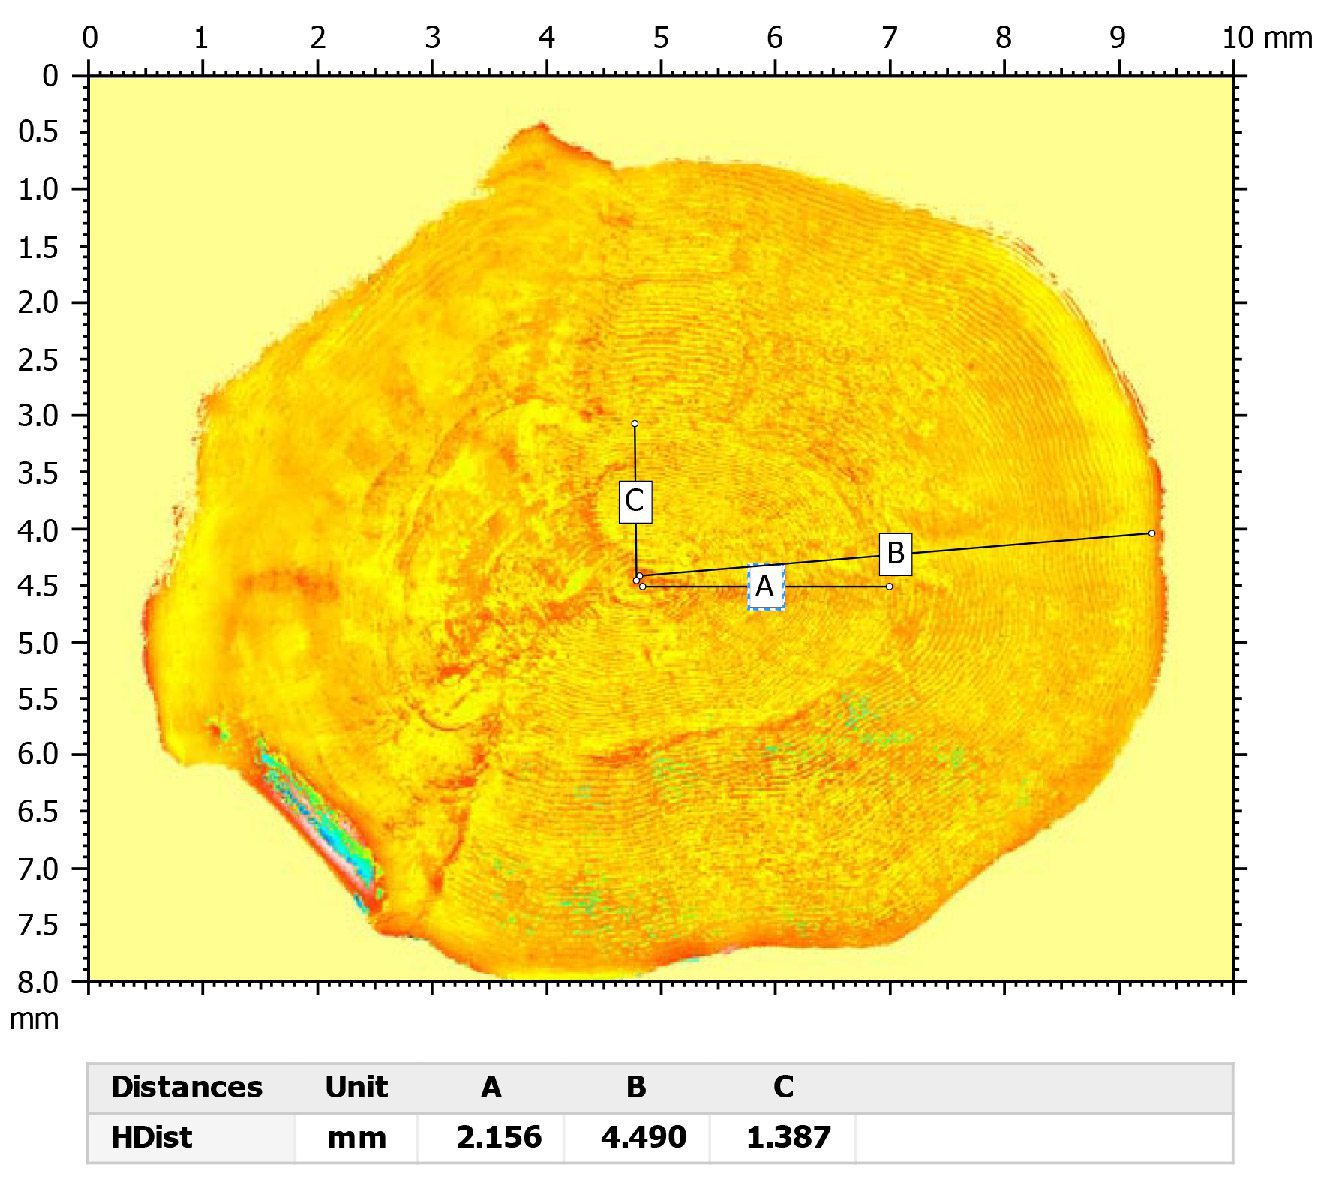
2D Surface Analysis
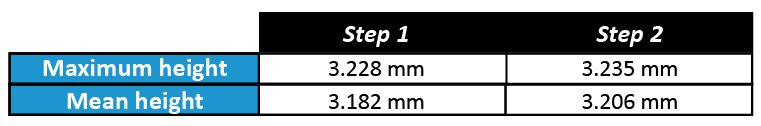
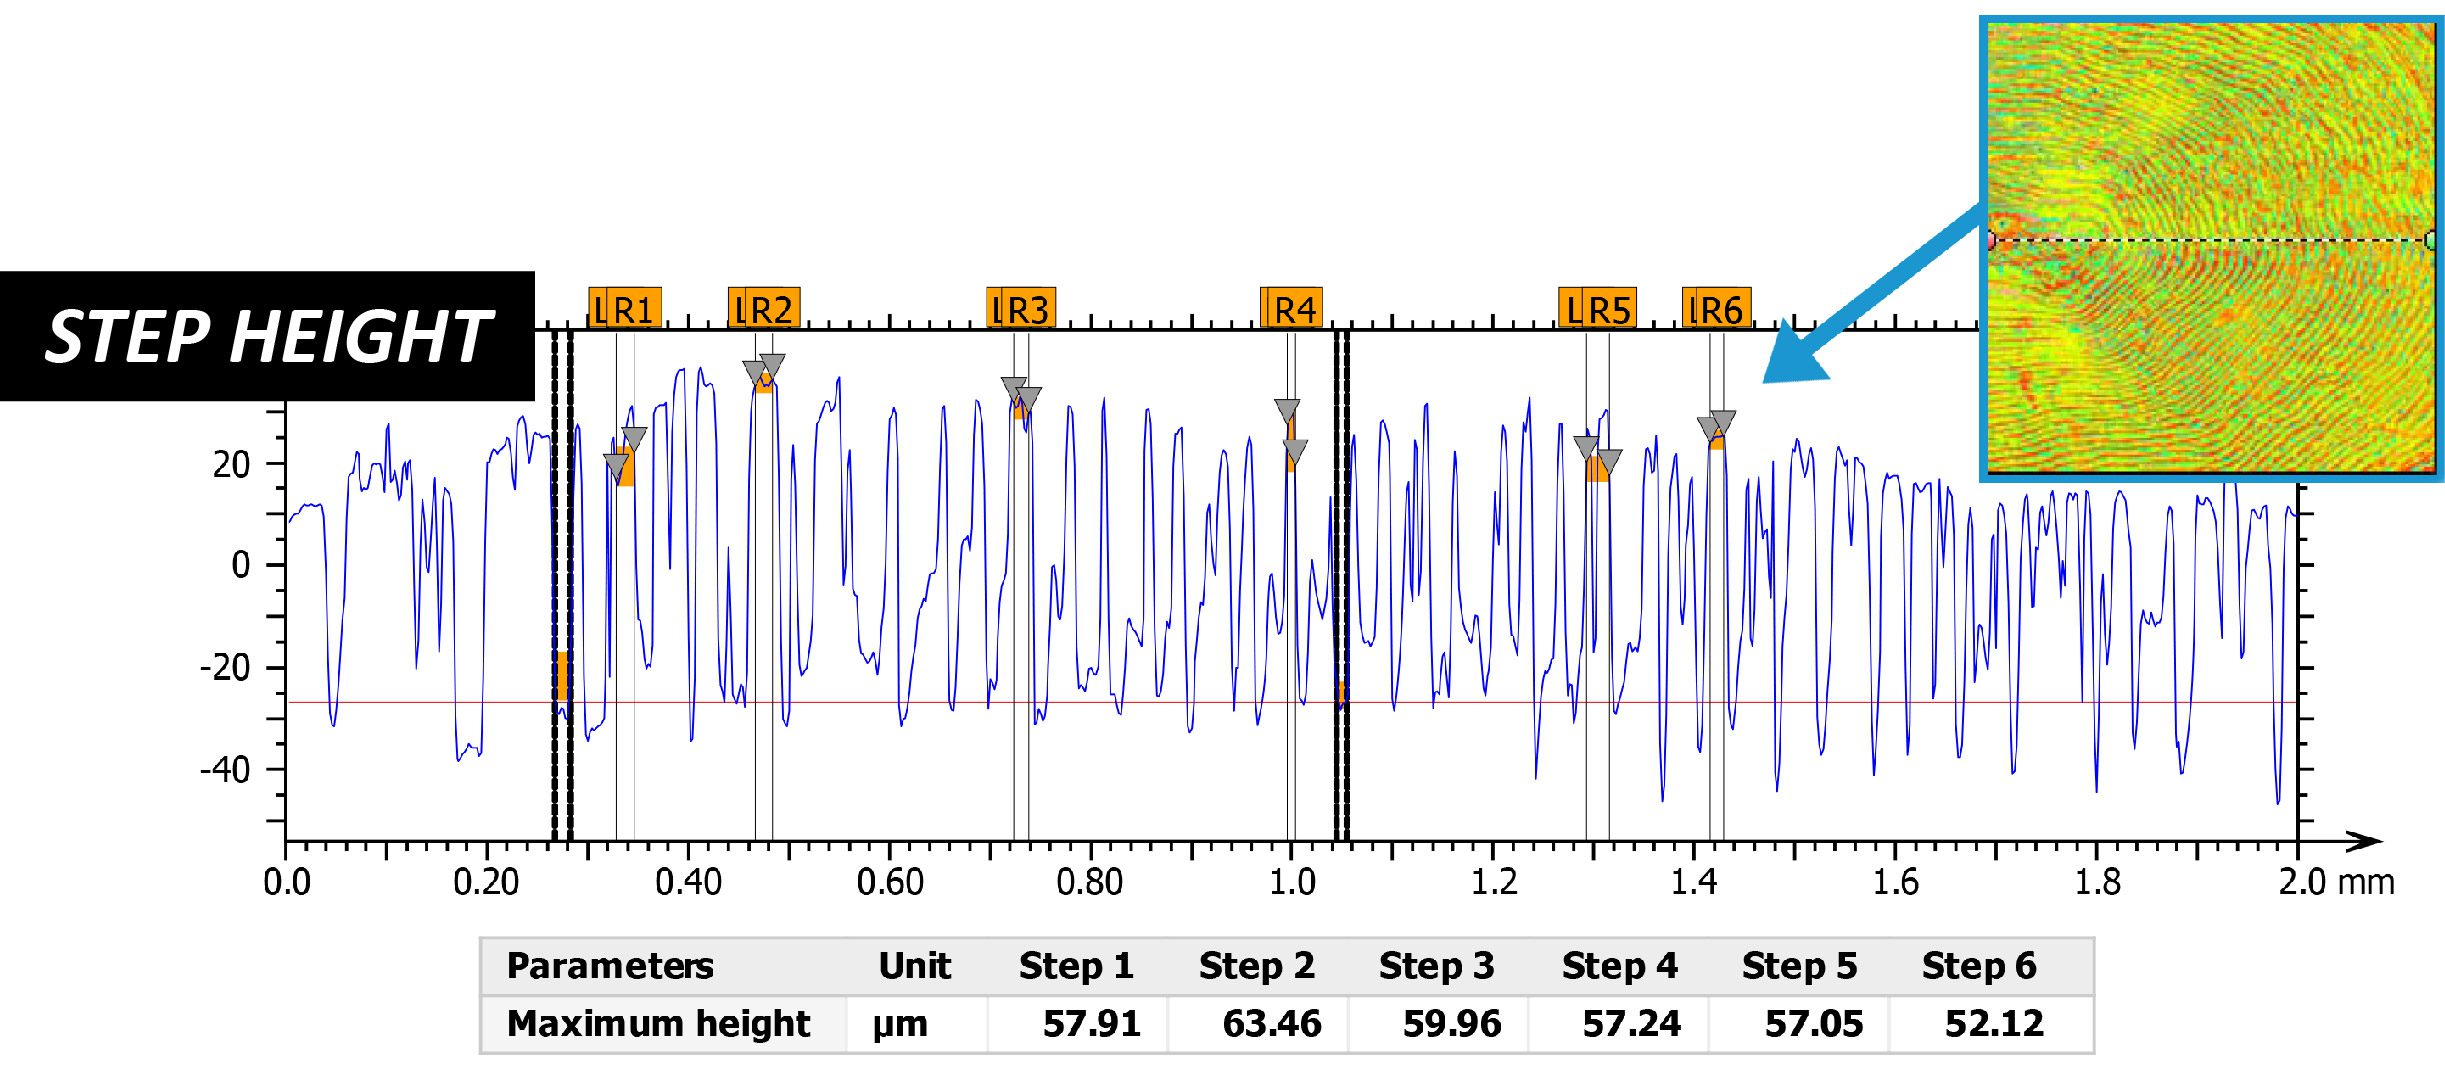
Line profiles can also be extracted from the surface to show a cross-sectional view of the screw. The Contour Analysis and step height studies were used to measure precise dimensions at a certain location on the screw.
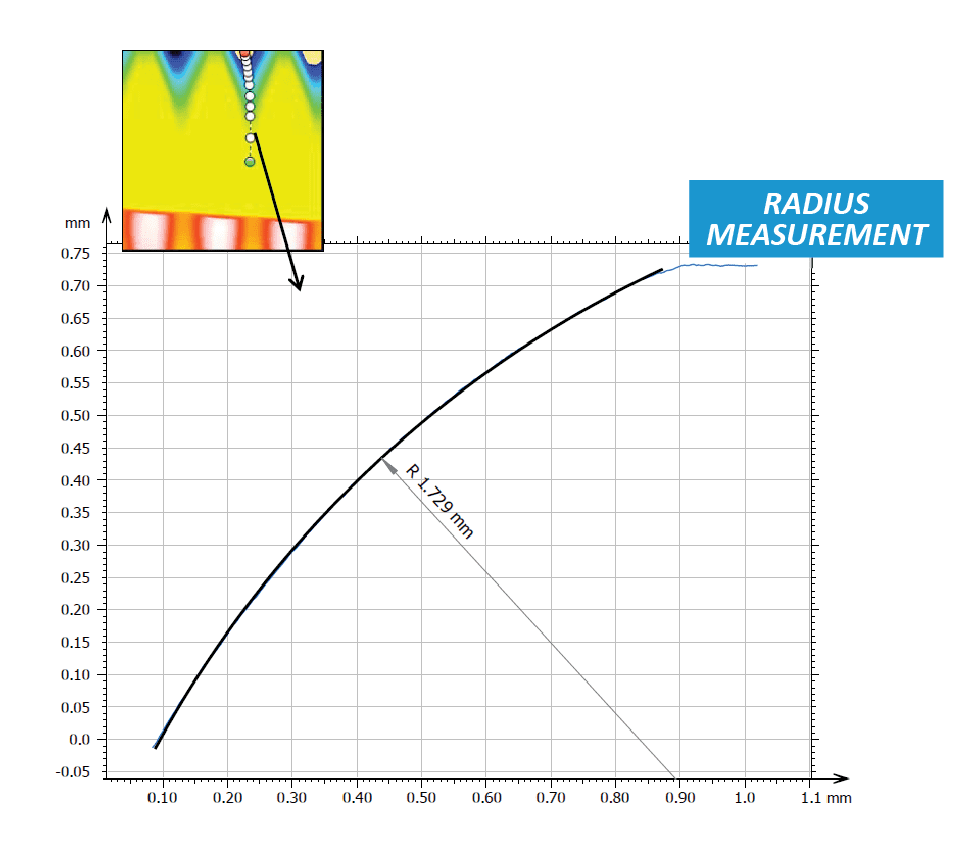

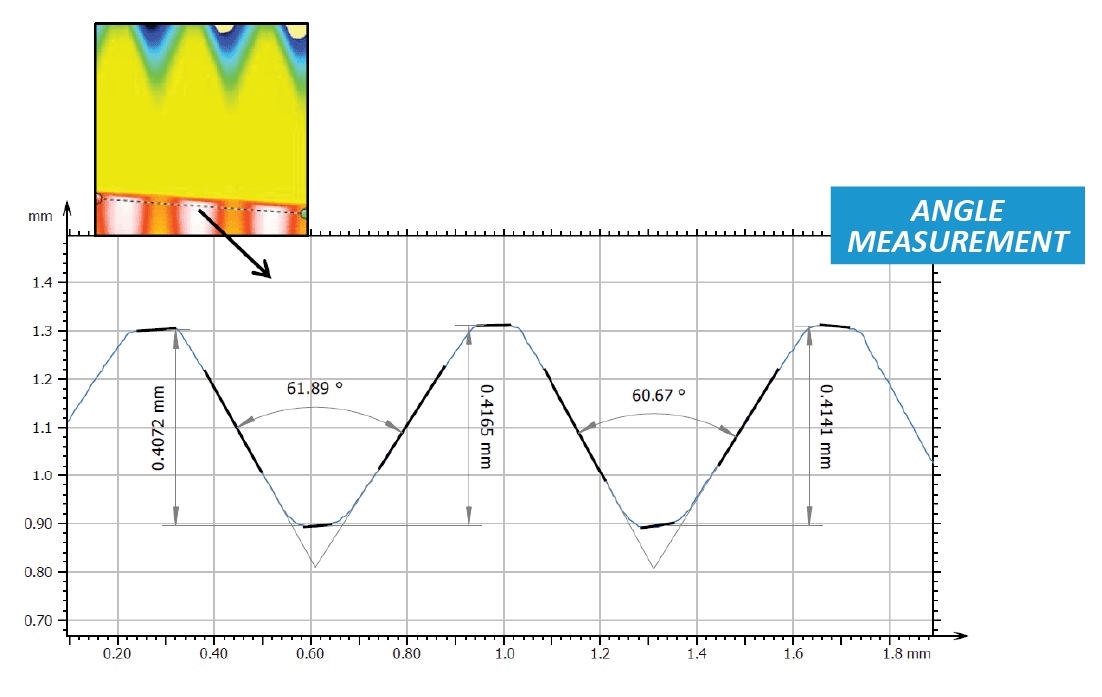

CONCLUSION
In this application, we have showcase the Nanovea 3D Non-Contact Profiler’s ability to precisely calculate local surface roughness and measure large dimensional features in a single scan.
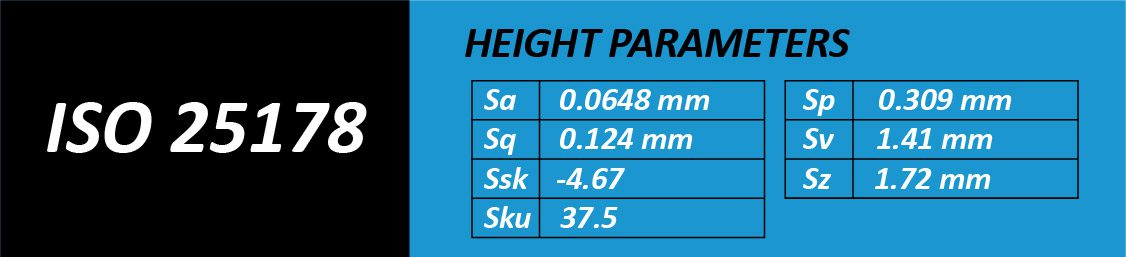
The data shows a local surface roughness of 0.9637 μm. The radius of the screw between threads was found to be 1.729 mm, and the threads had an average height of 0.413 mm. The average angle between the threads was determined to be 61.3°.
The data shown here represents only a portion of the calculations available in the analysis software.
Prepared by
Duanjie Li, PhD., Jonathan Thomas, and Pierre Leroux