
INTRODUCTION
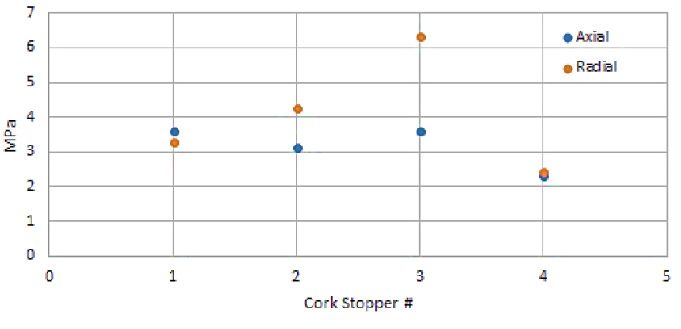
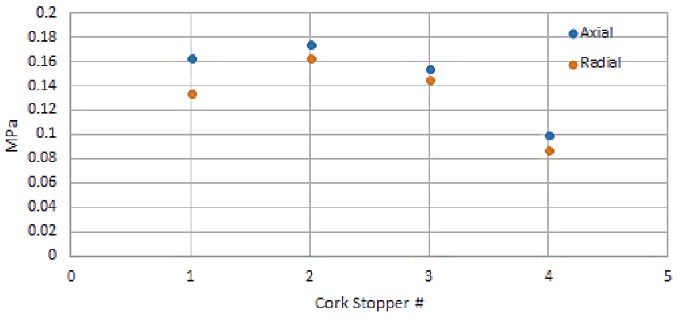
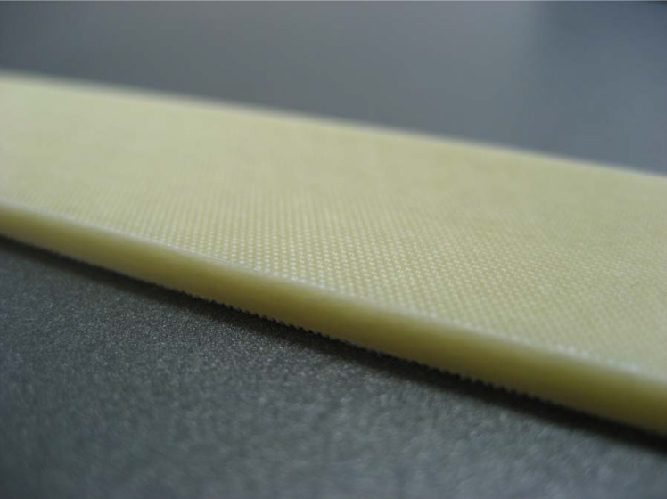
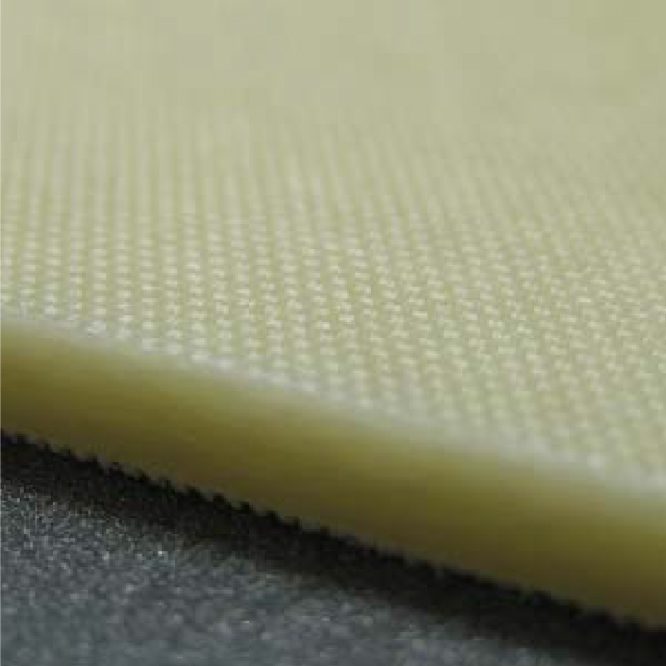
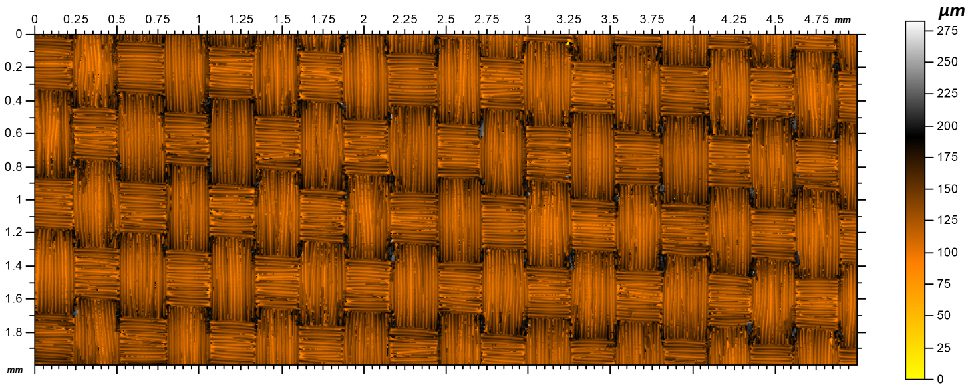
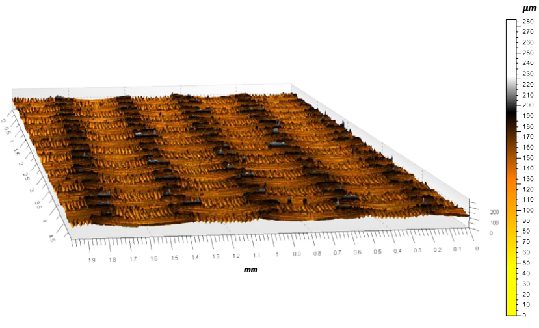
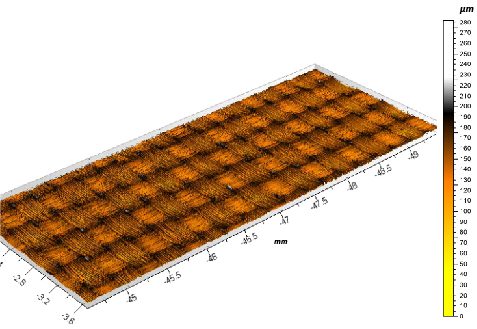
Dynamic Mechanical Analysis (DMA) is a powerful technique used to investigate the mechanical properties of materials. In this application, we focus on the analysis of cork, a widely used material in wine sealing and aging processes. Cork, obtained from the bark of the Quercus suber oak tree, exhibits distinct cellular structures that provide mechanical properties resembling synthetic polymers. In one axis, the cork has honeycomb structure. The two other axes are structured in multiple rectangular-like prisms. This gives cork different mechanical properties depending on the orientation being tested.
IMPORTANCE OF DYNAMIC MECHANICAL ANALYSIS (DMA) TESTING IN ASSESSING CORK MECHANICAL PROPERTIES
The quality of corks greatly relies on their mechanical and physical properties, which are crucial for their effectiveness in wine sealing. Key factors determining cork quality include flexibility, insulation, resilience, and impermeability to gas and liquids. By utilizing dynamic mechanical analysis (DMA) testing, we can quantitatively assess the flexibility and resilience properties of corks, providing a reliable method for evaluation.
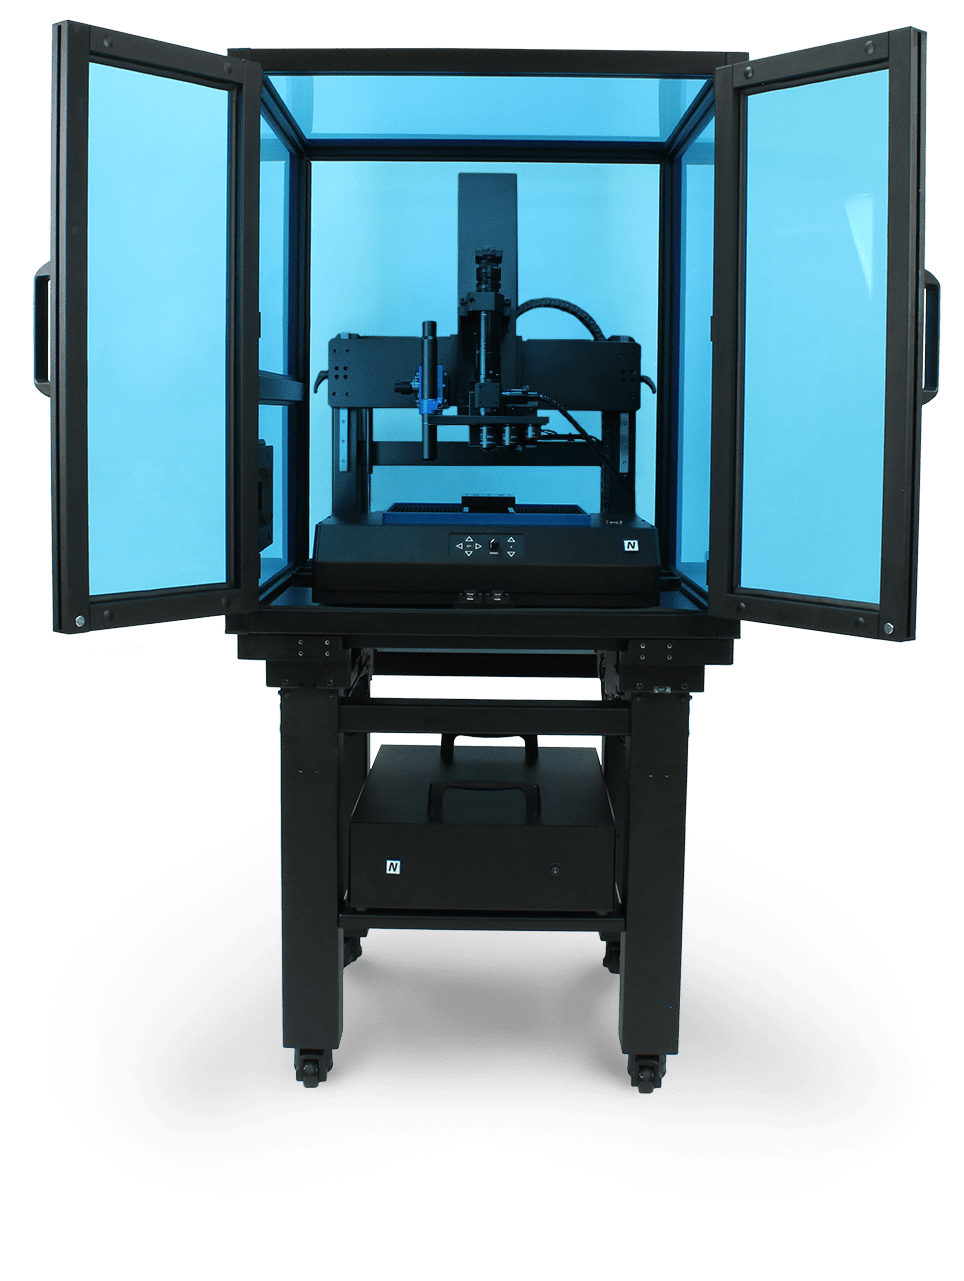
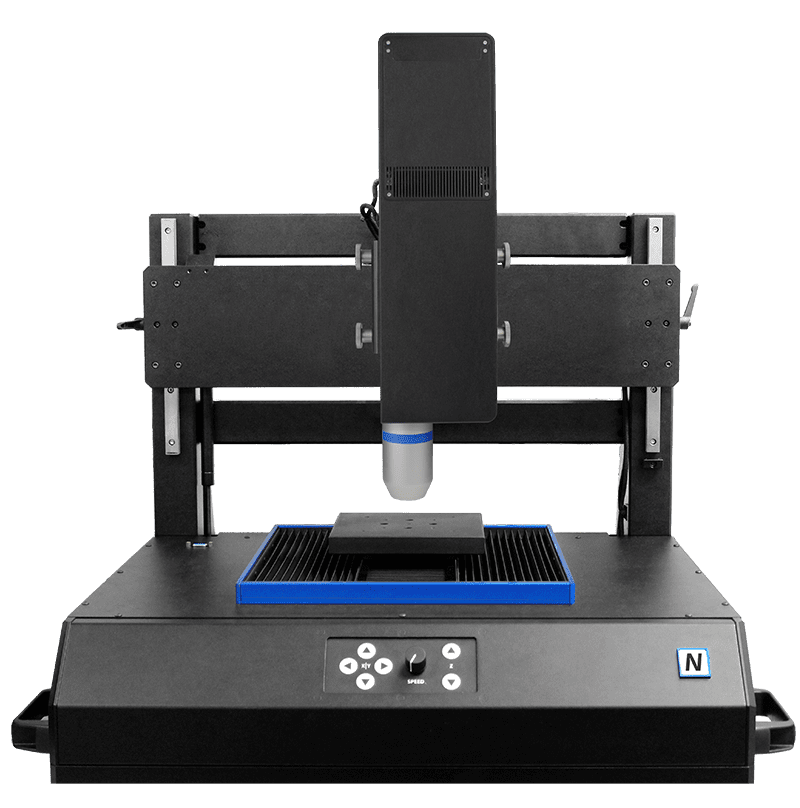
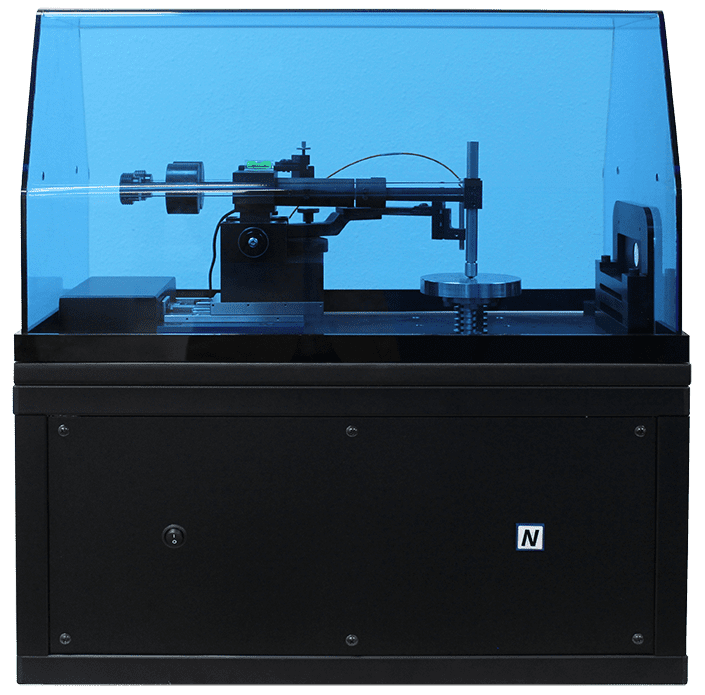
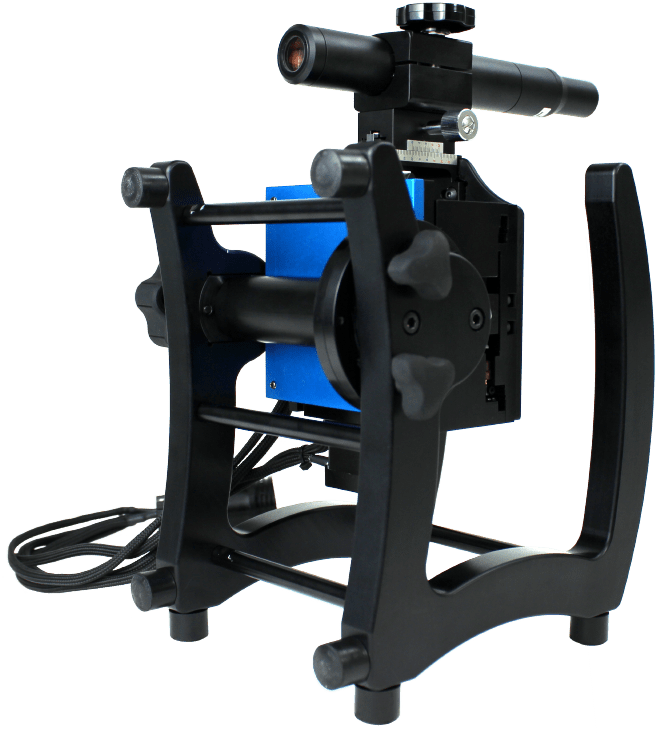
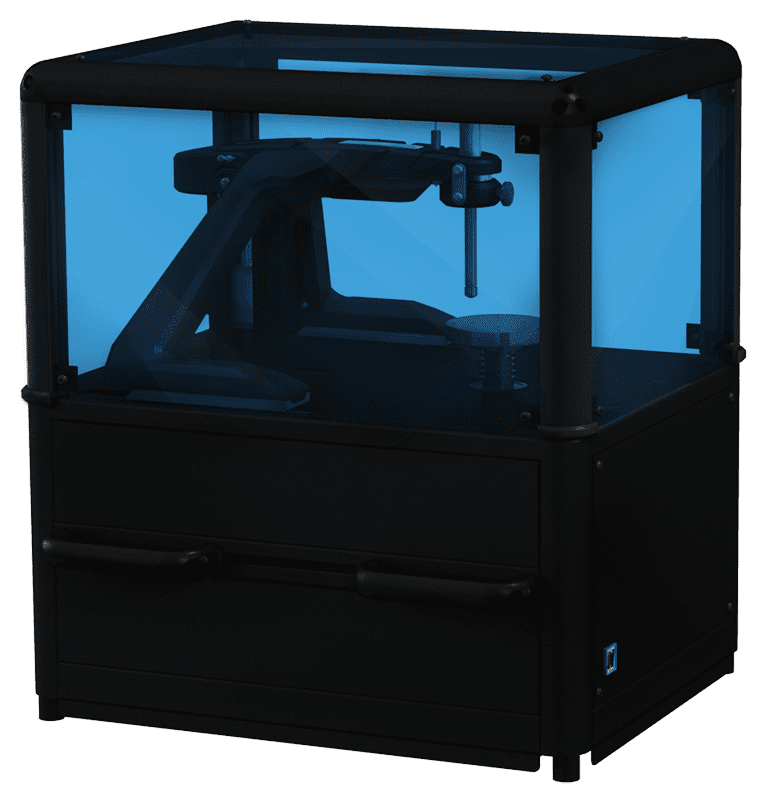
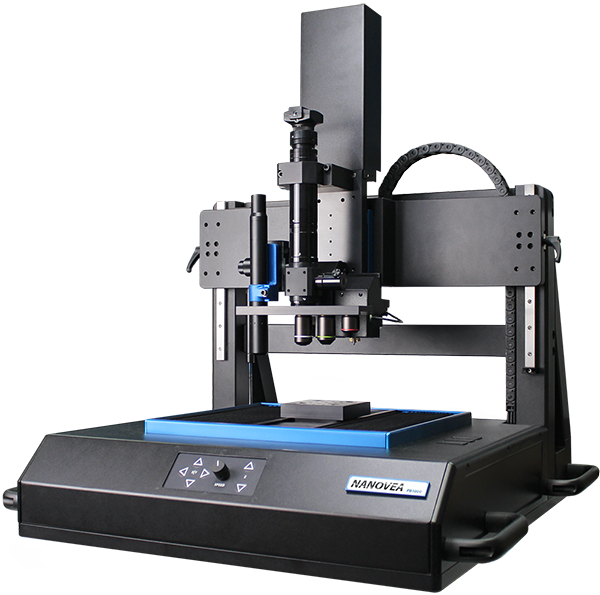
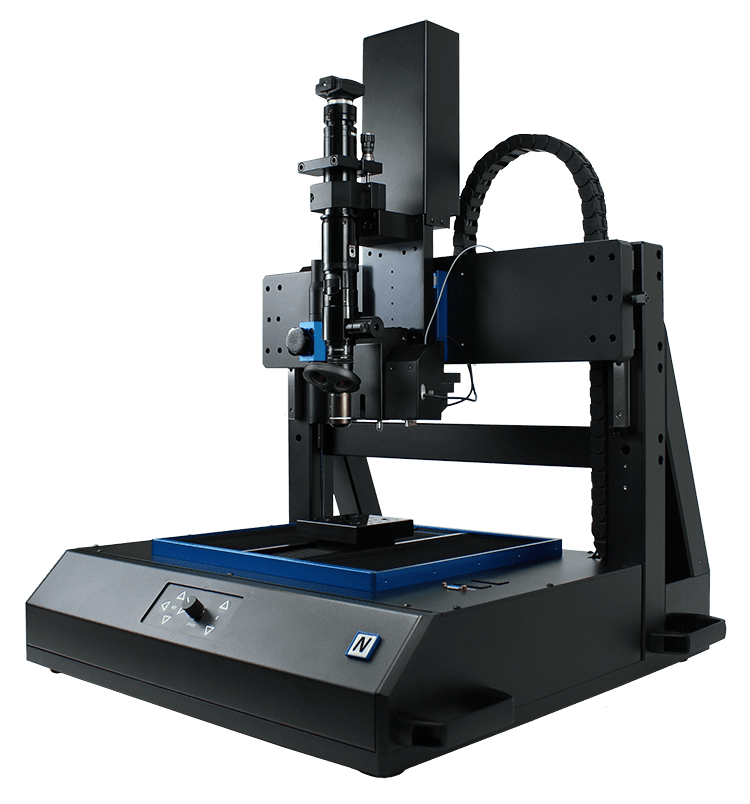
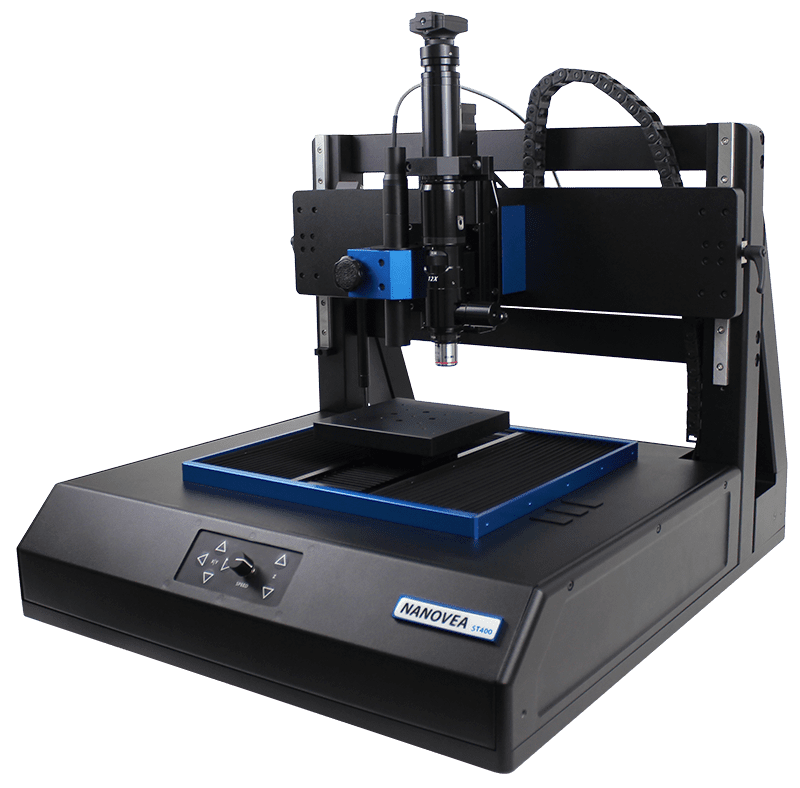
The NANOVEA PB1000 Mechanical Tester in the Nanoindentation mode enables the characterization of these properties, specifically Young’s modulus, storage modulus, loss modulus, and tan delta (tan (δ)). DMA testing also allows for the collection of valuable data on phase shift, hardness, stress, and strain of the cork material. Through these comprehensive analyses, we gain deeper insights into the mechanical behavior of corks and their suitability for wine sealing applications.