EN
EN  ES
ES  DE
DE  FR
FR  IT
IT  ZH
ZH  JA
JA  PT
PT  TR
TR  KO
KO  PL
PL  AR
AR Category: Profilometry | Texture and Grain
Wear and Scratch Evaluation of Surface Treated Copper Wire


Importance of Wear and Scratch Evaluation of Copper Wire
Copper has a long history of use in electric wiring since the invention of the electromagnet and telegraph. Copper wires are applied in a wide range of electronic equipment such as panels, meters, computers, business machines, and appliances thanks to its corrosion resistance, solderability, and performance at elevated temperatures up to 150°C. Approximately half of all mined copper is used for manufacturing electrical wire and cable conductors.
Copper wire surface quality is critical to application service performance and lifetime. Micro defects in wires may lead to excessive wear, crack initiation and propagation, decreased conductivity, and inadequate solderability. Proper surface treatment of copper wires removes surface defects generated during wire drawing improving corrosion, scratch, and wear resistance. Many aerospace applications with copper wires require controlled behavior to prevent unexpected equipment failure. Quantifiable and reliable measurements are needed to properly evaluate the wear and scratch resistance of the copper wire surface.
Measurement Objective
In this application we simulate a controlled wear process of different copper wire surface treatments. Scratch testing measures the load required to cause failure on the treated surface layer. This study showcases the Nanovea Tribometer and Mechanical Tester as ideal tools for evaluation and quality control of electric wires.
Test Procedure and Procedures
Coefficient of friction (COF) and wear resistance of two different surface treatments on copper wires (Wire A and Wire B) were evaluated by the Nanovea tribometer using a linear reciprocating wear module. An Al₂O₃ ball (6 mm diameter) is the counter material used in this application. The wear track was examined using Nanovea’s 3D non-contact profilometer. Test parameters are summarized in Table 1.
A smooth Al₂O₃ ball as a counter material was used as an example in this study. Any solid material with different shape and surface finish can be applied using a custom fixture to simulate the actual application situation.

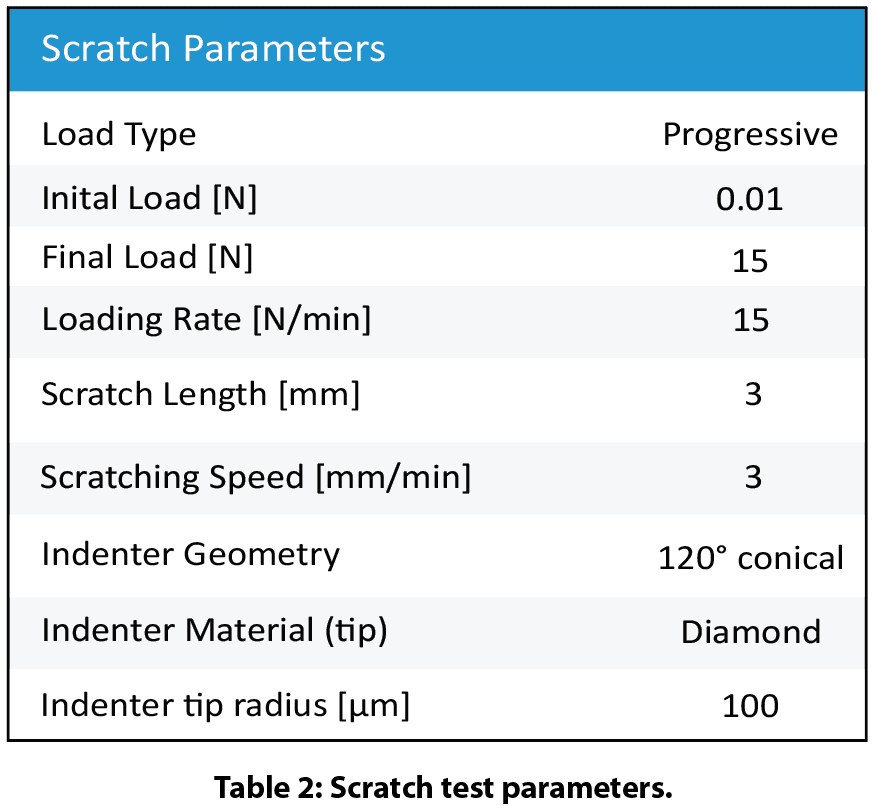
Nanovea’s mechanical tester equipped with a Rockwell C diamond stylus (100 μm radius) performed progressive load scratch tests on the coated wires using micro scratch mode. Scratch test parameters and tip geometry are shown in Table 2.
Results and Discussion
Wear of copper wire:
Figure 2 shows COF evolution of the copper wires during wear tests. Wire A shows a stable COF of ~0.4 throughout the wear test while wire B exhibits a COF of ~0.35 in the first 100 revolutions and progressively increases to ~0.4.
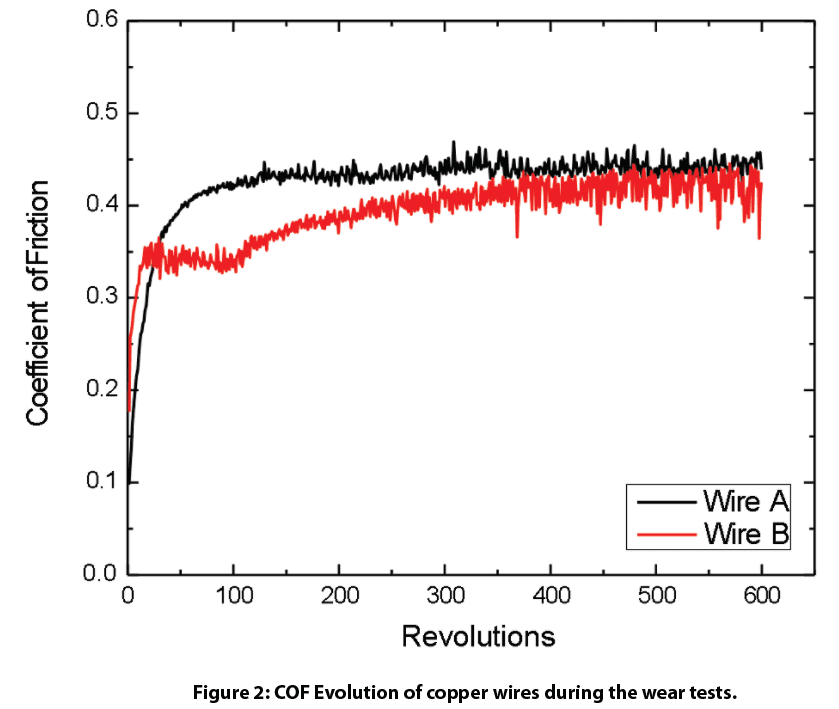
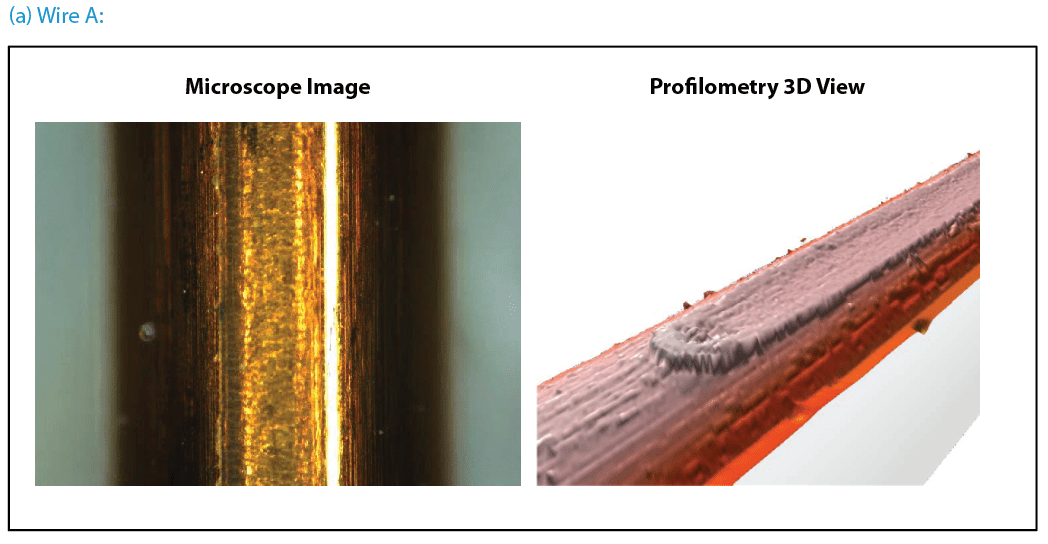
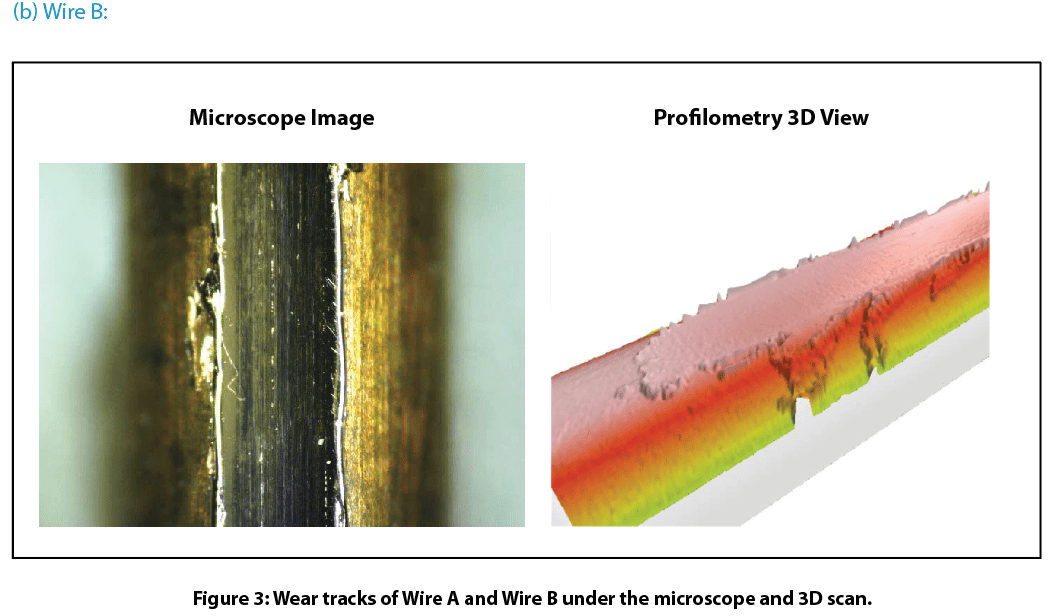
Figure 3 compares wear tracks of the copper wires after tests. Nanovea’s 3D non-contact profilometer offered superior analysis of the detailed morphology of wear tracks. It allows direct and accurate determination of the wear track volume by providing a fundamental understanding of the wear mechanism. Wire B’s surface has signi¬ficant wear track damage after a 600-revolution wear test. The profilometer 3D view shows the surface treated layer of Wire B removed completely which substantially accelerated the wear process. This left a flattened wear track on Wire B where copper substrate is exposed. This may result in significantly shortened lifespan of electrical equipment where Wire B is used. In comparison, Wire A exhibits relatively mild wear shown by a shallow wear track on the surface. The surface treated layer on Wire A did not remove like the layer on Wire B under the same conditions.
Scratch resistance of the copper wire surface:
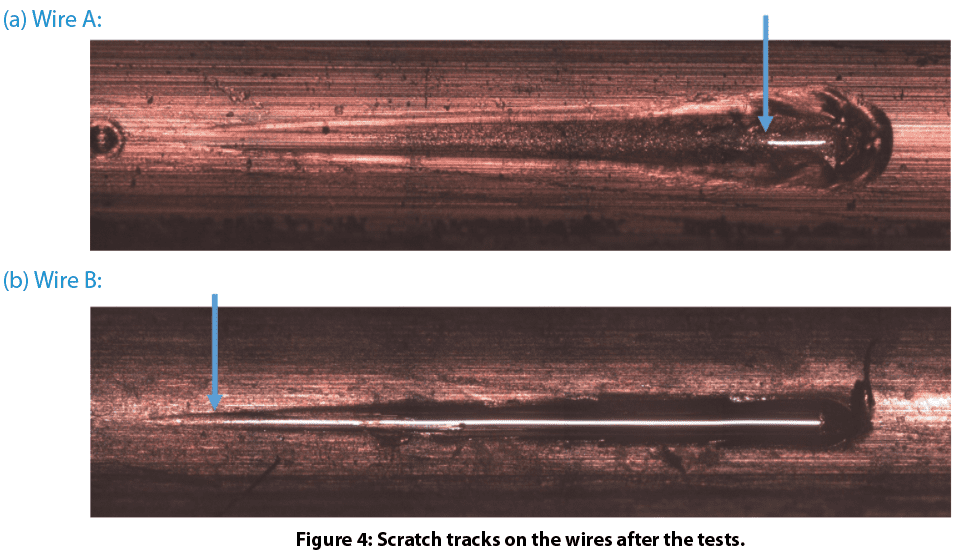
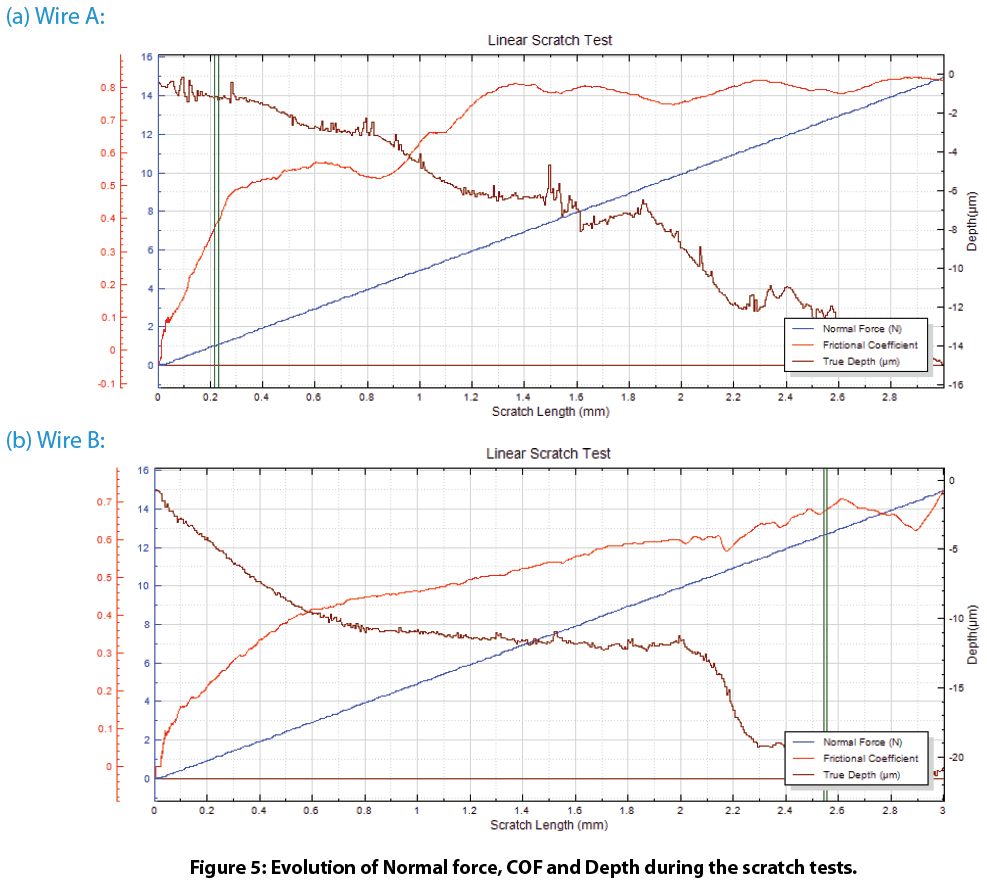
Figure 4 shows the scratch tracks on the wires after testing. The protective layer of Wire A exhibits very good scratch resistance. It delaminates at a load of ~12.6 N. In comparison, the protective layer of Wire B failed at a load of ~1.0 N. Such a significant difference in scratch resistance for these wires contributes to their wear performance, where Wire A possesses substantially enhanced wear resistance. The evolution of normal force, COF, and depth during the scratch tests shown in Fig. 5 provides more insight on coating failure during tests.
Conclusion

In this controlled study we showcased the Nanovea’s tribometer conducting quantitative evaluation of wear resistance for surface treated copper wires and Nanovea’s mechanical tester providing reliable assessment of copper wire scratch resistance. Wire surface treatment plays a critical role in the tribo-mechanical properties during their lifetime. Proper surface treatment on Wire A significantly enhanced wear and scratch resistance, critical in the performance and lifespan of electrical wires in rough environments.
Nanovea’s tribometer offers precise and repeatable wear and friction testing using ISO and ASTM compliant rotative and linear modes, with optional high temperature wear, lubrication, and tribo-corrosion modules available in one pre-integrated system. Nanovea’s unmatched range is an ideal solution for determining the full range of tribological properties of thin or thick, soft or hard coatings, films, and substrates.

Paint Orange Peel Texture Analysis using 3D Profilometry
Introduction
The size and frequency of surface structures on substrates affect the quality of gloss coatings. Paint orange peel texture, named after its appearance, can develop from substrate influence and paint application technique. Texture problems are commonly quantified by waviness, wavelength, and the visual effect they have on gloss coatings. The smallest textures result in gloss reduction while larger textures result in visible ripples on the coated surface. Understanding the development of these textures and its relation to substrates and techniques are critical to quality control.
Importance of Profilometry for Texture Measurement
Unlike traditional 2D instruments used to measure gloss texture, 3D non-contact measurement quickly provides a 3D image used to understand surface characteristics with the added ability to quickly investigate areas of interest. Without speed and 3D review, a quality control environment would solely rely on 2D information that gives little predictability of the entire surface. Understanding textures in 3D allows for the best selection of processing and control measures. Assuring quality control of such parameters heavily relies on quantifiable, reproducible, and reliable inspection. Nanovea 3D Non-Contact Profilometers utilize chromatic confocal technology to have the unique capability to measure the steep angles found during fast measurement. Nanovea Profilometers succeed where other techniques fail to provide reliable data due to probe contact, surface variation, angle, or reflectivity.
Measurement Objective
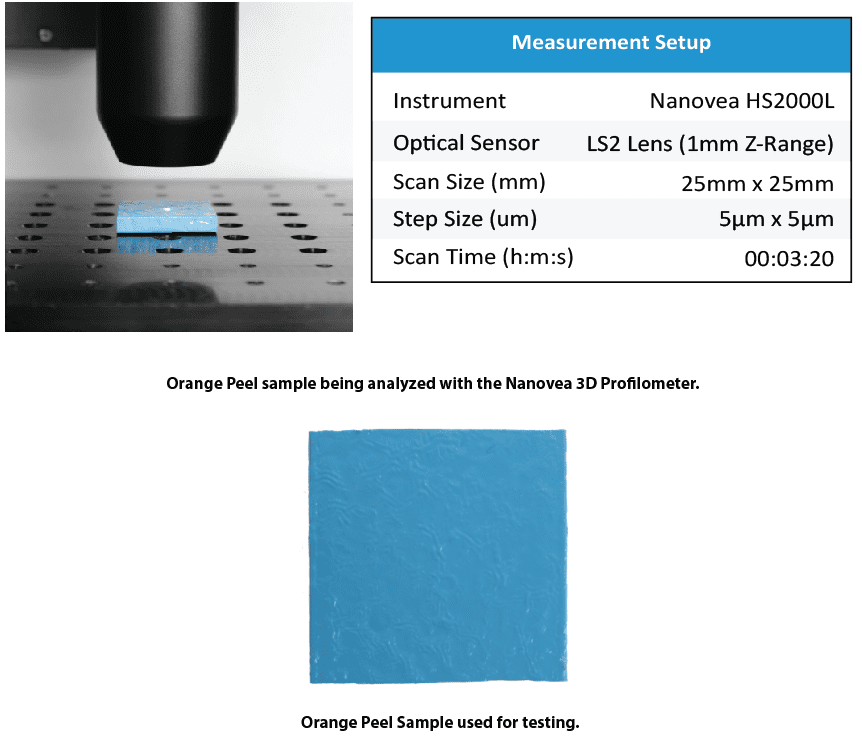
In this application, the Nanovea HS2000L measures the paint orange peel texture of a gloss paint. There are endless surface parameters automatically calculated from the 3D surface scan. Here we analyze a scanned 3D surface by quantifying the characteristics of the paint orange peel texture.
Results and Discussion

The Nanovea HS2000L quantified isotropy and height parameters of the orange peel paint. The orange peel texture quantified the random pattern direction with 94.4% isotropy. Height parameters quantify the texture with a 24.84µm height difference.

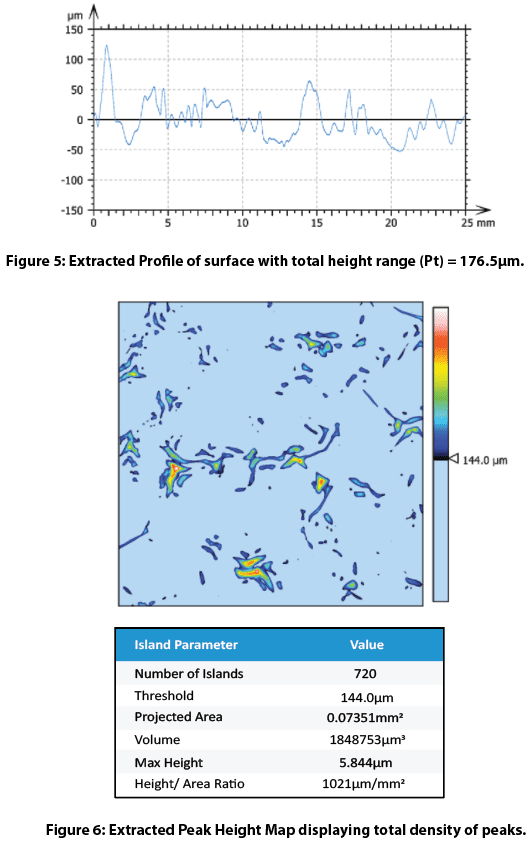
The bearing ratio curve in Figure 4 is a graphical representation of the depth distribution. This is an interactive feature within the software that allows the user to view distributions and percentages at varying depths. An extracted profile in Figure 5 gives useful roughness values for the orange peel texture. Peak extraction above a 144 micron threshold shows the orange peel texture. These parameters are easily adjusted to other areas or parameters of interest.
Conclusion
In this application, the Nanovea HS2000L 3D Non-Contact Profilometer precisely characterizes both topography and nanometer details of the paint orange peel texture on a gloss coating. Areas of interest from 3D surface measurements are quickly identified and analyzed with many useful measurements (Dimension, Roughness Finish Texture, Shape Form Topography, Flatness Warpage Planarity, Volume Area, Step-Height, etc.). Quickly chosen 2D cross-sections provide a complete set of surface measurement resources on gloss texture. Special areas of interest can be further analyzed with an integrated AFM module. Nanovea 3D Profilometer’s speed ranges from <1 mm/s to 500 mm/s for suitability in research applications to the needs of high-speed inspection. Nanovea 3D Profilometers have a wide range of configurations to suit your application.
3D Surface Analysis of a Penny with Non-contact Profilometry
Importance of Non-contact Profilometry for Coins
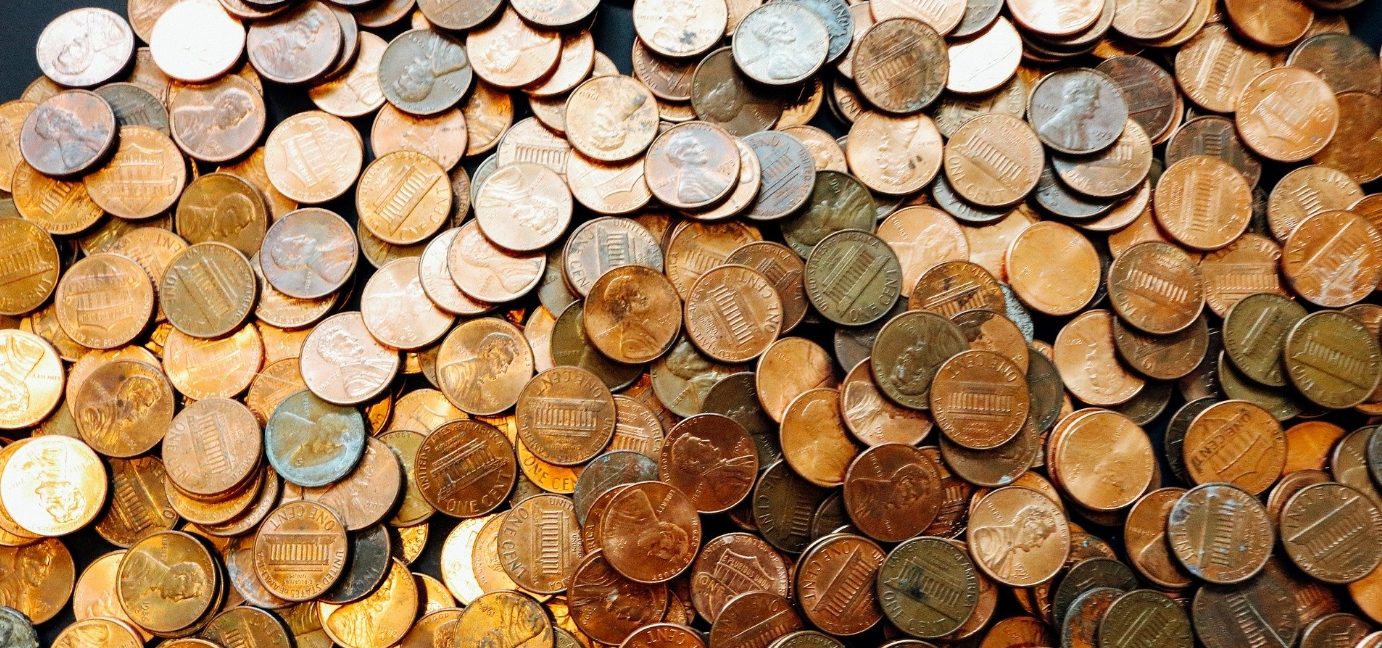
Currency is highly valued in modern society because it is traded for goods and services. Coin and paper bill currency circulates around the hands of many people. Constant transfer of physical currency creates surface deformation. Nanovea’s 3D Profilometer scans the topography of coins minted in different years to investigate surface differences.
Coin features are easily recognizable to the general public since they are common objects. A penny is ideal for introducing the strength of Nanovea’s Advanced Surface Analysis Software: Mountains 3D. Surface data collected with our 3D Profilometer allows for high level analyses on complex geometry with surface subtraction and 2D contour extraction. Surface subtraction with a controlled mask, stamp, or mold compares the quality of manufacturing processes while contour extraction identifies tolerances with dimensional analysis. Nanovea’s 3D Profilometer and Mountains 3D software investigates the submicron topography of seemingly simple objects, like pennies.
Measurement Objective
The full upper surface of five pennies were scanned using Nanovea’s High-Speed Line Sensor. The inner and outer radius of each penny was measured using Mountains Advanced Analysis Software. An extraction from each penny surface at an area of interest with direct surface subtraction quantified surface deformation.

Results and Discussion
3D Surface
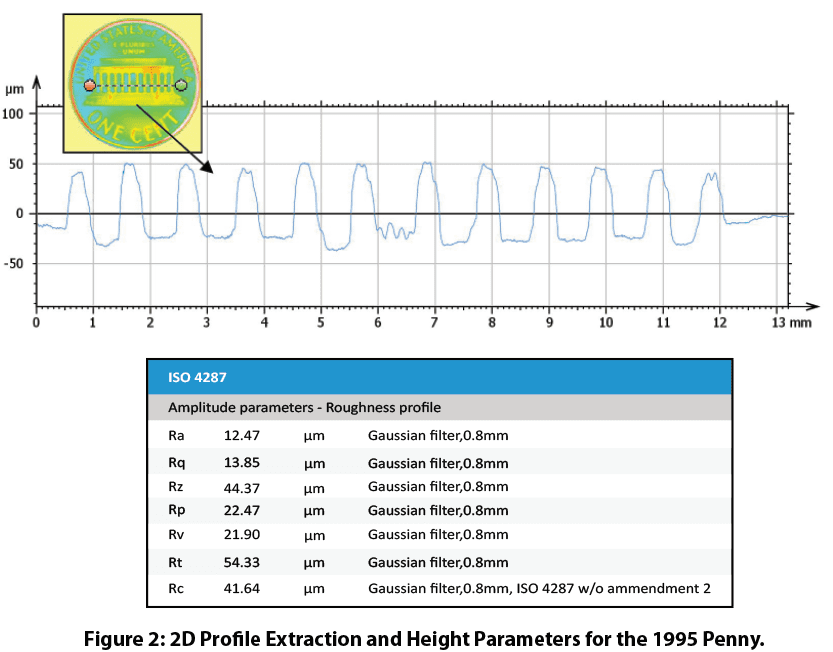
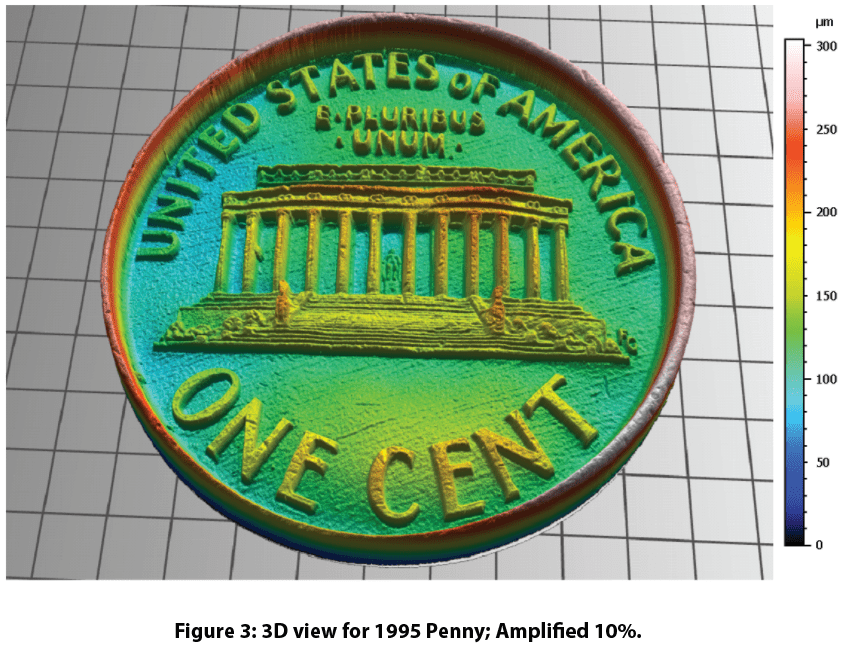
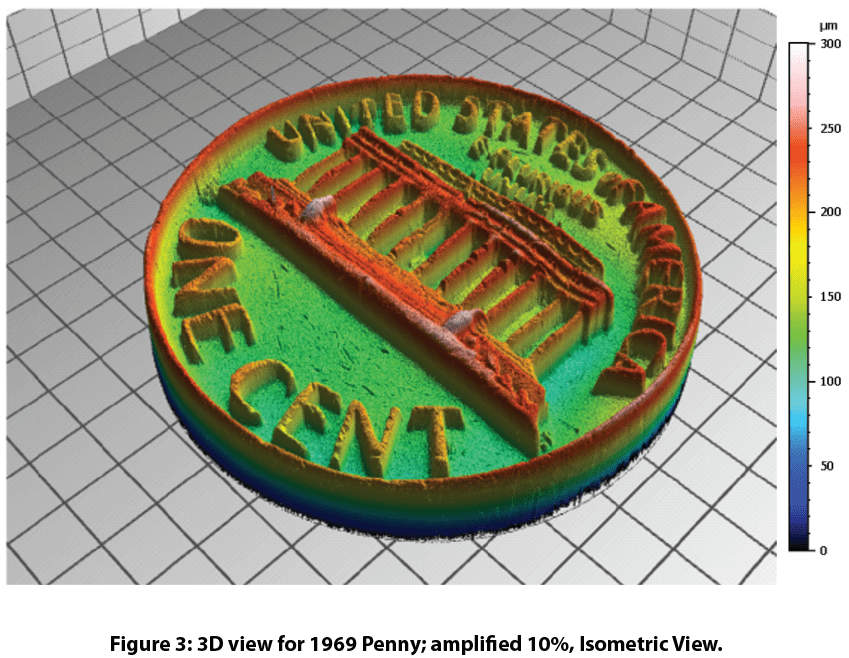
The Nanovea HS2000 profilometer took only 24 seconds to scan 4 million points in a 20mm x 20mm area with a 10um x 10um step size to acquire the surface of a penny. Below is a height map and 3D visualization of the scan. The 3D view shows the High-Speed sensor’s ability to pick up small details unperceivable to the eye. Many small scratches are visible across the surface of the penny. Texture and roughness of the coin seen in the 3D view are investigated.

Dimensional Analysis
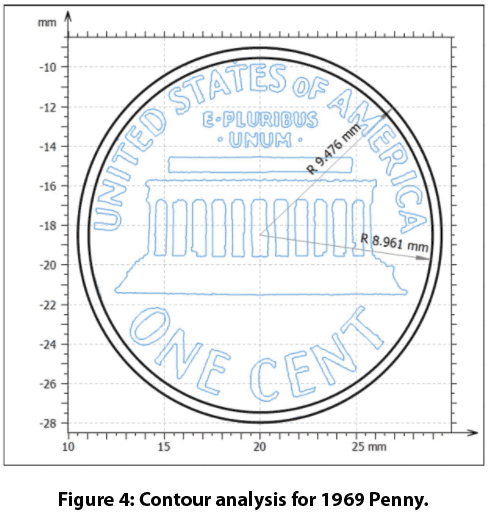
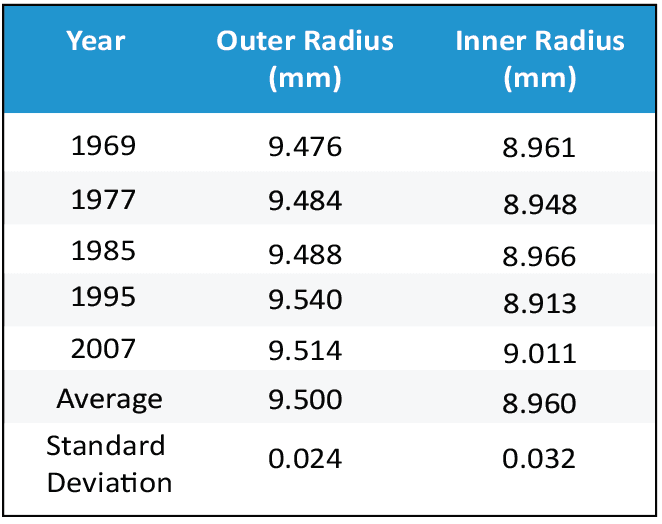
The contours of the penny were extracted and dimensional analysis obtained inner and outer diameters of the edge feature. The outer radius averaged 9.500 mm ± 0.024 while the inner radius averaged 8.960 mm ± 0.032. Additional dimensional analyses Mountains 3D can do on 2D and 3D data sources are distance measurements, step height, planarity, and angle calculations.
Surface Subtraction
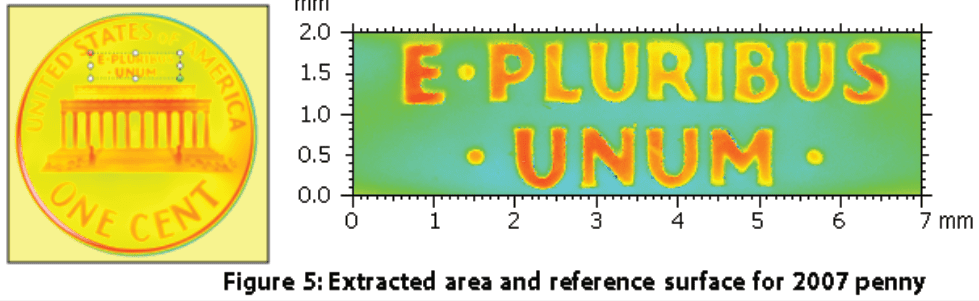
Figure 5 shows the area of interest for the surface subtraction analysis. The 2007 penny was used as the reference surface for the four older pennies. Surface subtraction from the 2007 penny surface shows differences between pennies with holes/peaks. Total surface volume difference is obtained from adding volumes of the holes/peaks. The RMS error refers to how closely penny surfaces agree with each other.

Conclusion

Nanovea’s High-Speed HS2000L scanned five pennies minted in different years. Mountains 3D software compared surfaces of each coin using contour extraction, dimensional analysis, and surface subtraction. The analysis clearly defines the inner and outer radius between the pennies while directly comparing surface feature differences. With Nanovea’s 3D profilometer’s ability to measure any surfaces with nanometer-level resolution, combined with Mountains 3D analysis capabilities, the possible Research and Quality Control applications are endless.
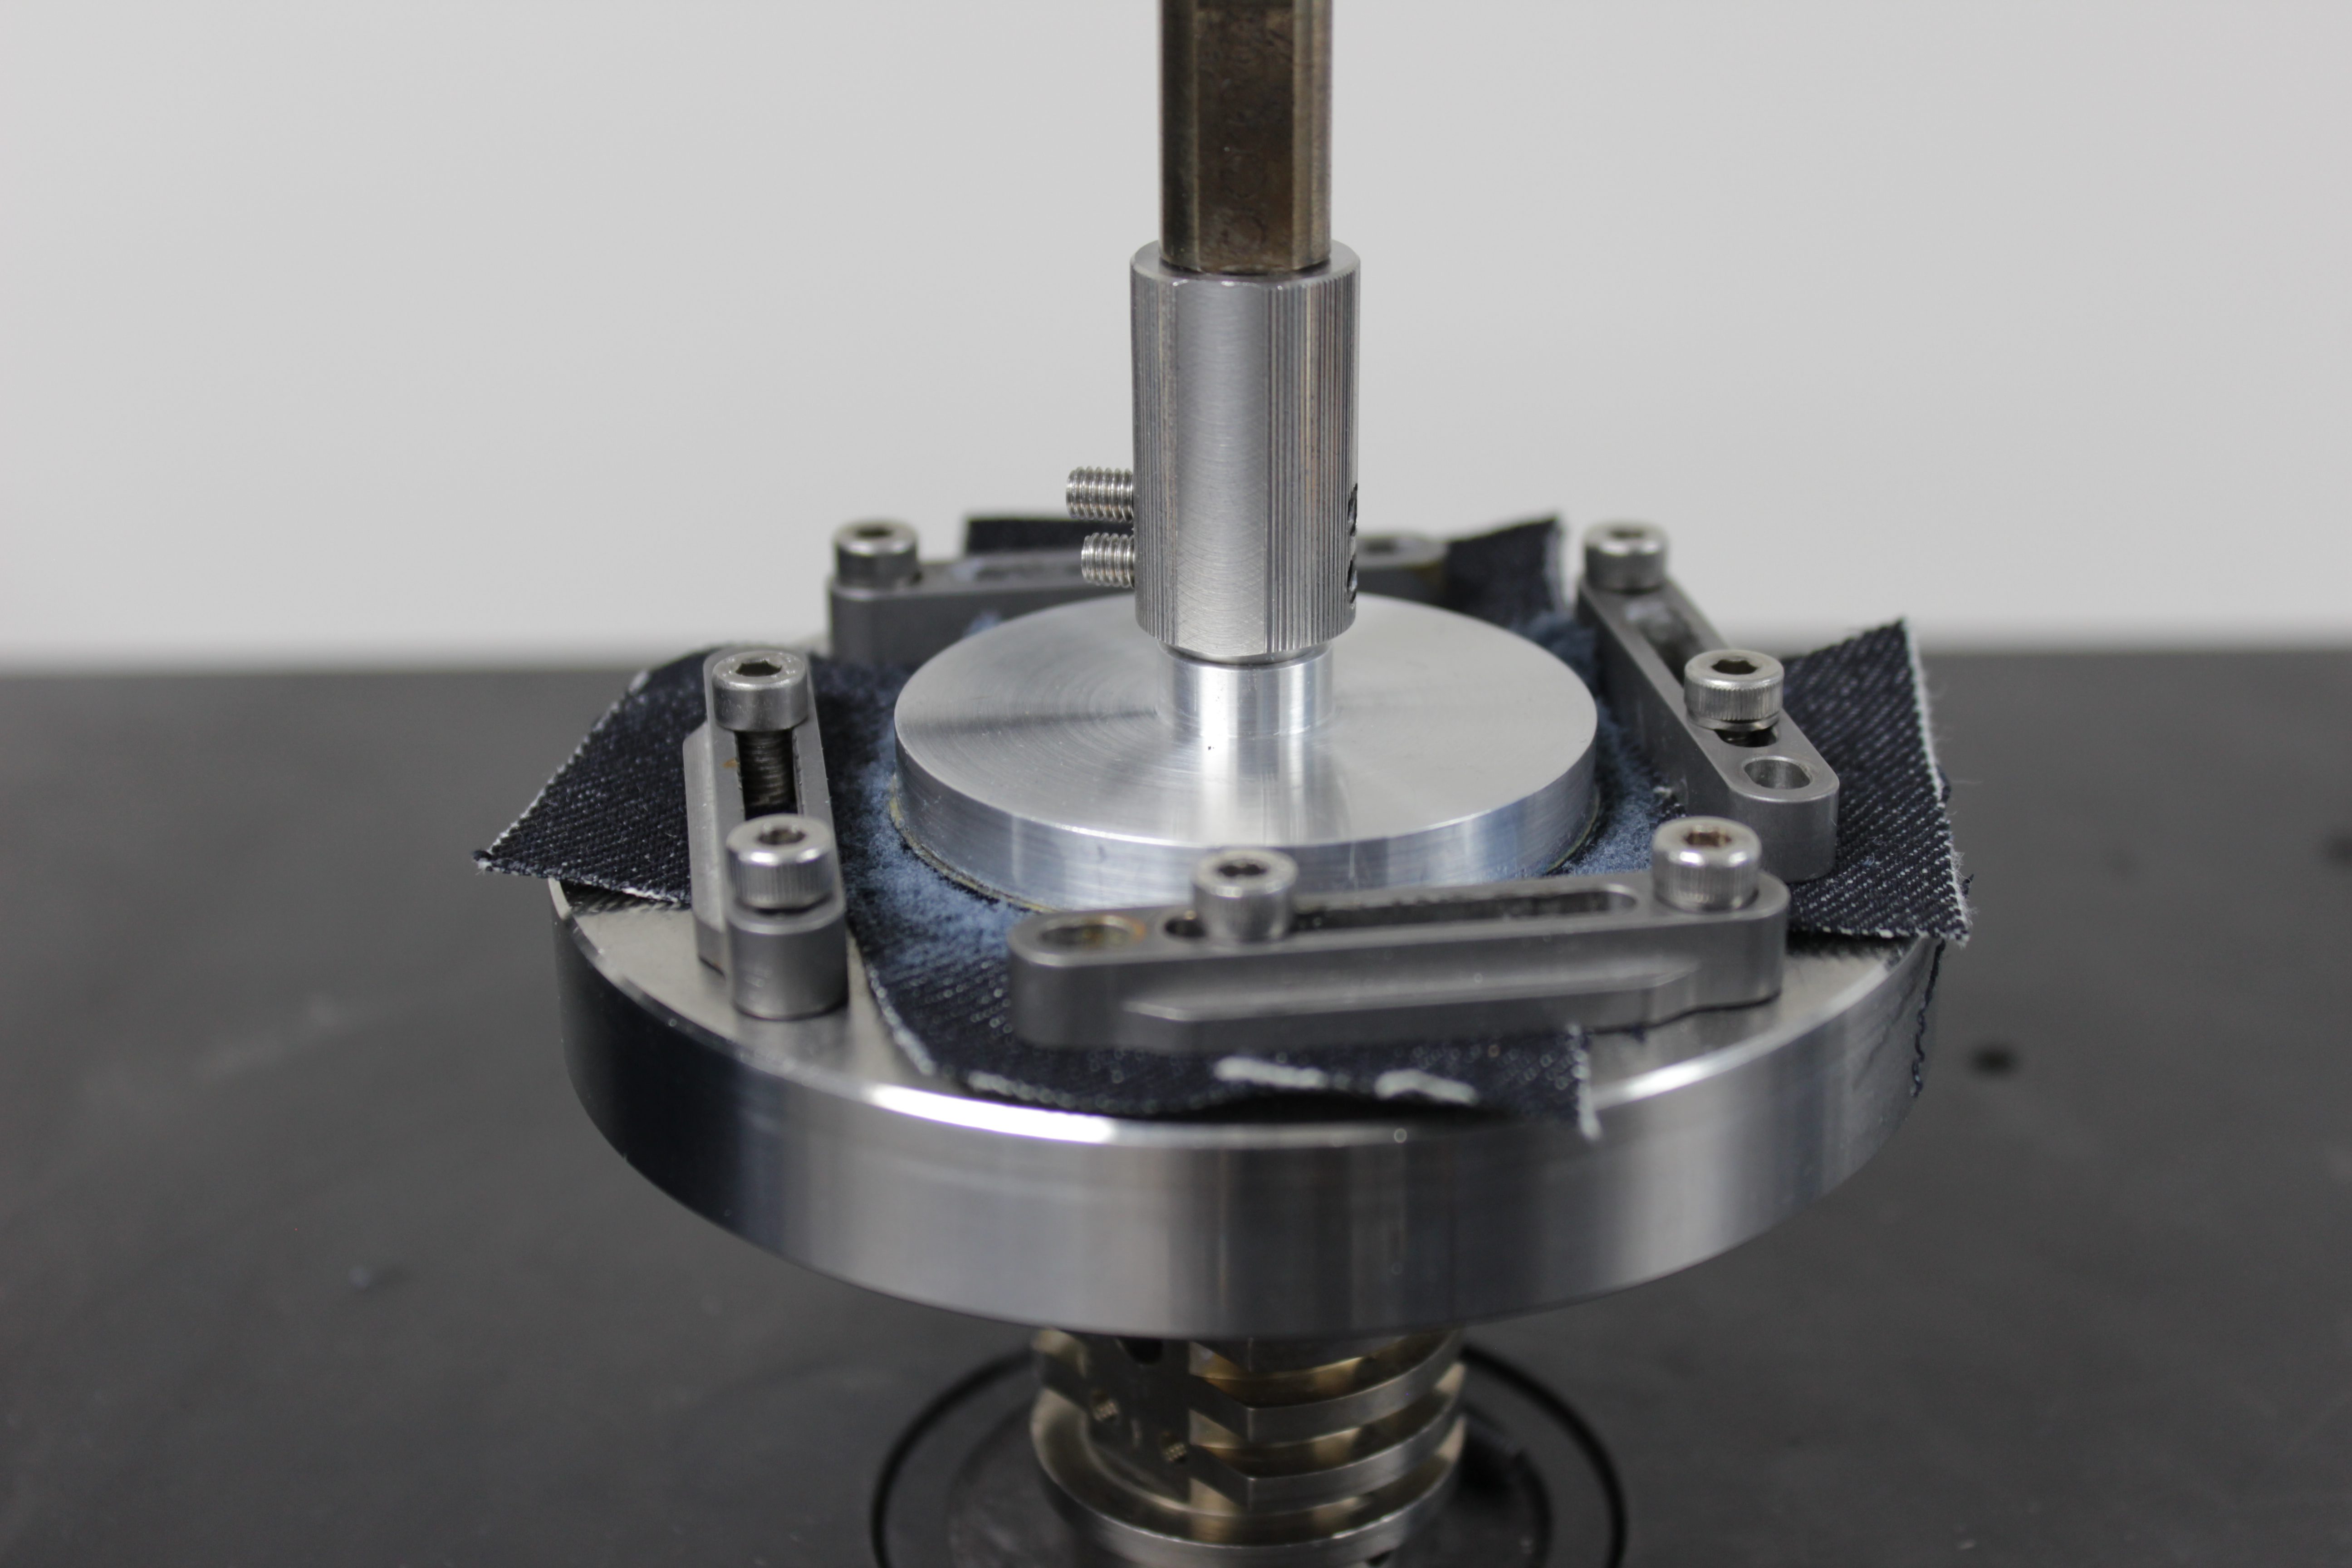
Comparing Abrasion Wear on Denim
Introduction
The form and function of a fabric is determined by its quality and durability. Daily usage of fabrics cause wear and tear on the material, e.g. piling, fuzzing, and discoloration. Subpar fabric quality used for clothing can often lead to consumer dissatisfaction and brand damage.
Attempting to quantify the mechanical properties of fabrics can pose many challenges. The yarn structure and even the factory in which it was produced can result in poor reproducibility of test results. Making it difficult to compare test results from different laboratories. Measuring the wear performance of fabrics is critical to the manufacturers, distributors, and retailers in the textile production chain. A well controlled and reproducible wear resistance measurement is crucial to ensure reliable quality control of the fabric.
Click to read the full application note!
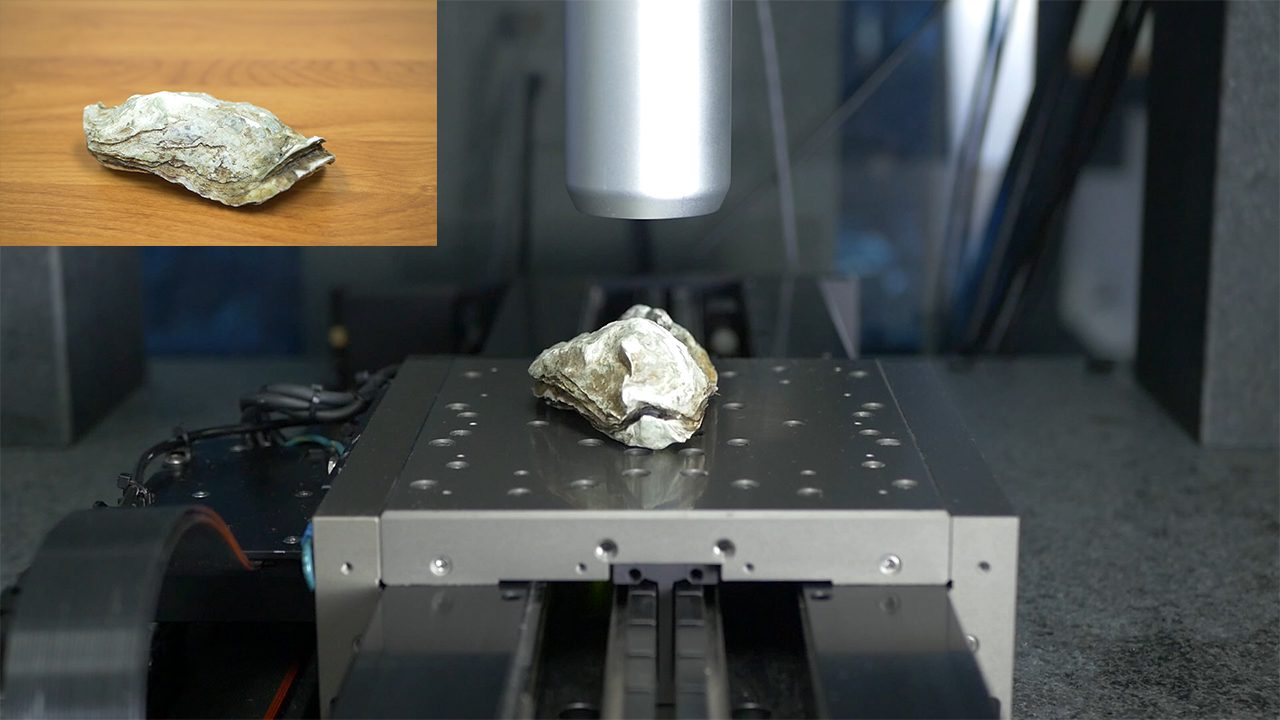
High Speed Characterization of an Oyster Shell
Large samples with complex geometries can prove difficult to work with due to sample preparation, size, sharp angles, and curvature. In this study an oyster shell will be scanned to demonstrate the Nanovea HS2000 Line Sensor’s capability to scan a large, biological sample with complex geometry. While a biological sample was used in this study, the same concepts can be applied to other samples.


Surface Finish Inspection of Wood Flooring
Importance of Profiling Wood Finishes
In various industries, the purpose of a wood finish is to protect the wooden surface from various types of damage such as chemical, mechanical or biological and/or provide a specific visual aesthetic. For manufacturers and buyers alike, quantifying surface characteristics of their wood finishes can be vital to the quality control or optimization of finishing processes for wood. In this application, we will explore the various surface features that can be quantified using a Nanovea 3D Non-Contact Profilometer.
Quantifying the amount of roughness and texture that exists on a wooden surface can be essential to know in order to ensure it can meet the requirements of its application. Refining the finishing process or checking the quality of wooden surfaces based on a quantifiable, repeatable and reliable surface inspection method would allow manufacturers to create controlled surface treatments and buyers the ability to inspect and select wood materials to meet their needs.
Measurement Objective
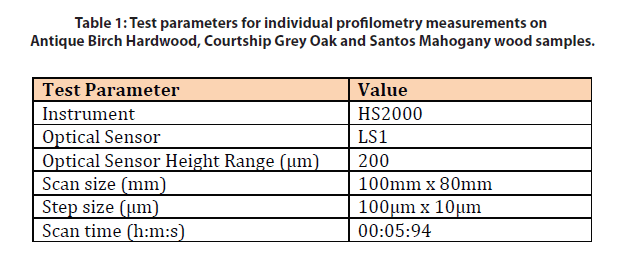
In this study, the high-speed Nanovea HS2000 profilometer equipped with a non-contact profiling line sensor was used to measure and compare the surface finish of three flooring samples: Antique Birch Hardwood, Courtship Grey Oak, and Santos Mahogany flooring. We showcase the capability of the Nanovea Non-Con-tact Profilometer in delivering both speed and precision when measuring three types of surface areas and a comprehensive in-depth analysis of the scans.
Test Procedure and Procedures
Results and Discussion
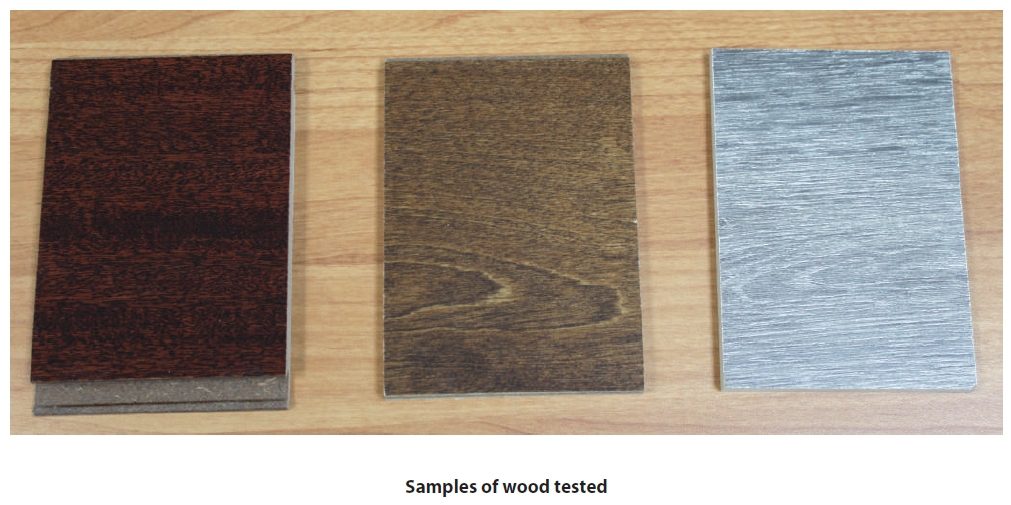
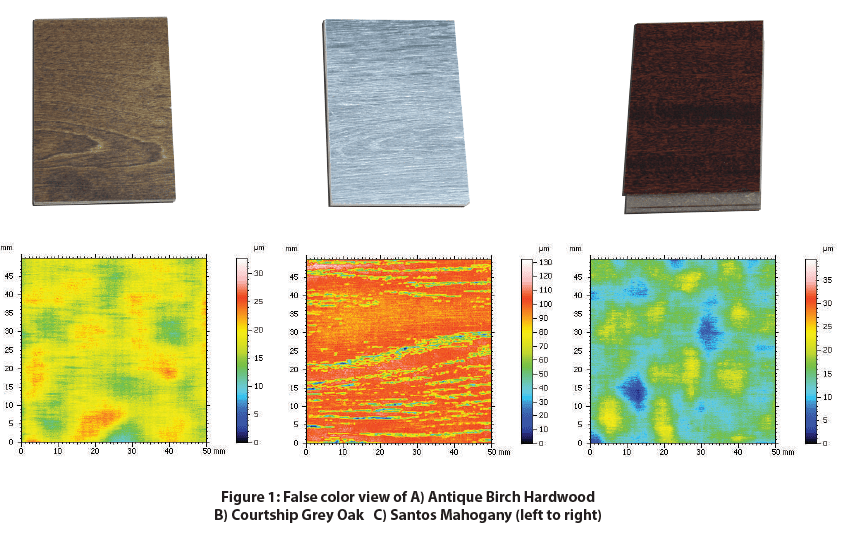
Sample description: Courtship Grey Oak and Santos Mahogany flooring are laminate flooring types. Courtship Grey Oak is a low gloss, textured slate gray sample with an EIR finish. Santos Mahogany is a high gloss, dark burgundy sample that was prefinished. Antique Birch Hardwood has a 7-layer aluminum oxide finish, providing everyday wear and tear protection.
Antique Birch Hardwood
Courtship Grey Oak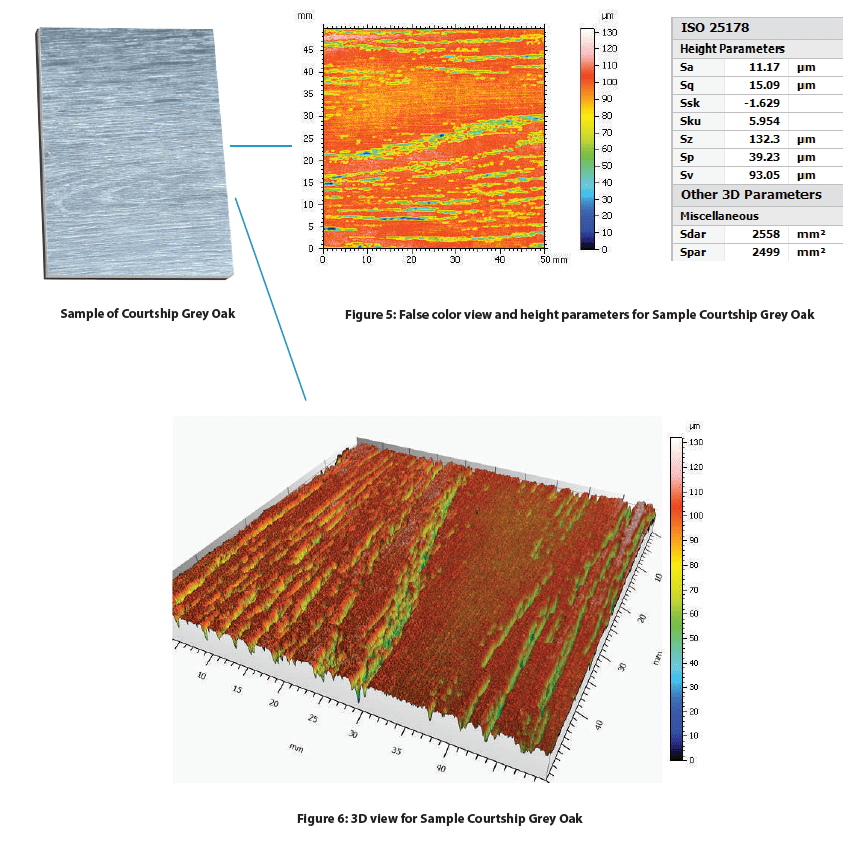
Santos Mahogany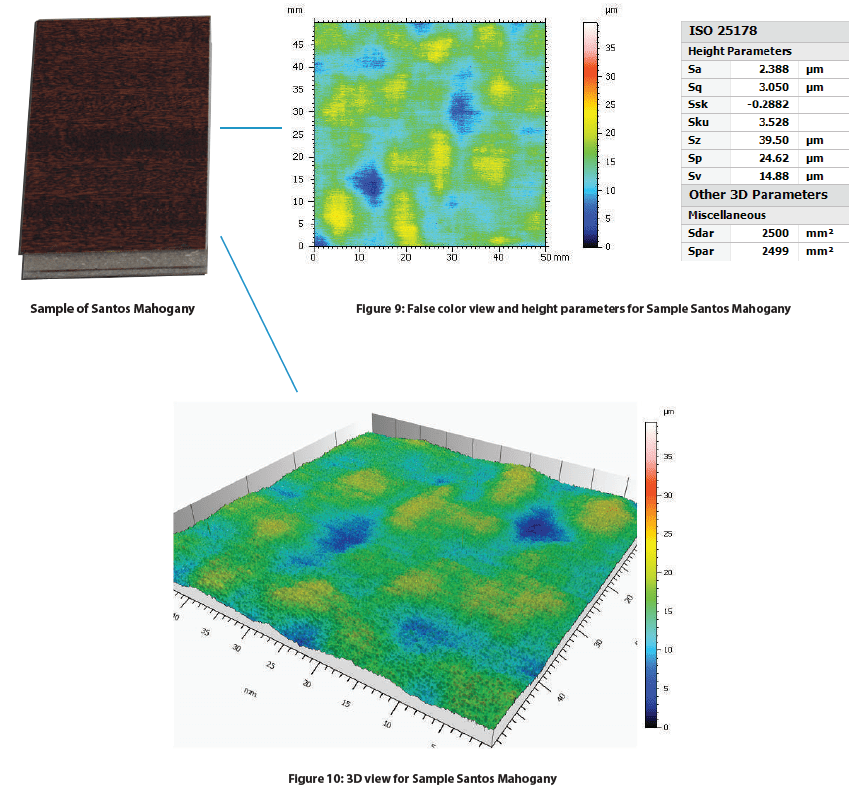

Discussion
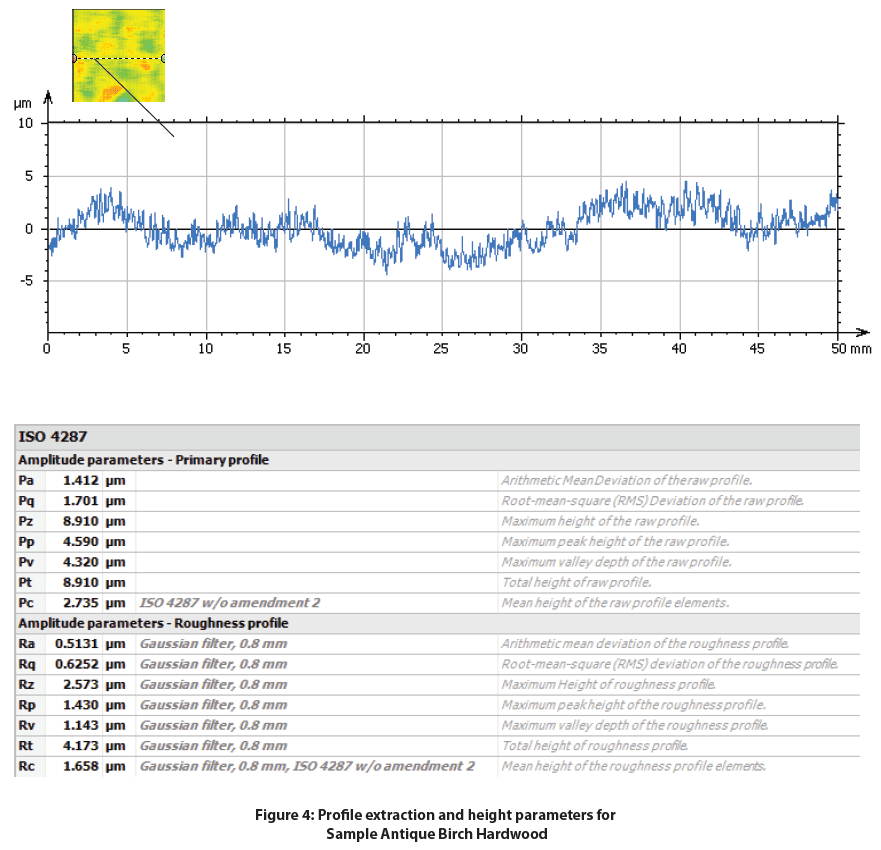
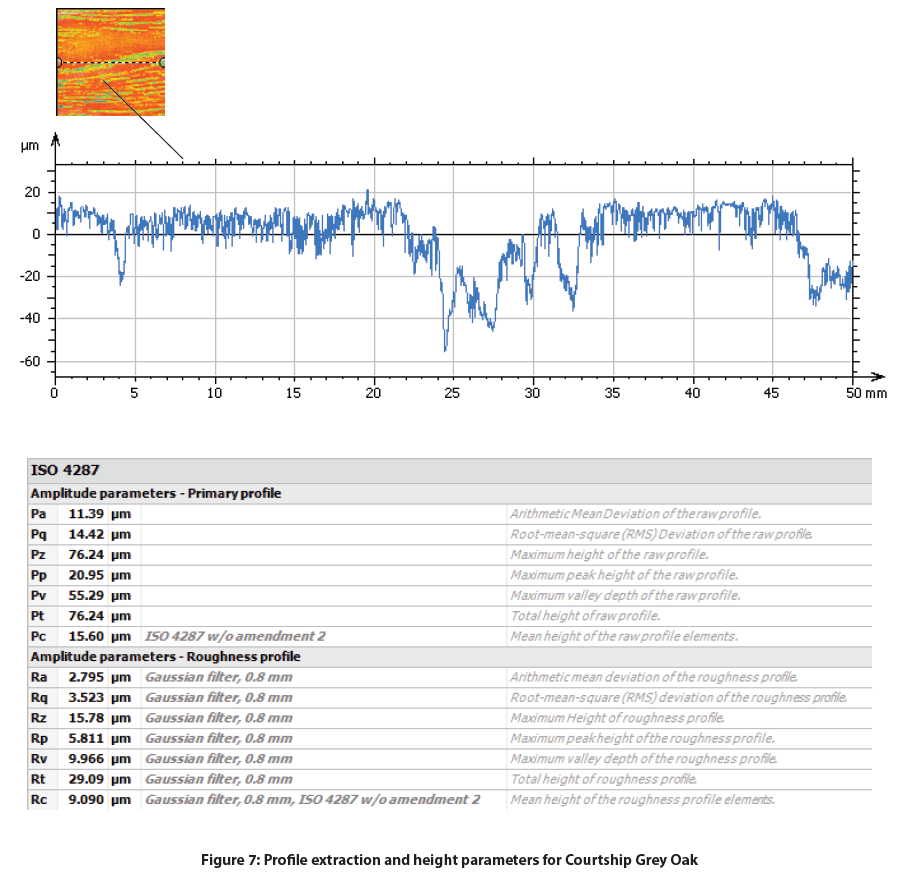
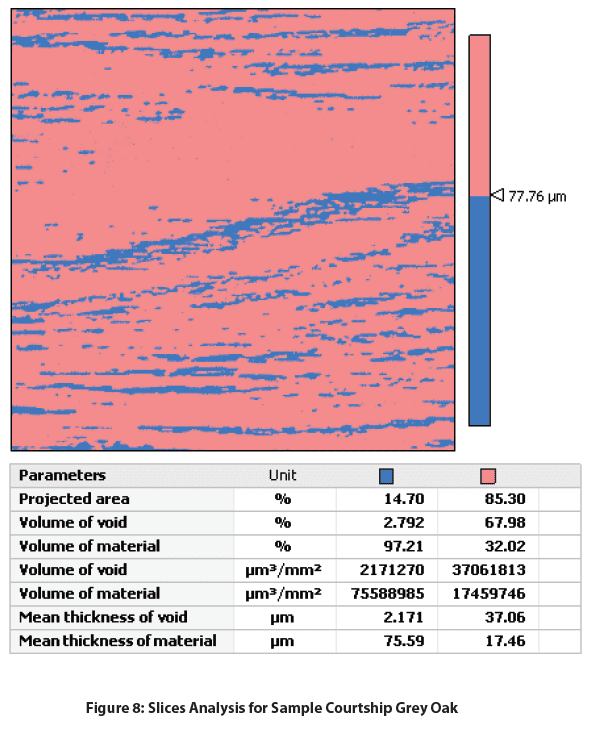
There is a clear distinction between all the samples’ Sa value. The smoothest was Antique Birch Hardwood with a Sa of 1.716 µm, followed by Santos Mahogany with a Sa of 2.388 µm, and significantly increasing for Courtship Grey Oak with a Sa of 11.17 µm. P-values and R-values are also common roughness values that can be used to assess the roughness of specific profiles along the surface. The Courtship Grey Oak possess-es a coarse texture full of crack-like features along the wood’s cellular and fiber direction. Additional analysis was done on the Courtship Grey Oak sample because of its textured surface. On the Courtship Grey Oak sample, slices were used to separate and calculate the depth and volume of the cracks from the flatter uniform surface.
Conclusion

In this application, we have shown how the Nanovea HS2000 high-speed profilometer can be used to inspect the surface finish of wood samples effectively and efficiently. Surface finish measurements can prove to be important to both manufactures and consumers of hardwood flooring in understanding how they can improve a manufacturing process or choose the appropriate product that performs best for a specific application.

Wood Wear Test with the Nanovea Tribometer
Importance of Comparing Wood Finish Wear & COF
Wood has been used for thousands of years as a building material for homes, furniture, and flooring. It has a combination of natural beauty, and durability, making it an ideal candidate for flooring. Unlike carpet, hardwood floors keep their color for a long time and can be easily cleaned and maintained, however, being a natural material, most wood flooring requires the application of a surface finish to protect the wood from various kinds of damage such as scuffing and chipping over time. In this study, a Nanovea Tribometer was used to measure the wear rate and coefficient of friction (COF) to better understand the comparative performance of three wood finishes.
The service behavior of a wood species used for flooring is often related to its wear resistance. The change in the individual cellular and fiber structure of different species of wood contributes to their different mechanical and tribological behaviors. Actual service tests of wood as flooring materials are expensive, difficult to duplicate, and require long periods of testing time. As a result, it becomes valuable to develop a simple wear test that can produce reliable, reproducible, and straight forward.
Measurement Objective
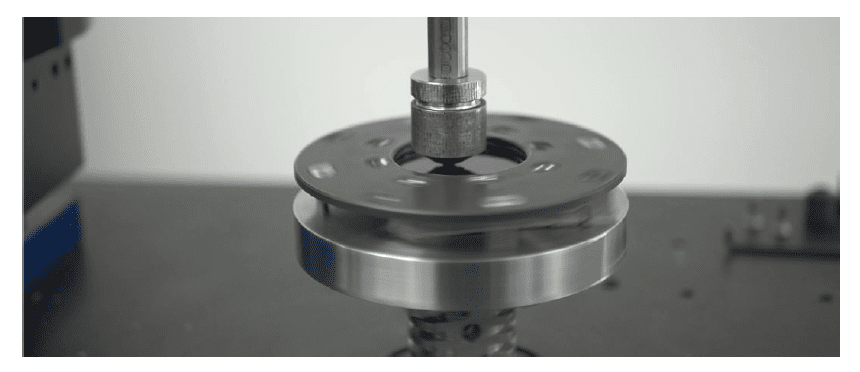
In this study, we simulated and compared the wear behaviors of three types of wood to showcase the capability of the Nanovea Tribometer in evaluating the tribological properties of wood in a controlled and monitored manner.
Discussion
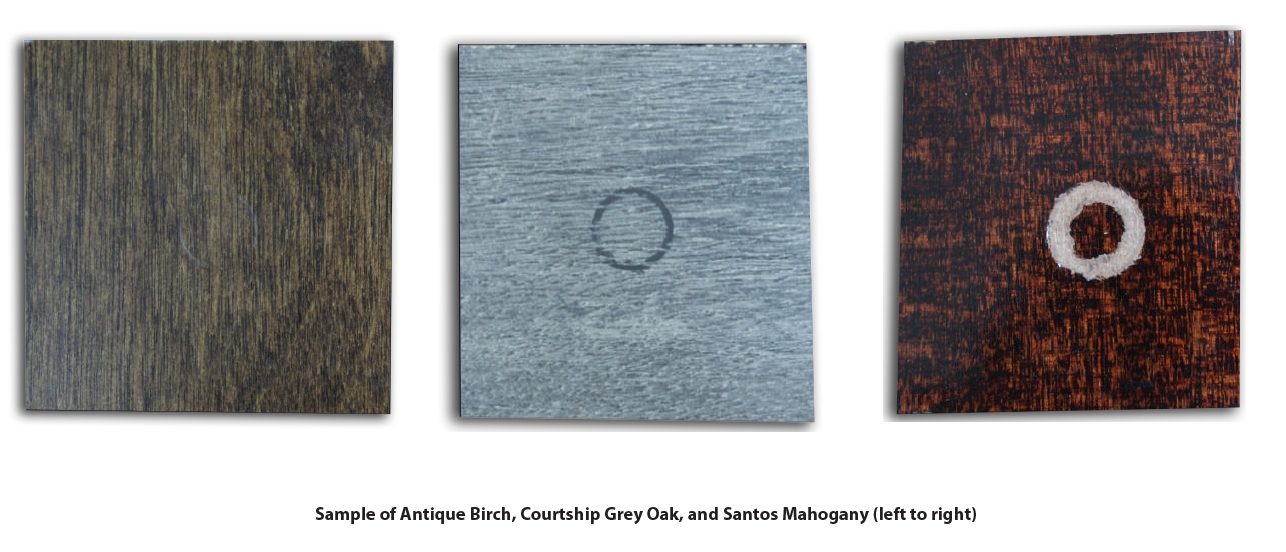
Sample Description: Antique Birch Hardwood has a 7-layer aluminum oxide finish, providing everyday wear and tear protection. Courtship Grey Oak, & Santos Mahogany are both laminate flooring types that vary in surface finish and gloss. The Courtship Grey Oak is a slate gray color, EIR finish, and low gloss. On the other hand, Santos Mahogany is a dark burgundy color, prefinished, and high gloss which allows surface scratches and defects to be more easily hidden.
The evolution of COF during the wear tests of the three wood flooring samples are plotted in Fig. 1. The Antique Birch Hardwood, Courtship Grey Oak, & Santos Mahogany samples all showed different COF behavior.
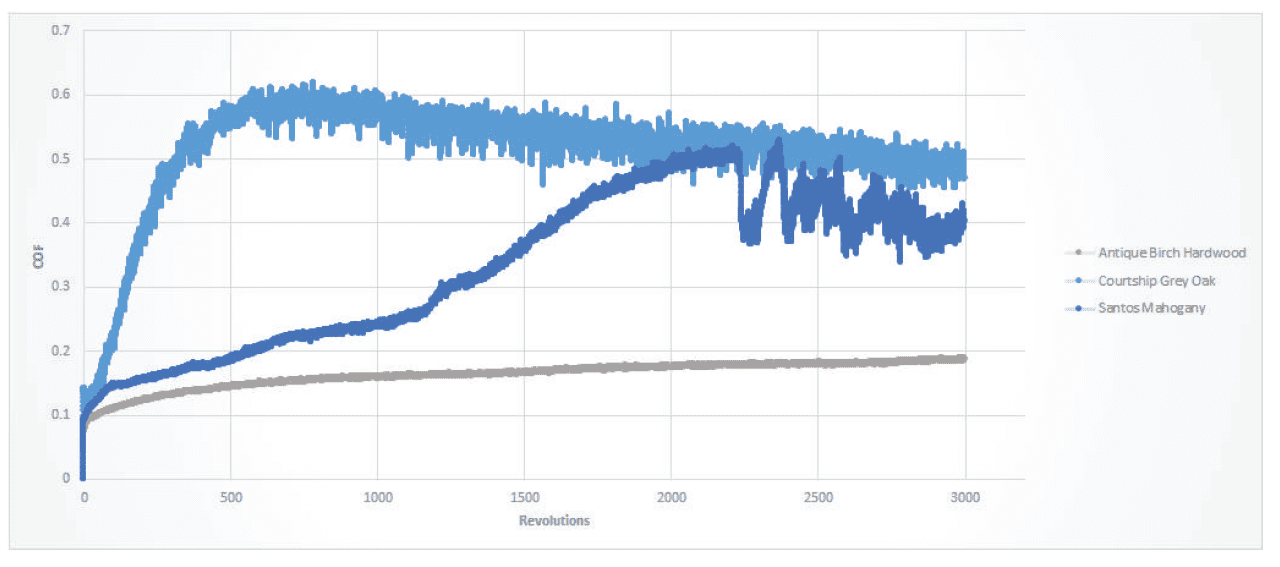
It can be observed in the graph above that Antique Birch Hardwood was the only sample that demonstrated a steady COF for the duration of an entire test. The Courtship Grey Oak’s sharp increase in COF and then gradual decrease could be indicative that the sample’s surface roughness largely contributed to its COF behavior. As the sample wore, the surface roughness decreased and became more homogenous which explains the decrease in COF as the sample surface became smoother from mechanical wear. The COF on Santos Mahogany displays a smooth gradual increase in COF at the beginning of the test and then transitioned abruptly into a choppy COF trend. This could indicate that once the laminate coating started to wear through, the steel ball (counter material) made contact with the wood substrate which wore in a quicker and turbulent manner creating the noisier COF behavior towards the end of the test.
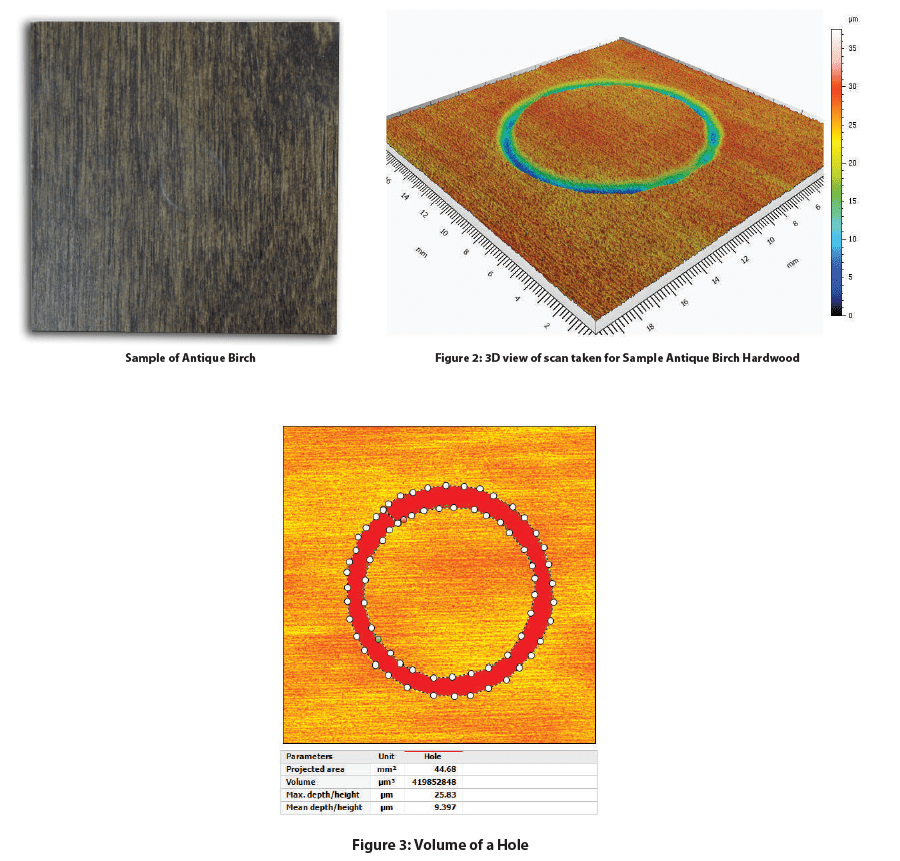
Antique Birch Hardwood:
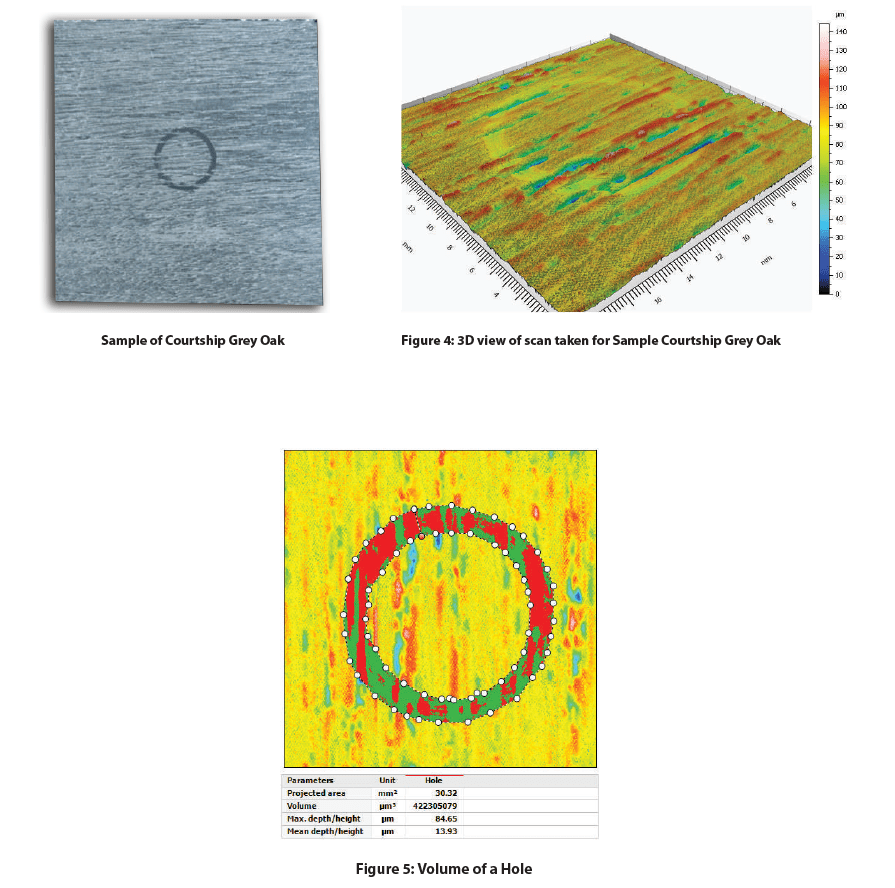
Courtship Grey Oak:
Santos Mahogany
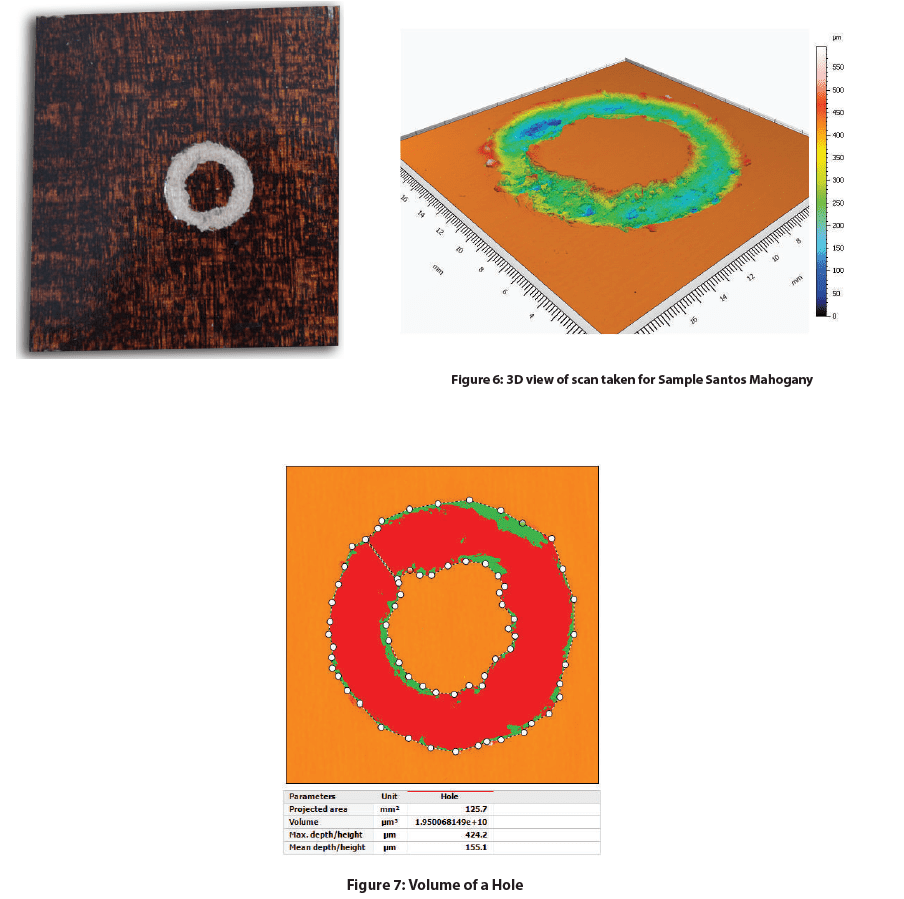
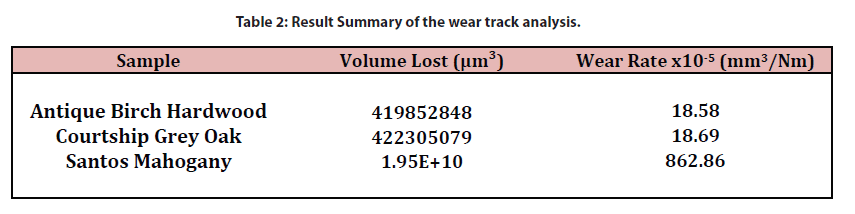
Table 2 summarizes the results of the wear track scans and analysis on all wood flooring samples after the wear tests were performed. Detailed information and images for each sample can be seen in Figures 2-7. Based on the Wear Rate comparison between all three samples, we can deduct that Santos Mahogany proved to be less resilient to mechanical wear than the other two samples. Antique Birch Hardwood and Courtship Grey Oak had very similar wear rates although their wear behavior during their tests differed significantly. Antique Birch Hardwood had a gradual and more uniform wear trend while Court-ship Grey Oak showed a shallow and pitted wear track due to the pre-existing surface texture and finish
Conclusion

In this study, we showcased the capacity of Nanovea’s Tribometer in evaluating the coefficient of friction and wear resistance of three types of wood, Antique Birch Hardwood, Courtship Grey Oak, and Santos Mahogany in a controlled and monitored manner. The superior mechanical properties of the Antique Birch Hardwood leads to its better wear resistance. The texture and homogeneity of the wood surface play an important role in the wear behavior. The Courtship Grey Oak surface texture such as gaps or cracks between the wood cell fibers may become the weak spots where the wear initiates and propagates.
Portability and Flexibility of the Jr25 3D Non-contact Profilometer
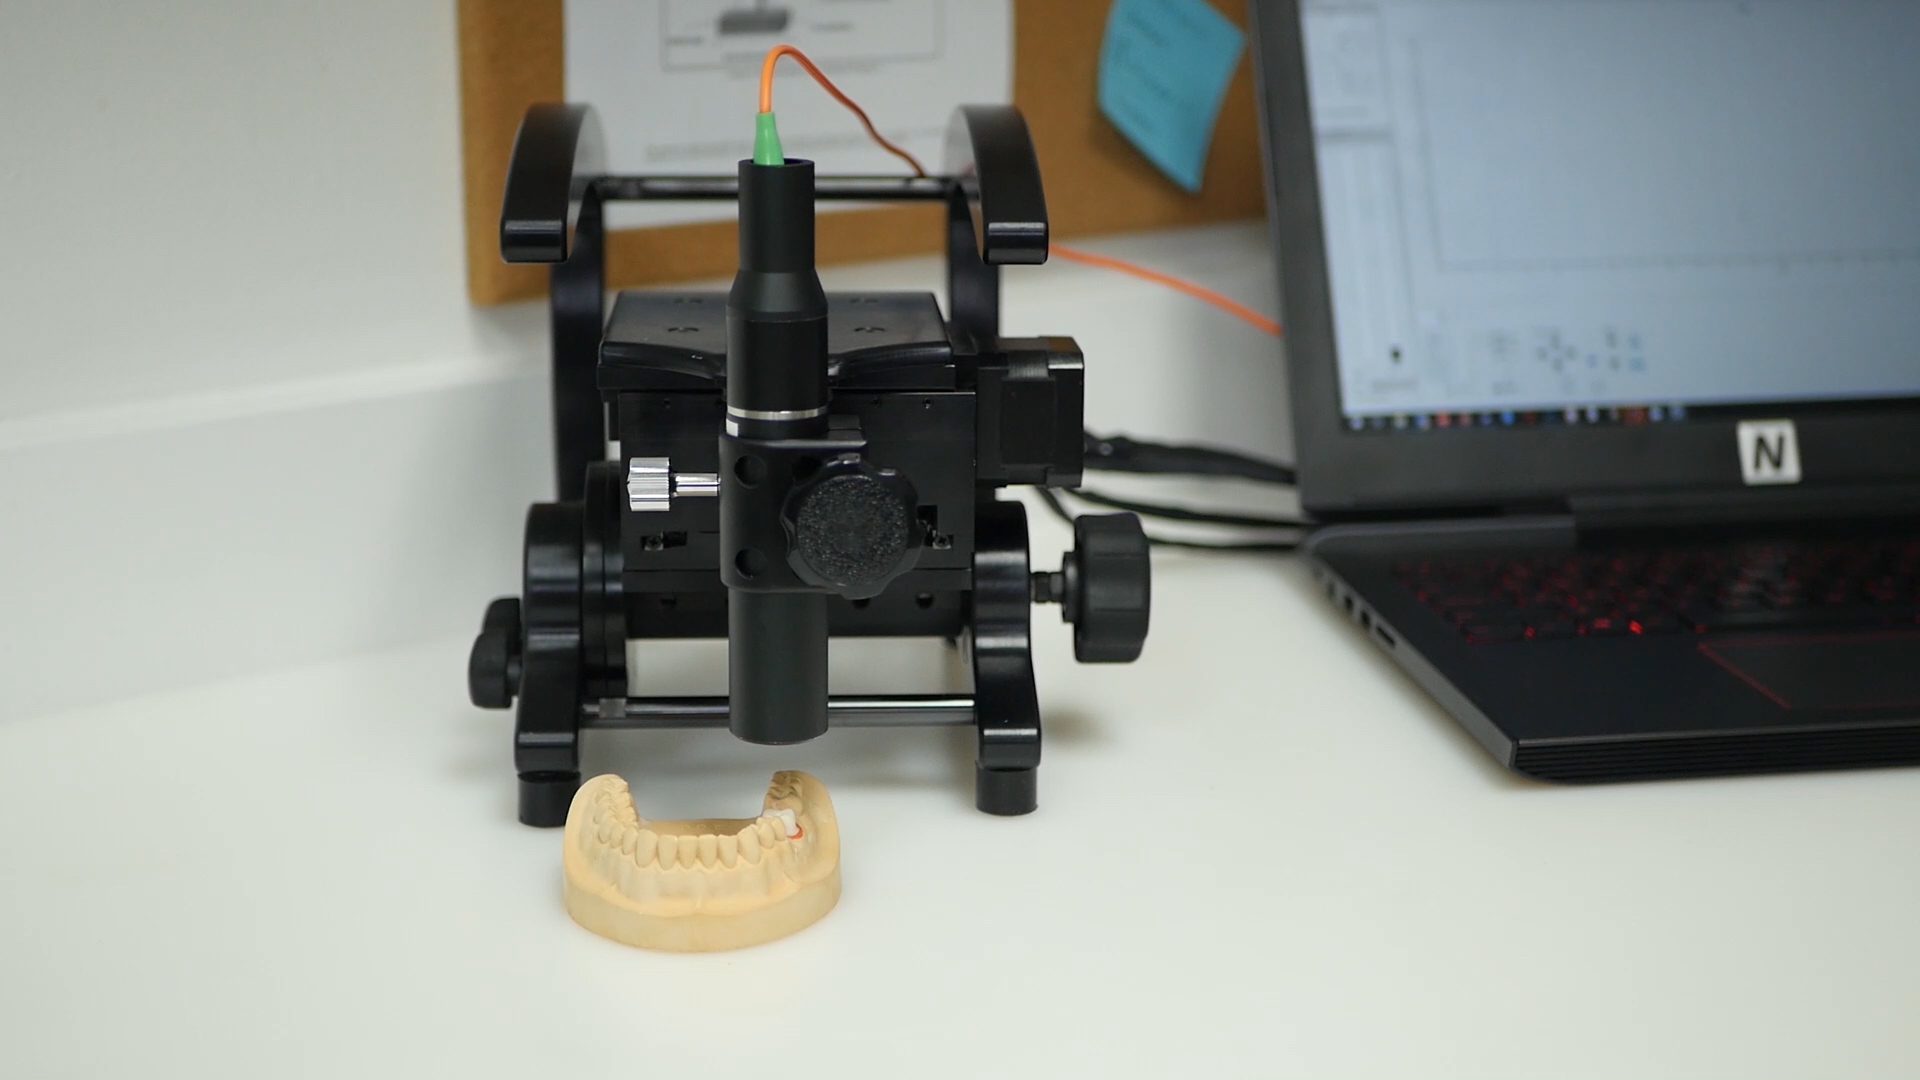
Understanding and quantifying a sample’s surface is crucial for many applications including quality control and research. To study surfaces, profilometers are often used to scan and image samples. A large problem with conventional profilometry instruments is the inability to accommodate for non conventional samples. Difficulties in measuring non conventional samples can occur due to sample size, geometry, inability to move the sample, or other inconvenient sample preparations. Nanovea’s portable 3D non-contact profilometers, the JR series, is able to solve most of these problems with its ability to scan sample surfaces from varying angles and its portability.
Read about the Jr25 Non-contact Profilometer!
Textile Abrasion Wear By Tribometer
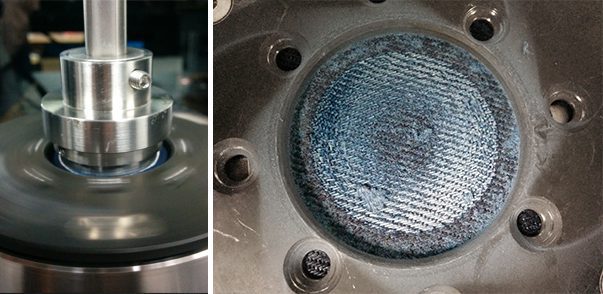
The measurement of textile abrasion resistance of fabrics is very challenging. Many factors play a role during the test, including the mechanical properties of the fibers, the structure of the yarns and the weave of the fabrics. This may result in poor reproducibility of test results and create difficulty in comparing values reported from different laboratories. Wear performance of the fabrics is critical to the manufacturers, distributors, and retailers in the textile production chain. A well-controlled quantifiable and reproducible Tribometer wear resistance measurement is crucial to ensure reliable quality control of the fabric production.
Textile Texture Measurement Using 3D Profilometry
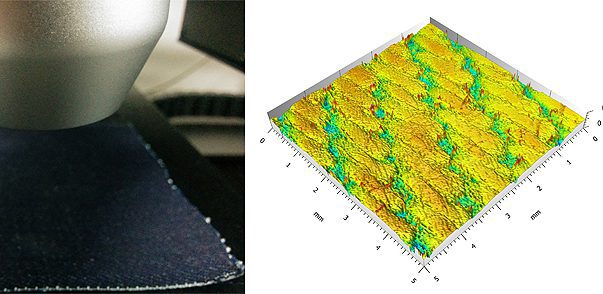
Understanding textile texture, consistency and patterns of the fabrics allows the best selection of processing and control measures. Traditional stylus-based profilometers determine the surface morphology of the coatings by sliding in contact across the measured surface, which may deform the soft fabric and induce inaccurate measurement. The Nanovea 3D Non-Contact Profilometer utilize chromatic confocal technology with unmatched capability to provide a comprehensive analysis of the surface feature of fabrics, making it an ideal tool for reliable product inspection and quality control.