Category: Mechanical Testing

Tooth Hardness Evaluation using Nanoindentation
Importance of Nanoindentation for Bio Materials
With many traditional mechanical tests (Hardness, Adhesion, Compression, Puncture, Yield Strength, etc.), today’s quality control environments with advanced sensitive materials, from gels to brittle materials, now require greater precision and reliability control. Traditional mechanical instrumentation fails to provide the sensitive load control and resolution required; designed to be used for bulk materials. As the size of material being tested became of greater interest, the development of Nanoindentation provided a reliable method to obtain essential mechanical information on smaller surfaces such as the research being done with biomaterials. The challenges specifically associated with biomaterials have required the development of mechanical testing capable of accurate load control on extremely soft to brittle materials. Also, multiple instruments are needed to perform various mechanical tests which can now be performed on a single system. Nanoindentation provides a wide range of measurement with precise resolution at nano controlled loads for sensitive applications.
Measurement Objective
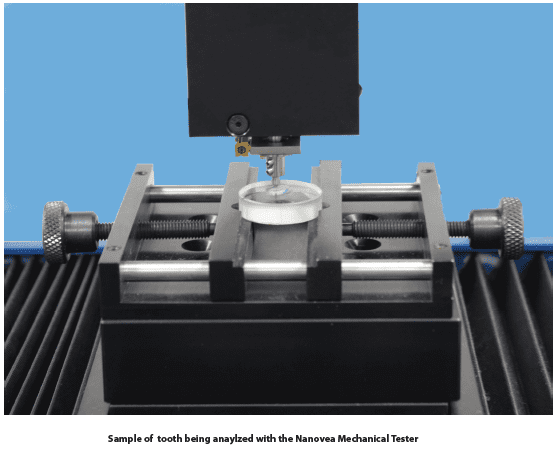
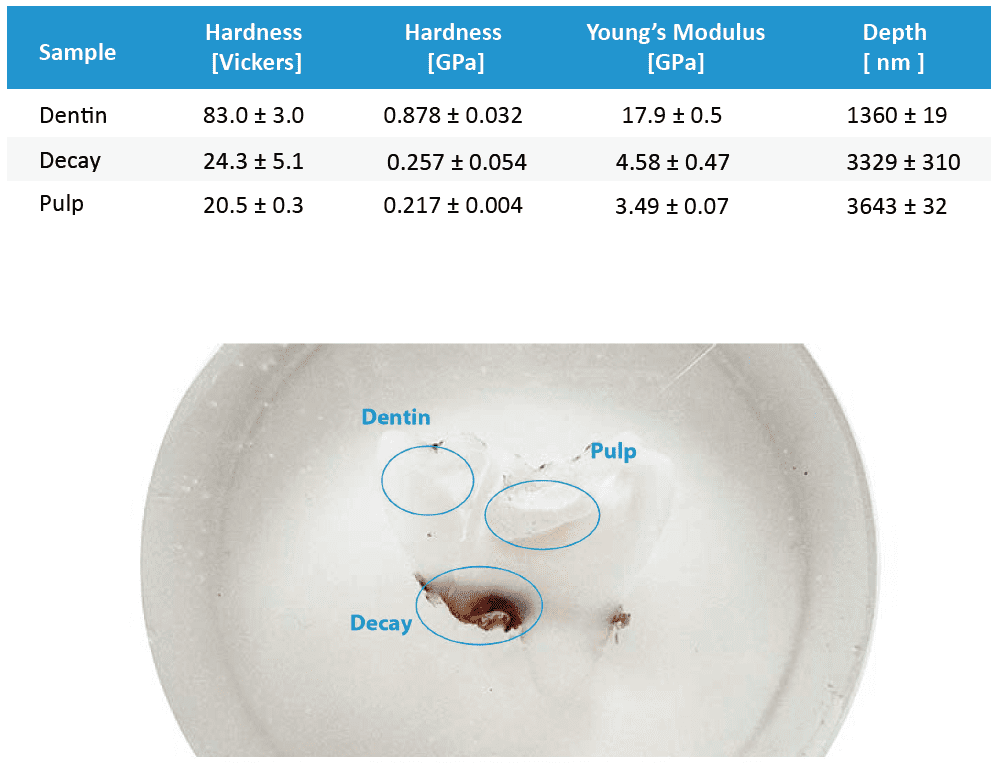
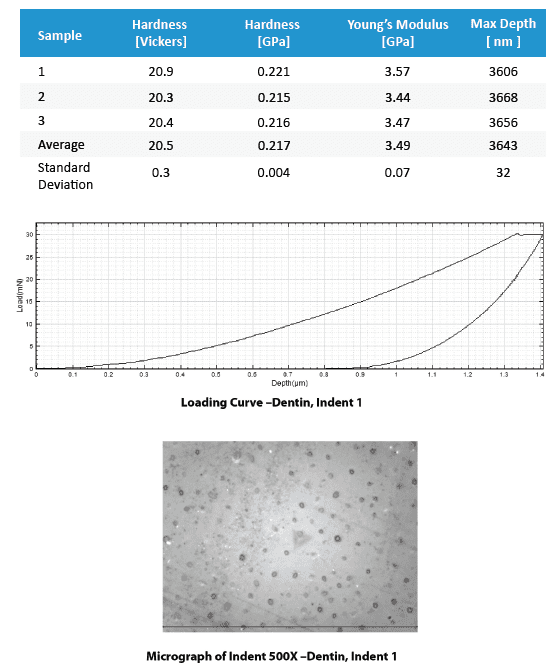
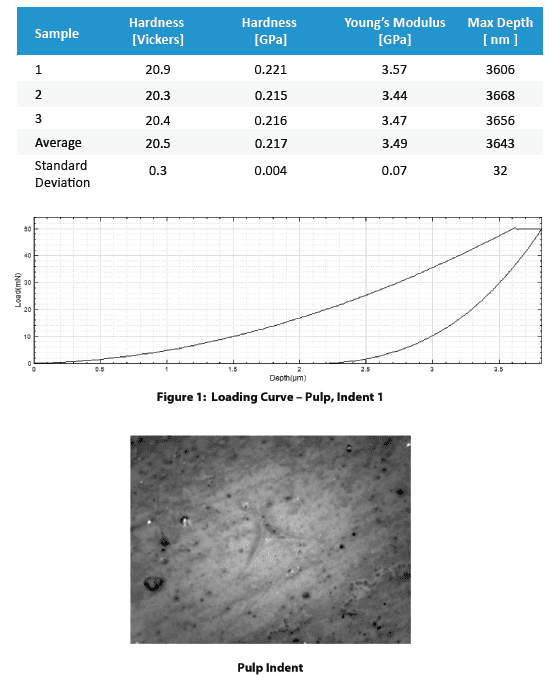
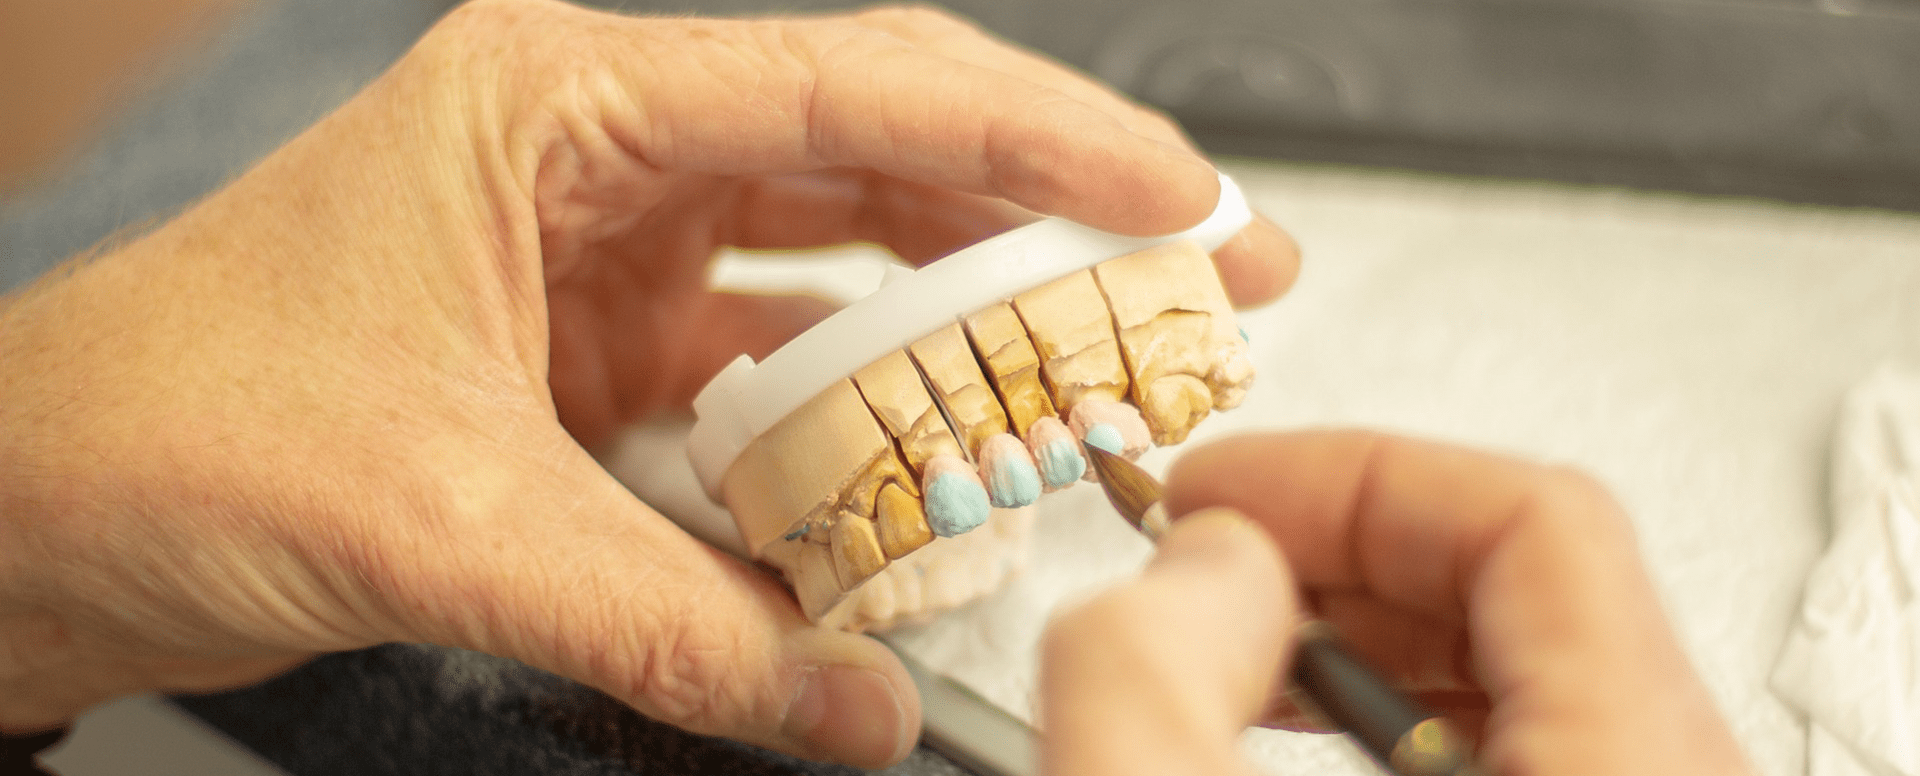
In this application, the Nanovea Mechanical Tester, in Nanoindentation mode, is used to study the hardness and elastic modulus of the dentin, decay, and pulp of a tooth. The most critical aspect with Nanoindentation testing is securing the sample, here we took a sliced tooth and epoxy mounted leaving all three areas of interest exposed for testing.
Results and Discussion
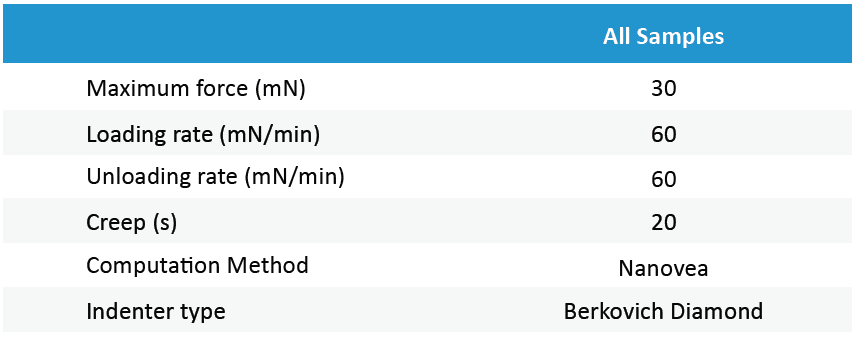
This section includes a summary table that compares the main numerical results for the different samples, followed by the full result listings, including each indentation performed, accompanied by micrographs of the indentation, when available. These full results present the measured values of Hardness and Young’s modulus as the penetration depth with their averages and standard deviations. It should be considered that large variation in the results can occur in the case that the surface roughness is in the same size range as the indentation.
Summary table of main numerical results:

Conclusion
In conclusion, we have shown how the Nanovea Mechanical Tester, in Nanoindentation mode, provides precise measurement of the mechanical properties of a tooth. The data can be used in the development of fillings that will better match the mechanical characteristics of a real tooth. The positioning capability of the Nanovea Mechanical Tester allows full mapping of the hardness of the teeth across the various zones.
Using the same system, it is possible to test teeth material fracture toughness at higher loads up to 200N. A multi-cycle loading test can be used on more porous materials to evaluate the remaining level of elasticity. Using a flat cylindrical diamond tip can give yield strength information in each zone. In addition, with DMA “Dynamic Mechanical Analysis”, the viscoelastic properties including loss and storage moduli can be evaluated.
The Nanovea nano module is ideal for these tests because it uses a unique feedback response to control precisely the load applied. Because of this, the nano module can also be used to do accurate nano scratch testing. The study of scratch and wear resistance of tooth material and filling materials adds to the overall usefulness of the Mechanical tester. Using a sharp 2-micron tip to quantitatively compare marring on filling materials will allow better prediction of the behavior in real applications. Multi-pass wear or direct rotative wear testing are also common tests providing important information on the long term viability.

Friction Evaluation at Extreme Low Speeds


Importance of Friction Evaluation at Low Speeds
Friction is the force that resists the relative motion of solid surfaces sliding against each other. When the relative motion of these two contact surfaces takes place, the friction at the interface converts the kinetic energy into heat. Such a process can also lead to wear of the material and thus performance degradation of the parts in use.
With a large stretch ratio, high resilience, as well as great waterproof properties and wear resistance, rubber is extensively applied in a variety of applications and products in which friction plays an important role, such as automobile tires, windshield wiper blades. shoe soles and many others. Depending on the nature and requirement of these applications, either high or low friction against different material is desired. As a consequence, a controlled and reliable measurement of friction of rubber against various surfaces becomes critical.
Measurement Objective
The coefficient of friction (COF) of rubber against different materials is measured in a controlled and monitored manner using the Nanovea Tribometer. In this study, we would like to showcase the capacity of Nanovea Tribometer for measuring the COF of different materials at extremely low speeds.
Results and Discussion
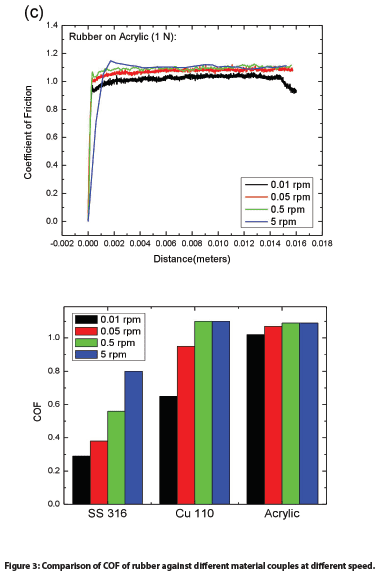
The coefficient of friction (COF) of rubber balls (6 mm dia., RubberMill) on three materials (Stainless steel SS 316, Cu 110 and optional Acrylic) was evaluated by Nanovea Tribometer. The tested metal samples were mechanically polished to a mirror-like surface finish before the measurement. The slight deformation of the rubber ball under the applied normal load created an area contact, which also helps to reduce the impact of asperities or inhomogeneity of sample surface finish to the COF measurements. The test parameters are summarized in Table 1.

The COF of a rubber ball against different materials at four different speeds is shown in Figure. 2, and the average COFs calculated automatically by the software are summarized and compared in Figure 3. It is interesting that the metal samples (SS 316 and Cu 110) exhibit significantly increased COFs as the rotational speed increases from a very low value of 0.01 rpm to 5 rpm -the COF value of the rubber/SS 316 couple increases from 0.29 to 0.8, and from 0.65 to 1.1 for the rubber/Cu 110 couple. This finding is in agreement with the results reported from several laboratories. As proposed by Grosch4 the friction of rubber is mainly determined by two mechanisms: (1) the adhesion between rubber and the other material, and (2) the energy losses due to the deformation of the rubber caused by surface asperities. Schallamach5 observed waves of detachment of rubber from the counter material across the interface between soft rubber spheres and a hard surface. The force for rubber to peel from the substrate surface and rate of waves of detachment can explain the different friction at different speeds during the test.
In comparison, the rubber/acrylic material couple exhibits high COF at different rotational speeds. The COF value slightly increases from ~ 1.02 to ~ 1.09 as the rotational speed increases from 0.01 rpm to 5 rpm. Such high COF is possibly attributed to stronger local chemical bonding at the contact face formed during the tests.

Conclusion

In this study, we show that at extremely low speeds, the rubber exhibits a peculiar frictional behavior – its friction against a hard surface increases with the increased speed of the relative movement. Rubber shows different friction when it slides on different materials. Nanovea Tribometer can evaluate the frictional properties of materials in a controlled and monitored manner at different speeds, allowing users to improve fundamental understanding of the friction mechanism of the materials and select the best material couple for targeted tribological engineering applications.
Nanovea Tribometer offers precise and repeatable wear and friction testing using ISO and ASTM compliant rotative and linear modes, with optional high-temperature wear, lubrication and tribo-corrosion modules available in one pre-integrated system. It is capable of controlling the rotational stage at extremely low speeds down to 0.01 rpm and monitor the evolution of friction in situ. Nanovea’s unmatched range is an ideal solution for determining the full range of tribological properties of thin or thick, soft or hard coatings, films, and substrates.
Stress Relaxation Measurement using Nanoindentation
INTRODUCTION
Viscoelastic materials are characterized as having both viscous and elastic material properties. These materials are subject to time-dependent stress decrease (stress ‘relaxation’) under constant strain, leading to a significant loss of initial contact force. Stress relaxation is dependent on the type of material, texture, temperature, initial stress, and time. Understanding stress relaxation is critical in selecting optimal materials that have the strength and flexibility (relaxation) required for specific applications.
Importance of Stress Relaxation Measurement

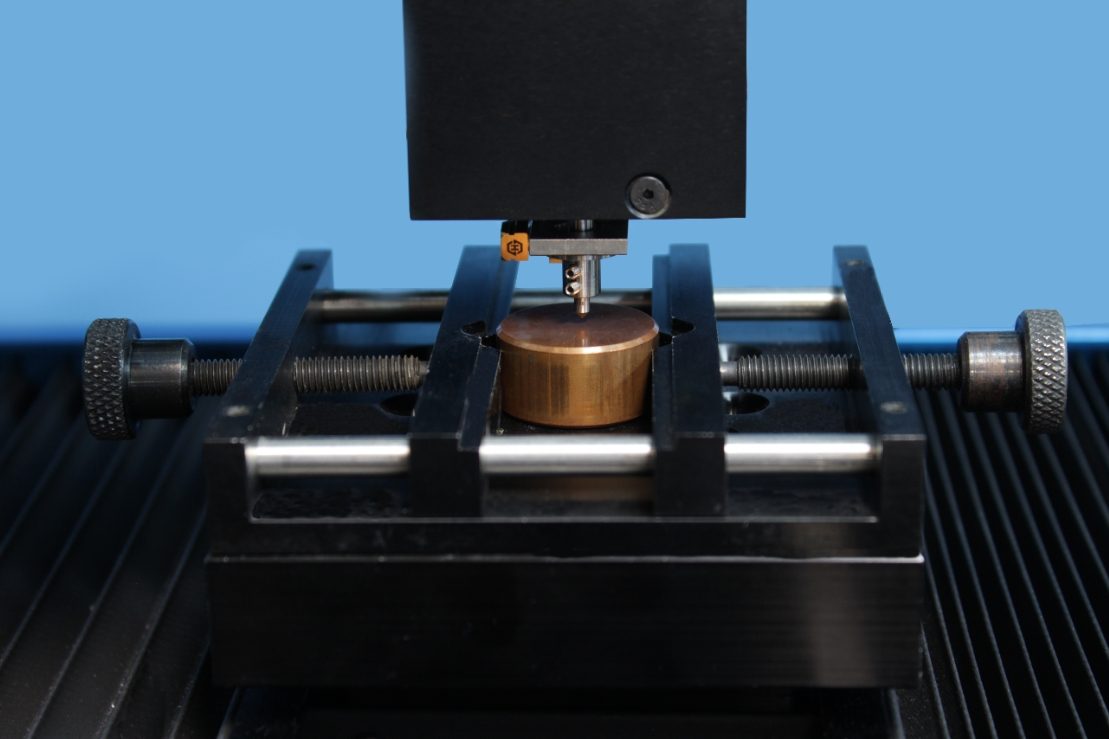
As per ASTM E328i, “Standard Test Methods for Stress Relaxation for Materials and Structures”, an external force is initially applied on a material or structure with an indenter until it reaches a predetermined maximum force. Once the maximum force is reached, the position of the indenter is held constant at this depth. Then the change in external force necessary to maintain the indenter’s position is measured as a function of time. The difficulty in stress relaxation testing is maintaining the depth constant. The Nanovea Mechanical Tester’s nanoindentation module accurately measures the stress relaxation by applying a closed (feedback) loop control of the depth with a piezo-electric actuator. The actuator reacts in real-time to keep the depth constant, while the change in load is measured and recorded by a highly sensitive load sensor. This test can be performed on virtually all types of materials without the need for stringent sample dimension requirements. Additionally, multiple tests can be performed on a single flat sample to ensure test repeatability
MEASUREMENT OBJECTIVE
In this application, the Nanovea Mechanical Tester’s nanoindentation module measures the stress relaxation behavior of an acrylic and copper sample. We showcase that the Nanovea Mechanical Tester is an ideal tool for evaluating the time-dependent viscoelastic behavior of polymer and metal materials.
TEST CONDITIONS
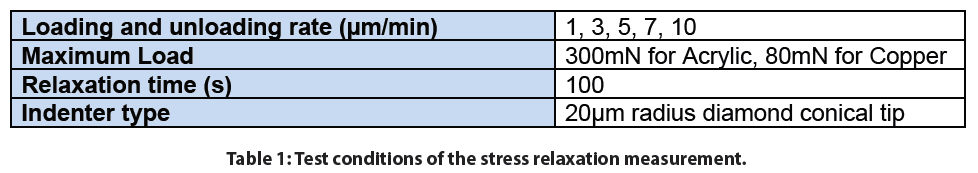
The stress relaxation of an acrylic and a copper sample was measured by the Nanovea Mechanical Tester’s nanoindentation module. Different indentation loading rates were applied ranging from 1 to 10 µm/min. The relaxation was measured at a fixed depth once the target maximum load was reached. A 100 second holding period was implemented at a fixed depth and the change in load was recorded as the holding time elapsed. All of the tests were conducted at ambient conditions (room temperature of 23 °C) and the indentation test parameters are summarized in Table 1.
RESULTS AND DISCUSSION
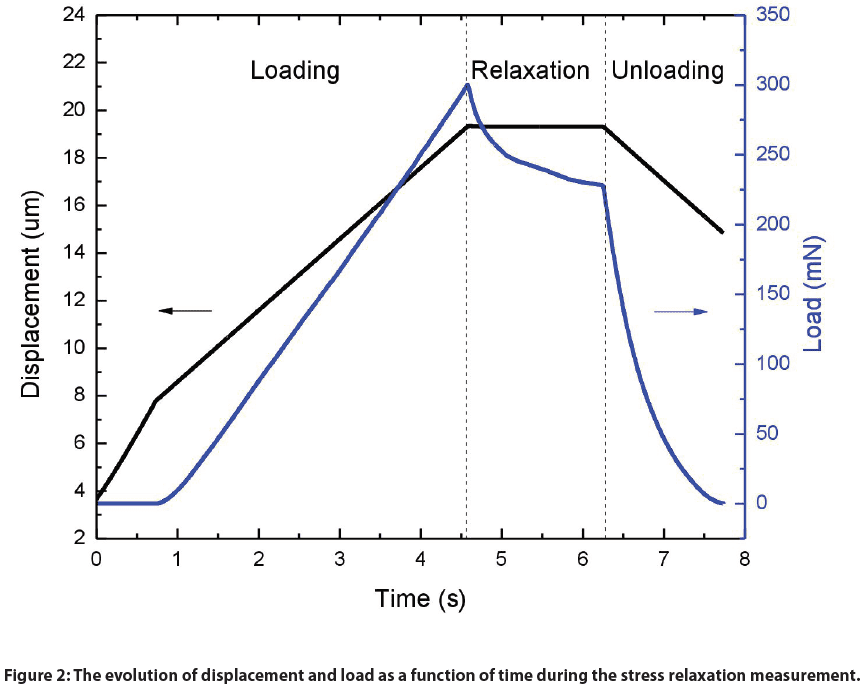
Figure 2 shows the evolution of displacement and load as a function of time during the stress relaxation measurement of an acrylic sample and an indentation loading rate of 3 µm/min as an example. The entirety of this test can be broken down into three stages: Loading, Relaxation and Unloading. During the Loading stage, the depth linearly increased as the load progressively increased. The Relaxation stage was initiated once the maximum load was reached. During this stage a constant depth was maintained for 100 seconds by using the closed feedback loop depth control feature of the instrument and it was observed that the load decreased over time. The entire test concluded with an unloading stage in order to remove the indenter from the acrylic sample.
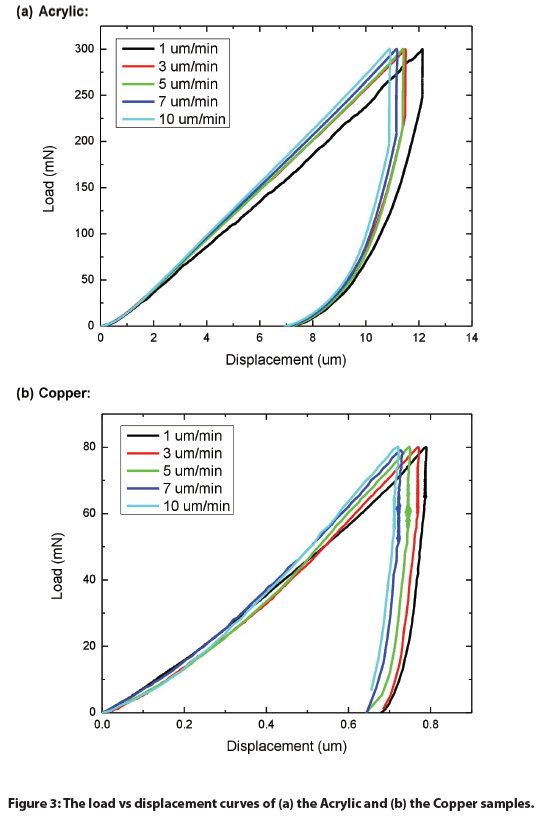
Additional indentation tests were conducted using the same indenter loading rates but excluding a relaxation (creep) period. Load vs. displacement plots were acquired from these tests and were combined in the graphs in Figure 3 for the acrylic and copper samples. As the indenter loading rate decreased from 10 to 1 µm/min, the load-displacement curve shifted progressively towards higher penetration depths for both Acrylic and Copper. Such a time-dependent increase in strain results from the viscoelastic creep effect of the materials. A lower loading rate allows a viscoelastic material to have more time to react to the external stress it experiences and to deform accordingly..
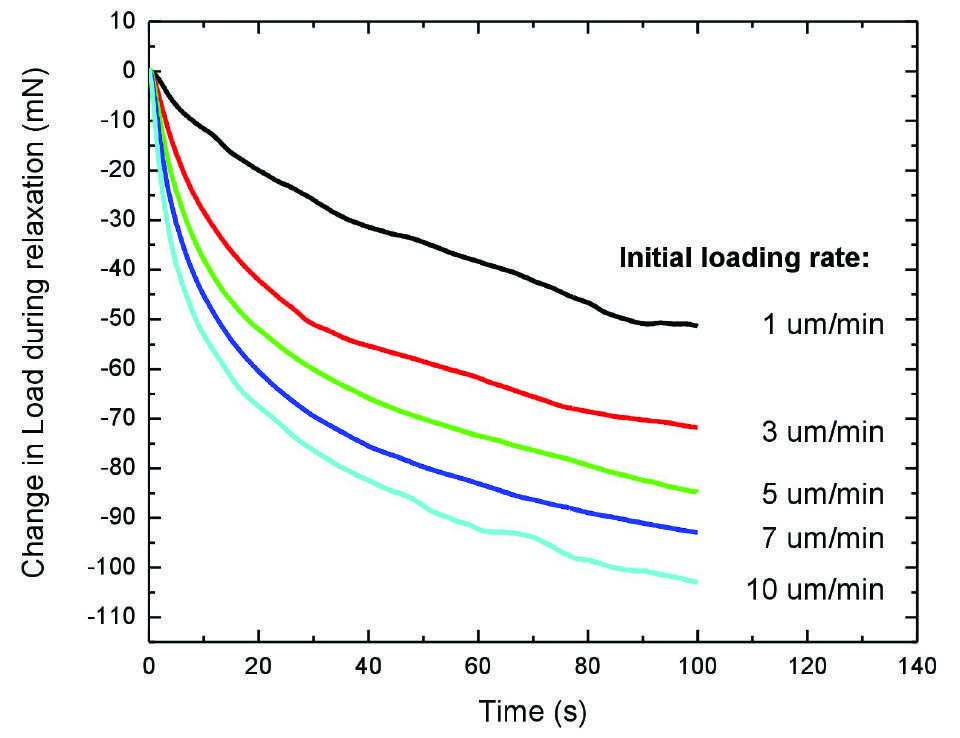
The evolution of load at a constant strain using different indentation loading rates were plotted in Figure 4 for both materials tested. The load decreased at a higher rate in the early stages of the relaxation stage (100 second hold period) of the tests and slowed down once the hold time reached ~50 seconds. Viscoelastic materials, such as polymers and metals, exhibit greater load loss rate when they are subjected to higher indentation loading rates. The load loss rate during relaxation increased from 51.5 to 103.2 mN for Acrylic, and from 15.0 to 27.4 mN for Copper, respectively, as the indentation loading rate increased from 1 to 10 µm/min, as summarized in Figure 5.


As mentioned In ASTM Standard E328ii, the major problem encountered in stress relaxation tests is an instrument’s inability of maintaining a constant strain/depth. The Nanovea Mechanical Tester provides excellent accurate stress relaxation measurements due to its ability to apply a closed feedback loop control of the depth between the fast acting piezo-electric actuator and the independent capacitor depth sensor. During the relaxation stage, the piezo-electric actuator adjusts the indenter to maintain its constant depth constraint in real-time while the change in load is measured and recorded by an independent high precision load sensor.
CONCLUSION

The stress relaxation of an acrylic and a copper sample were measured using the nanoindentation module of the Nanovea Mechanical Tester at different loading rates. A greater maximum depth is reached when indentations are performed at lower loading rates due to the creep effect of the material during loading. Both the acrylic and the copper sample exhibit stress relaxation behavior when the indenter position at a targeted maximum load is held constant. Larger changes in load loss during the relaxation stage were observed for the tests with higher indentation loading rates.
The stress relaxation test produced by the Nanovea Mechanical Tester showcase the instruments ability to quantify and reliably measure the time-dependent viscoelastic behavior of polymer and metal materials. It has an unmatched multi-function Nano and Micro modules on a single platform. Humidity and temperature control modules can be paired with these instruments for environmental testing capabilities applicable to a wide range of industries. Both the Nano and Micro modules include scratch testing, hardness testing, and wear testing modes, providing the widest and most user-friendly range of mechanical testing capabilities available on a single system.
Understanding Coating Failures using Scratch Testing
Introduction:
Surface engineering of materials plays a significant role in a variety of functional applications, ranging from decorative appearance to protecting the substrates from wear, corrosion and other forms of attacks. An important and overriding factor that determines the quality and service lifetime of the coatings is their cohesive and adhesive strength.
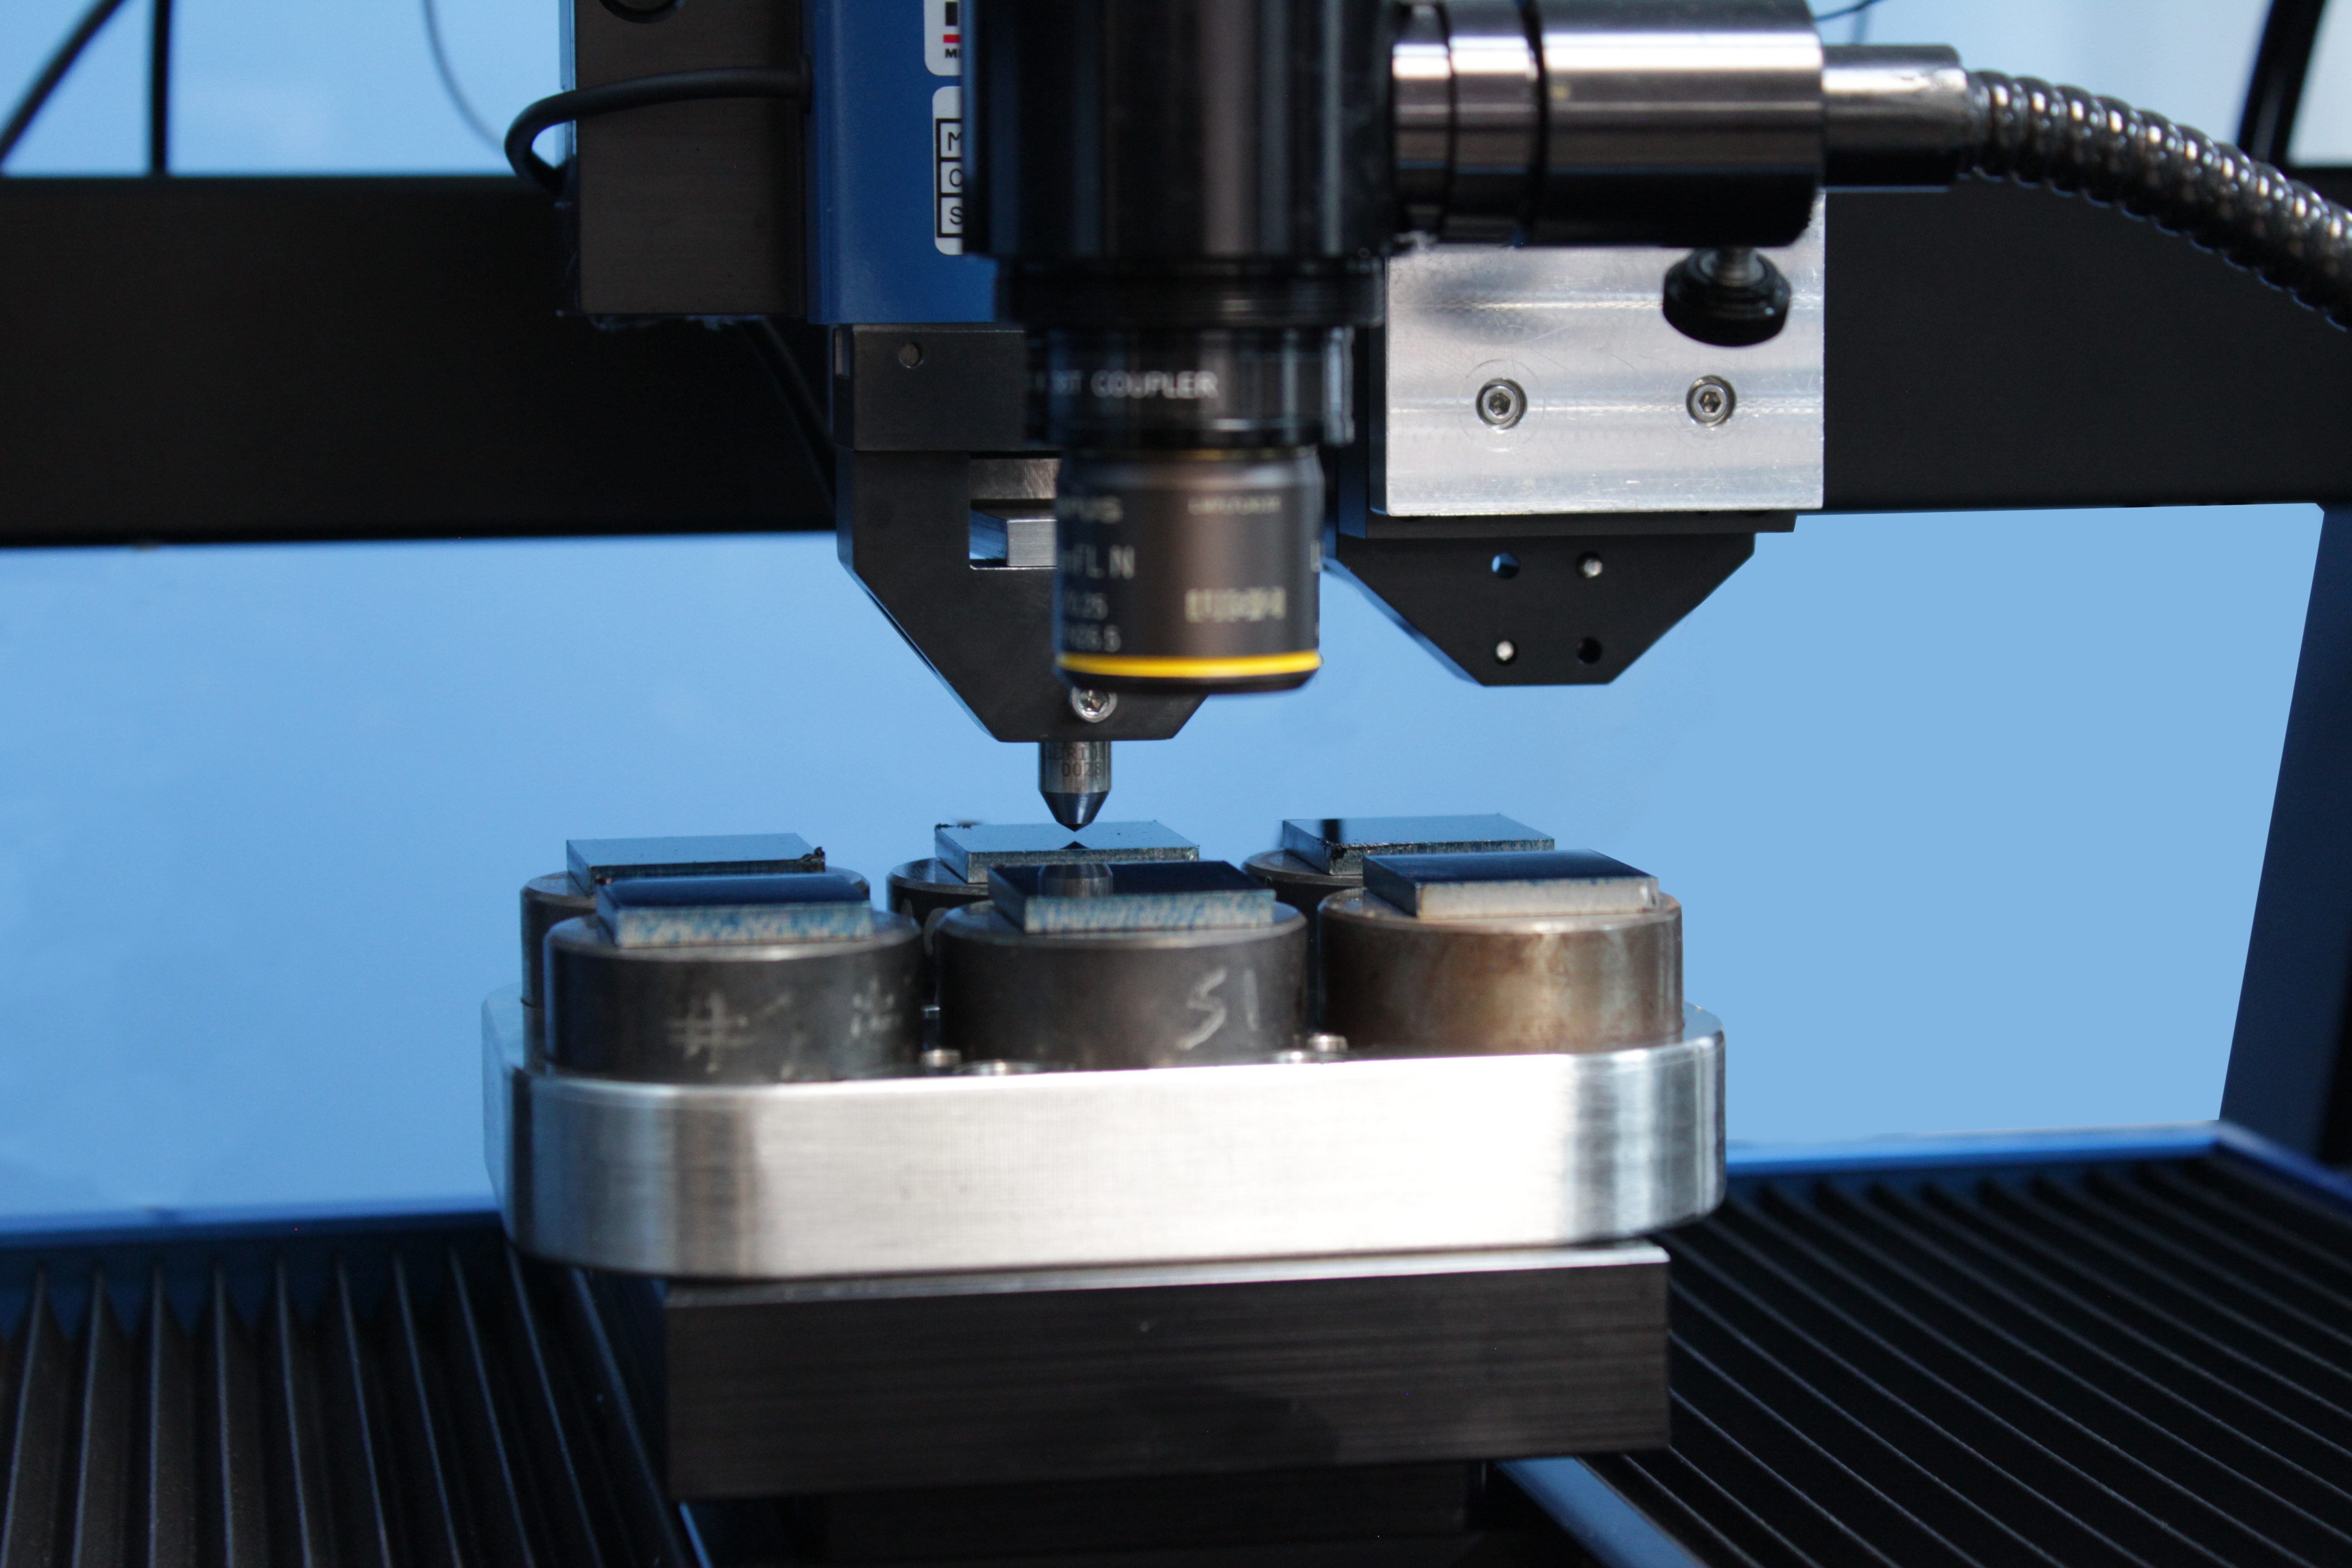
Multi Scratch Automation of Similar Samples using the PB1000 Mechanical Tester
Introduction :
Coatings are widely used in various industries because of their functional properties. A coating’s hardness, erosion resistance, low friction, and high wear resistance are just some of the many properties that make coatings important. A commonly used method to quantify these properties is scratch testing, this allows for a repeatable measurement of a coating’s adhesive and/or cohesive properties. By comparing the critical loads at which failure occurs, the intrinsic properties of a coating can be evaluated.
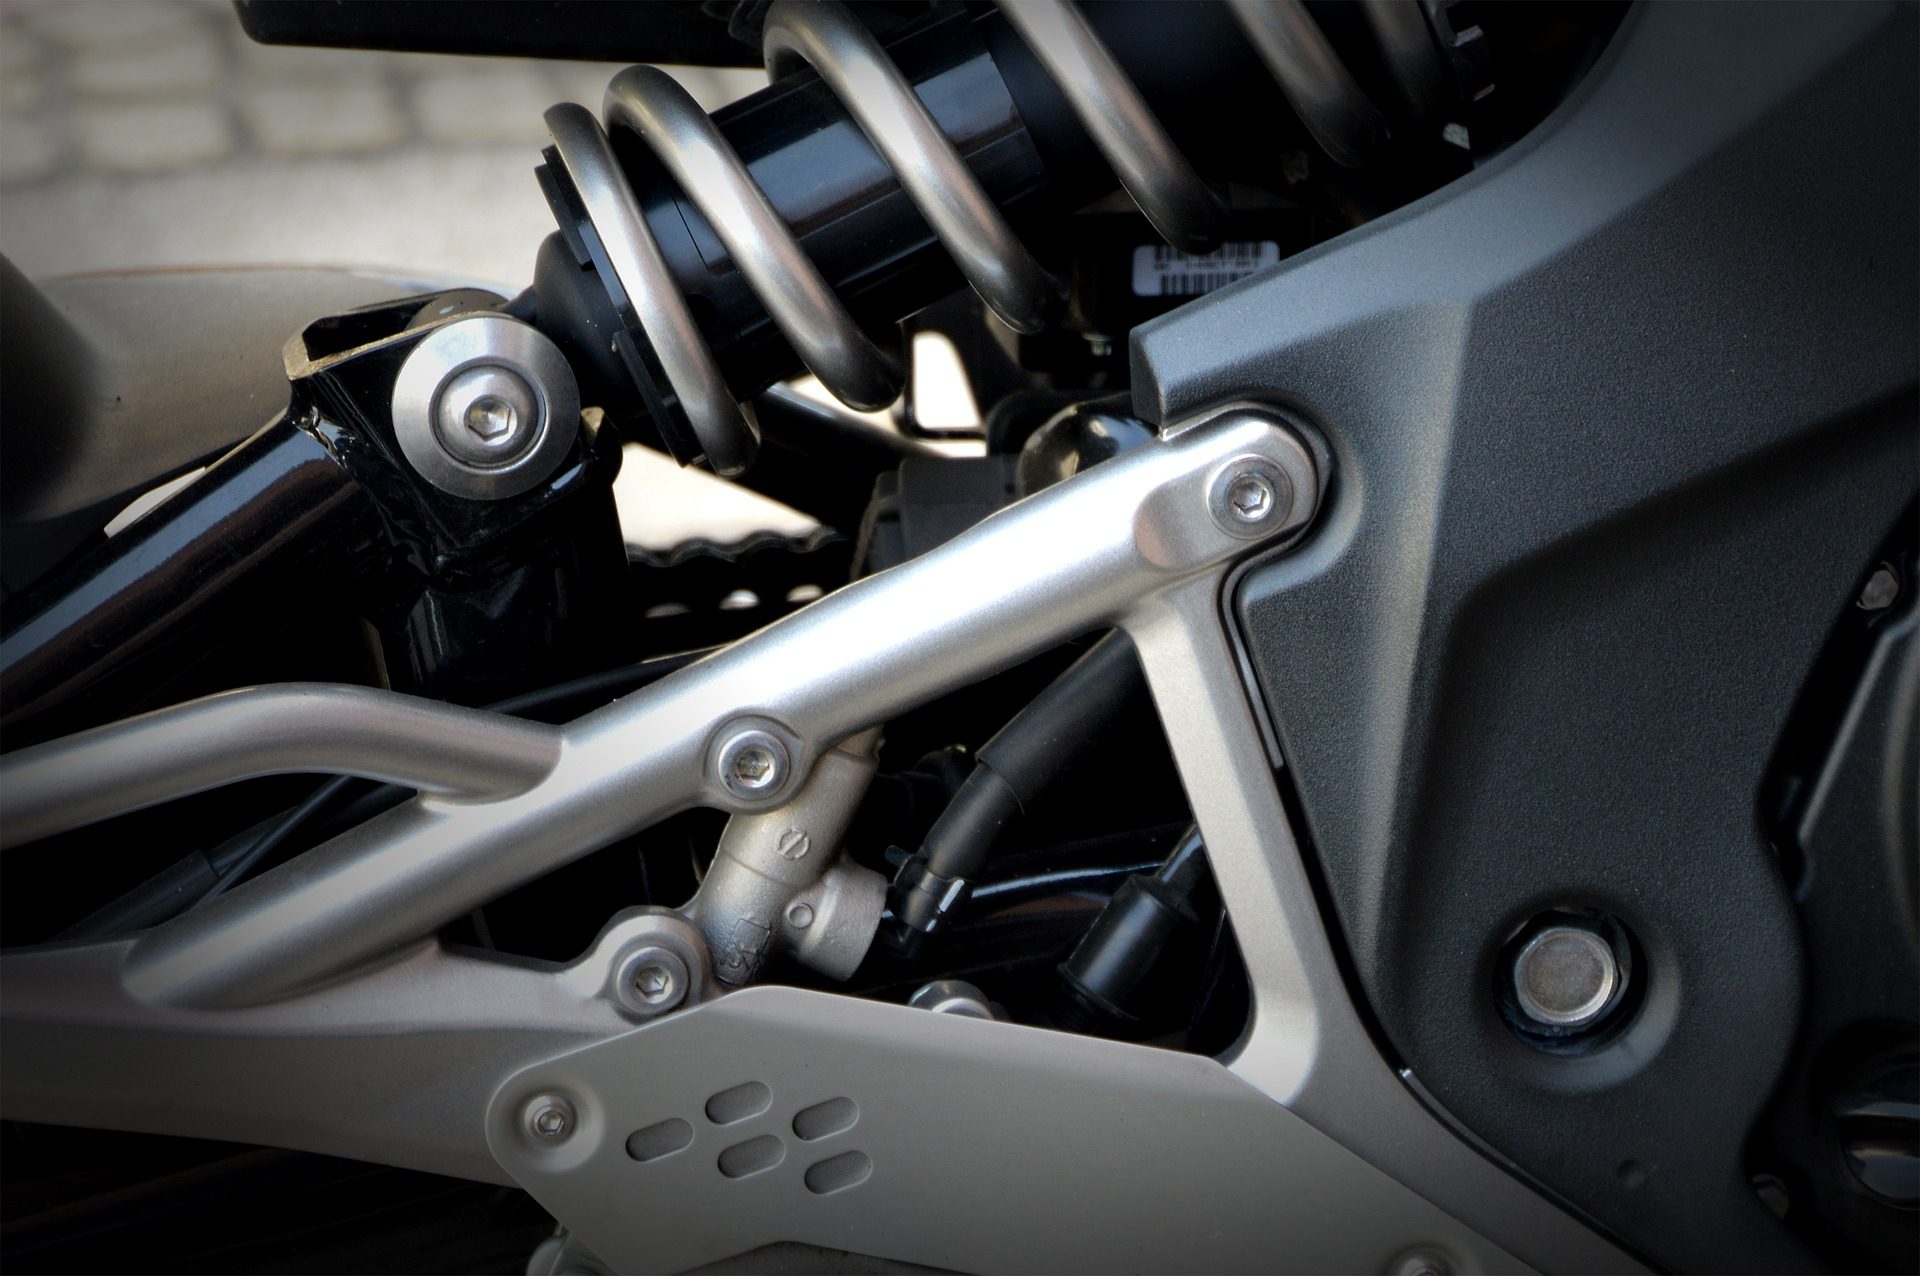
Nano Mechanical Characterization of Spring Constants
A spring’s ability to store mechanical energy has a long history of use. From bows for hunting to locks for doors, spring technology has been around for many centuries. Nowadays we rely on springs, be it from mattresses, pens, or automotive suspension, as they play a vital role in our daily lives. With such a wide variety of use and designs, the ability to quantify their mechanical properties is necessary.


Mechanical Broadview Map Selection Tool
We’ve all heard the term, time is money. Which is why many companies constantly seek methods of expediting and improving various processes, it saves time. When it comes to indentation testing, speed, efficiency and precision can be integrated into a quality control or R&D process when using one of our Nanovea Mechanical Testers. In this application note, we will be showcasing an easy way of saving time with our Nanovea Mechanical Tester and Broad View Map and Selection Tool software features.
Click to read the full application note!

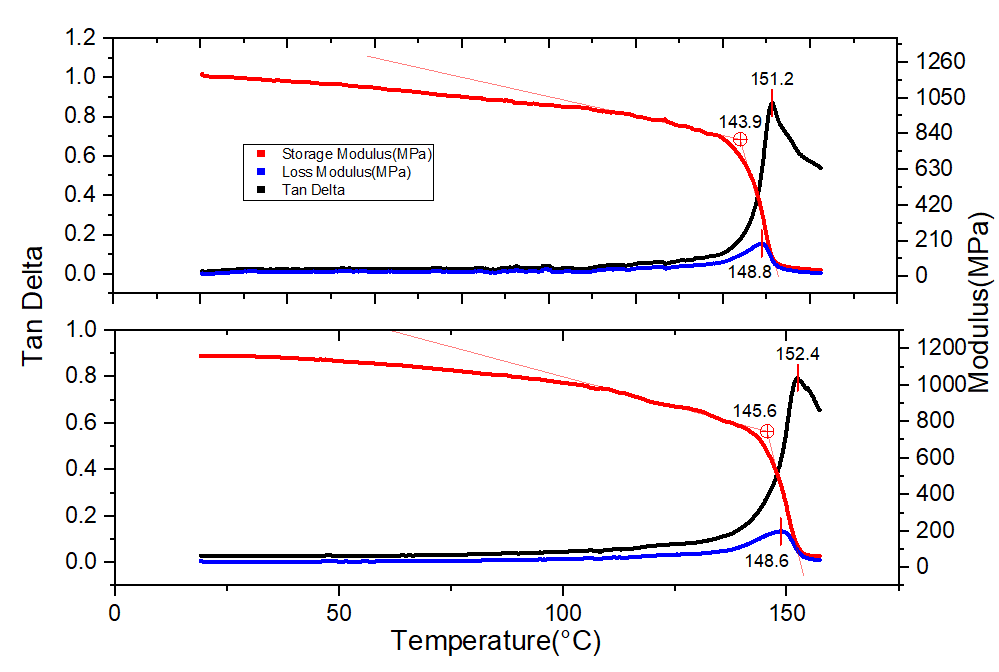
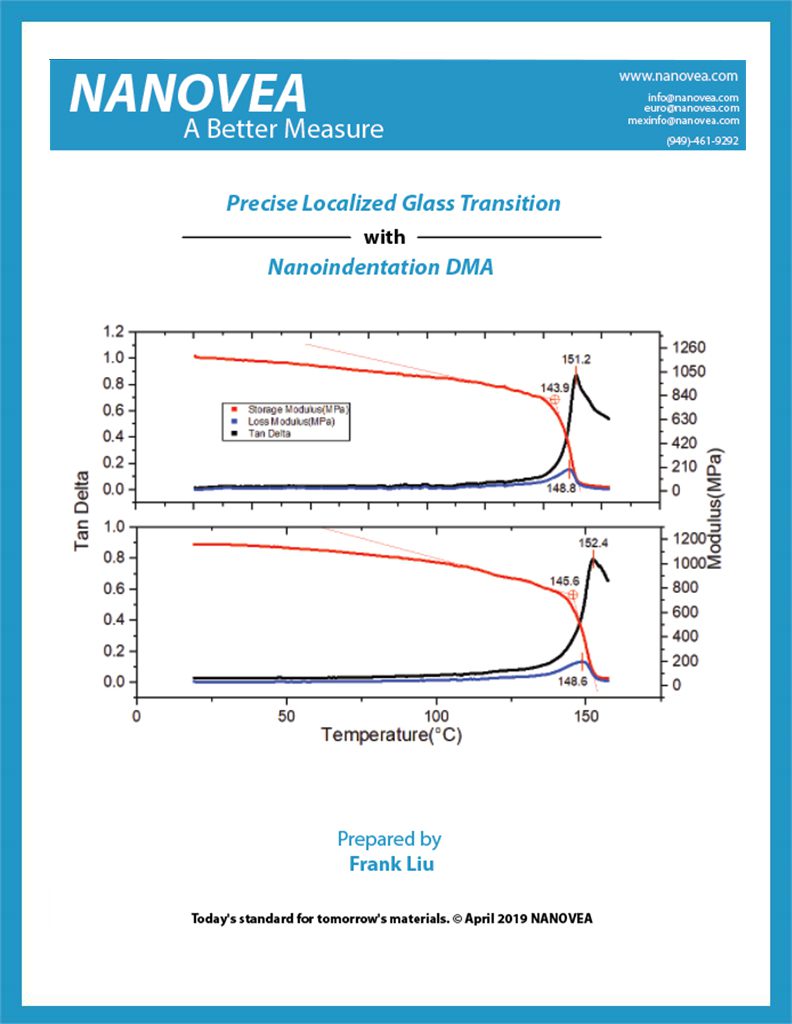
Precise Localized Glass Transition with Nanoindentation DMA
Imagine a scenario where a bulk sample is uniformly heated at a constant rate. As a bulk material heats up and approaches its melting point, it will start to lose its rigidity. If periodic indentations (hardness tests) are conducted at the same target force, the depth of each indent should be constantly increasing since the sample is becoming softer (see figure 1). This continues until the sample begins to melt. At this point, a large increase in the depth per indent will be observed. Using this concept, phase change in a material can be observed by using dynamic oscillations with a fixed force amplitude and measuring its displacement, i.e. Dynamic Mechanical Analysis (DMA).
Read about Precise Localized Glass Transition!

Compression on Soft, Flexible Materials
Importance of testing soft, flexible materials
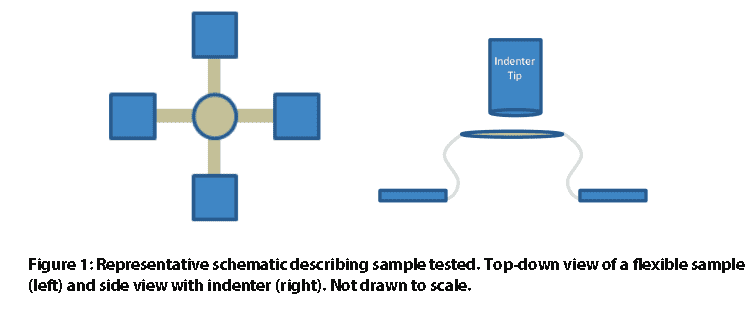
An example of very soft and flexible samples is a microelectromechanical system. MEMS are used in everyday commercial products like printers, mobile phones, and cars [1]. Their uses also include special functions, such as biosensors [2] and energy harvesting [3]. For their applications, MEMS must be able to reversibly transition between their original configuration to a compressed configuration repeatedly [4]. To understand how the structures will react to mechanical forces, compression testing can be conducted. Compression testing can be utilized to test and tune various MEMS configurations as well as testing upper and lower force limits for these samples.
The Nanovea Mechanical Tester Nano Module’s ability to accurately collect data at very low loads and travel over 1mm of distance makes it ideal for testing the soft and exible samples. By having independent load and depth sensors, large indenter displacement does not affect the readings by the load sensor. The ability to carry out low-load testing over a range of more than 1mm of indenter travel makes our system unique compared to other nanoindentation systems. In comparison, a reasonable travel distance for a nanoscale indentation system is typically below 250μm.
Measurement Objective
In this case study, Nanovea conducted compression testing on two uniquely di erent flexible, spring-like samples. We showcase our ability to conduct compression at very low loads and record large displacement while accurately obtaining data at low loads and how this can be applied to the MEMS industry. Due to privacy policies, the samples and their origin will not be revealed in this study
Measurement Parameters
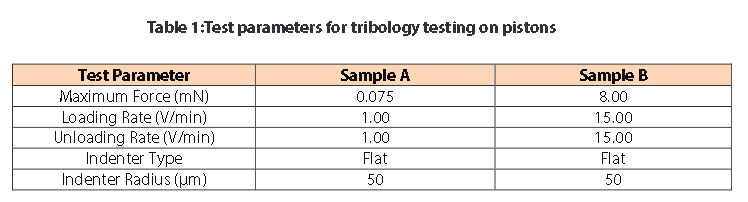
Note: The loading rate of 1 V/min is proportional to approximately 100μm of displacement when the indenter is in the air.
Results and Discussion
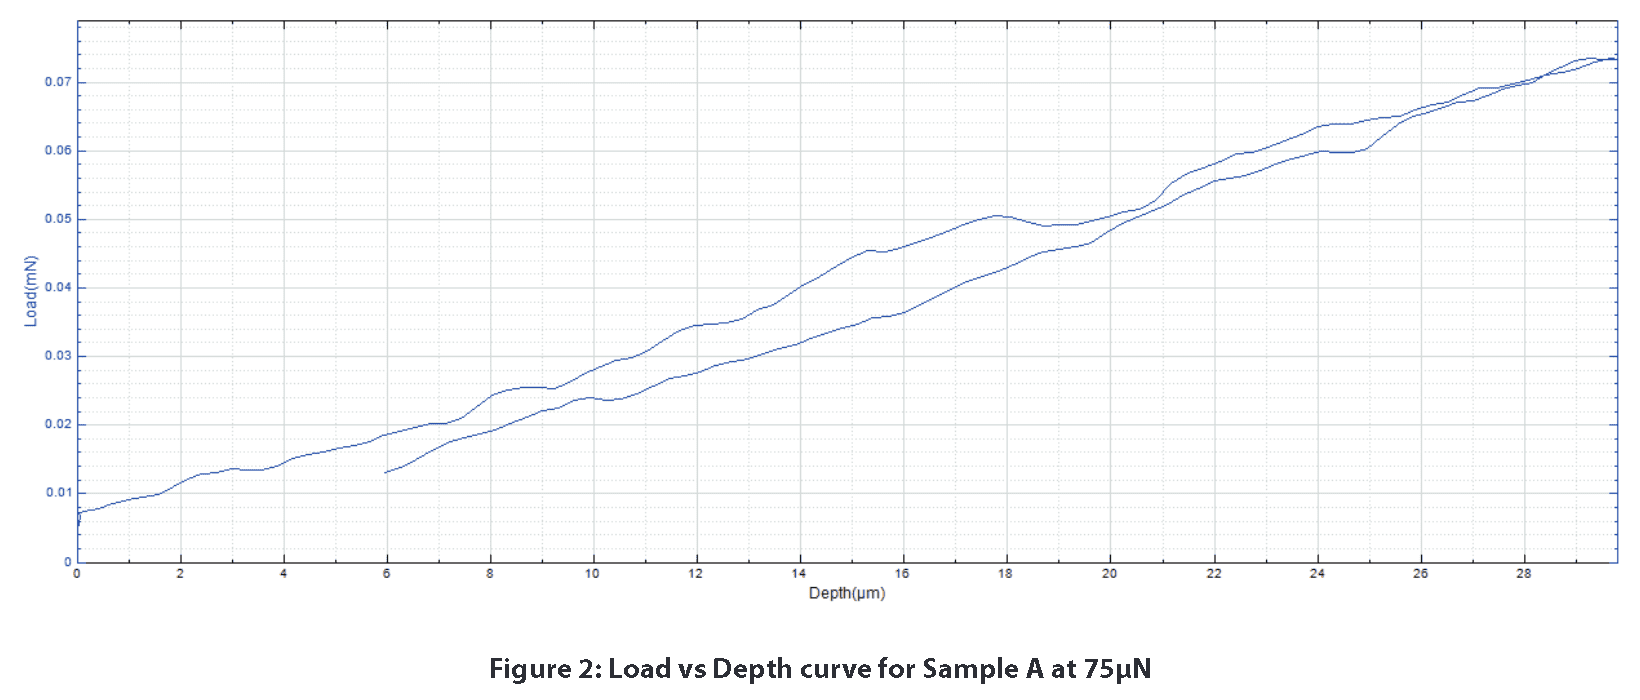
The sample’s response to mechanical forces can be seen in the load vs depth curves. Sample A only displays linear elastic deformation with the test parameters listed above. Figure 2 is a great example of the stability that can be achieved for a load vs. depth curve at 75μN. Due to the load and depth sensors stability, it would be easy to perceive any signi cant mechanical response from the sample.
Sample B displays a different mechanical response from Sample A. Past 750μm of depth, fracture-like behavior in the graph begins to appear. This is seen with the sharp drops in load at 850 and 975μm of depth. Despite traveling at a high loading rate for more than 1mm over a range of 8mN, our highly sensitive load and depth sensors allow the user to obtain the sleek load vs depth curves below.
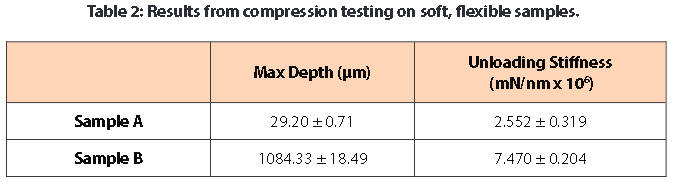
The stiffness was calculated from the unloading portion of the load vs depth curves. Stiffness reflects how much force is necessary to deform the sample. For this stiffness calculation, a pseudo Poisson’s ratio of 0.3 was used since the actual ratio of the material is not known. In this case, Sample B proved to be stiffer than Sample A.

Conclusion
Two diff erent flexible samples were tested under compression using the Nanovea Mechanical Tester’s Nano Module. The tests were conducted at very low loads (<80μN) and over a large depth range (>1mm). Nano-scaled compression testing with the Nano Module has shown the module’s ability to test very soft and flexible samples. Additional testing for this study could address how repeated cyclical loading a ects the elastic recovery aspect of the spring-like samples via the Nanovea Mechanical Tester’s multi-loading option.
For more information on this testing method, feel free to contact us at info@nanovea.com and for additional application notes please browse our extensive Application Note digital library.
References
[1] “Introduction and Application Areas for MEMS.” EEHerald, 1 Mar. 2017, www.eeherald.com/section/design-guide/mems_application_introduction.html.
[2] Louizos, Louizos-Alexandros; Athanasopoulos, Panagiotis G.; Varty, Kevin (2012). “Microelectromechanical Systems and Nanotechnology. A Platform for the Next Stent Technological Era”. Vasc Endovascular Surg.46 (8): 605–609. doi:10.1177/1538574412462637. PMID 23047818.
[3] Hajati, Arman; Sang-Gook Kim (2011). “Ultra-wide bandwidth piezoelectric energy harvesting”. AppliedPhysics Letters. 99 (8): 083105. doi:10.1063/1.3629551.
[4] Fu, Haoran, et al. “Morphable 3D mesostructures and microelectronic devices by multistable bucklingmechanics.” Nature materials 17.3 (2018): 268.

Viscoelastic Analysis of Rubber
Tires are subjected to cyclical high deformations when vehicles are running on the road. When exposed to harsh road conditions, the service lifetime of the tires is jeopardized by many factors, such as the wear of the thread, the heat generated by friction, rubber aging, and others.
As a result, tires usually have composite layer structures made of carbon-filled rubber, nylon cords, and steel wires, etc. In particular, the composition of rubber at different areas of the tire systems is optimized to provide different functional properties, including but not limited to wear resistant thread, cushion rubber layer, and hard rubber base layer.
A reliable and repeatable test of the viscoelastic behavior of rubber is critical in quality control and R&D of new tires, as well as evaluation of the life span of old tires. Dynamic Mechanical Analysis(DMA) during Nanoindentation is a technique of characterizing the viscoelasticity. When controlled oscillatory stress is applied, the resulting strain is measured, allowing users to determine the complex modulus of the tested materials.