INTRODUCTION
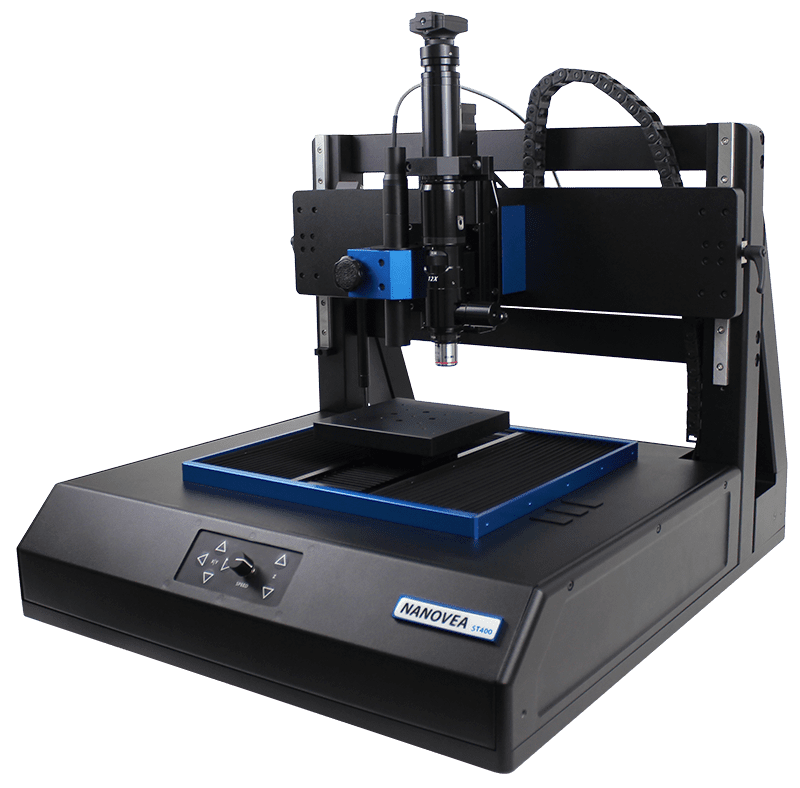
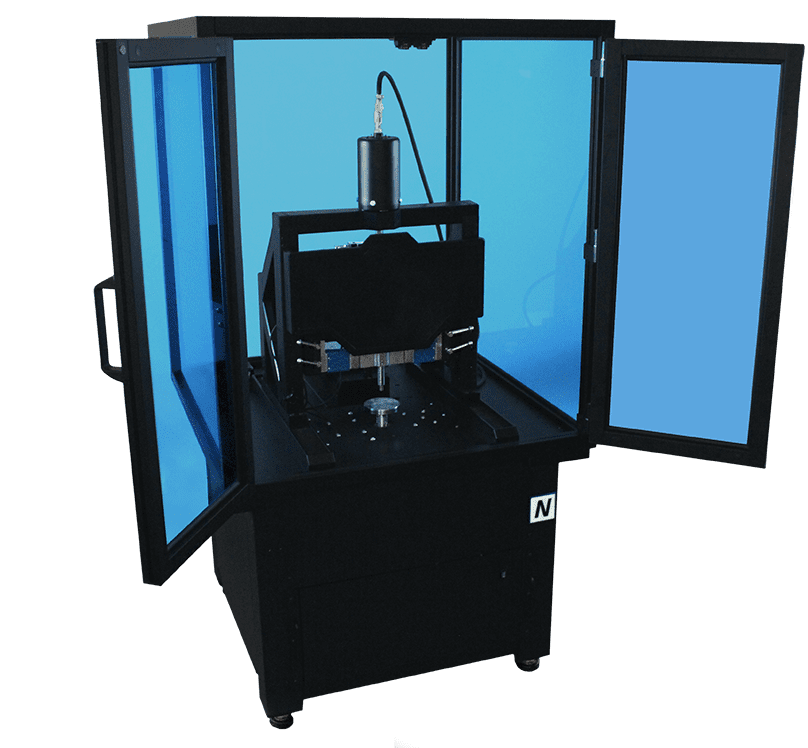
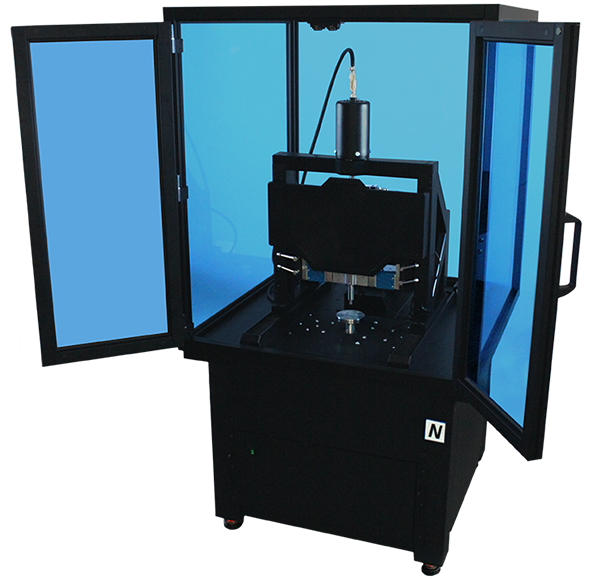
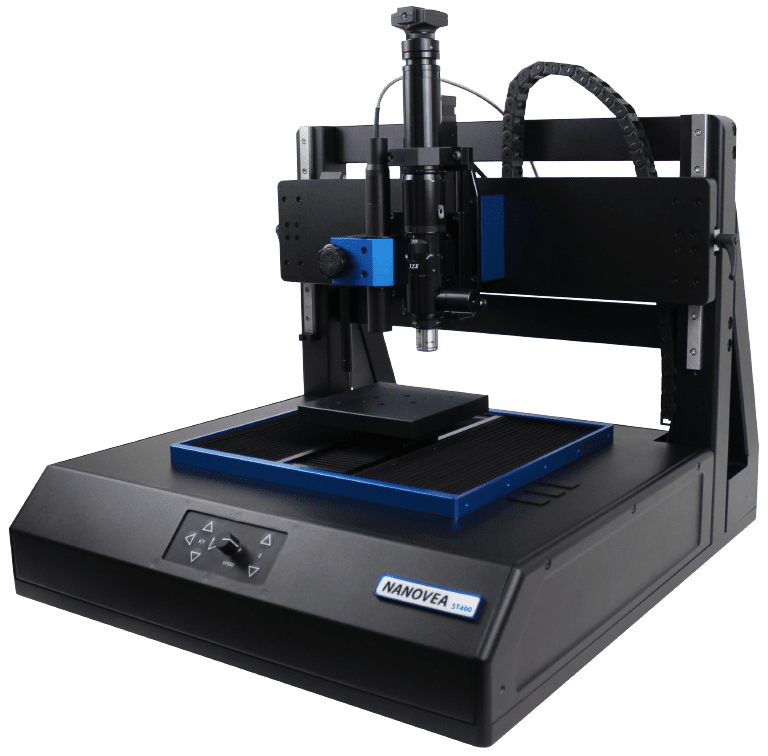
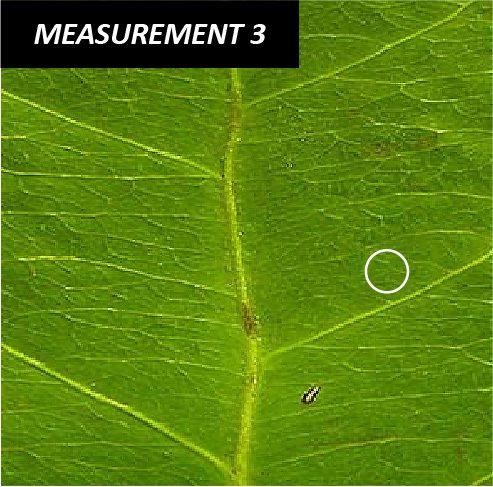
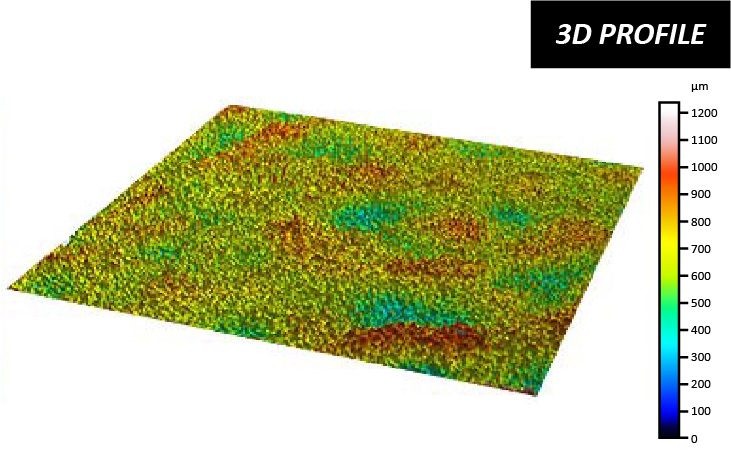
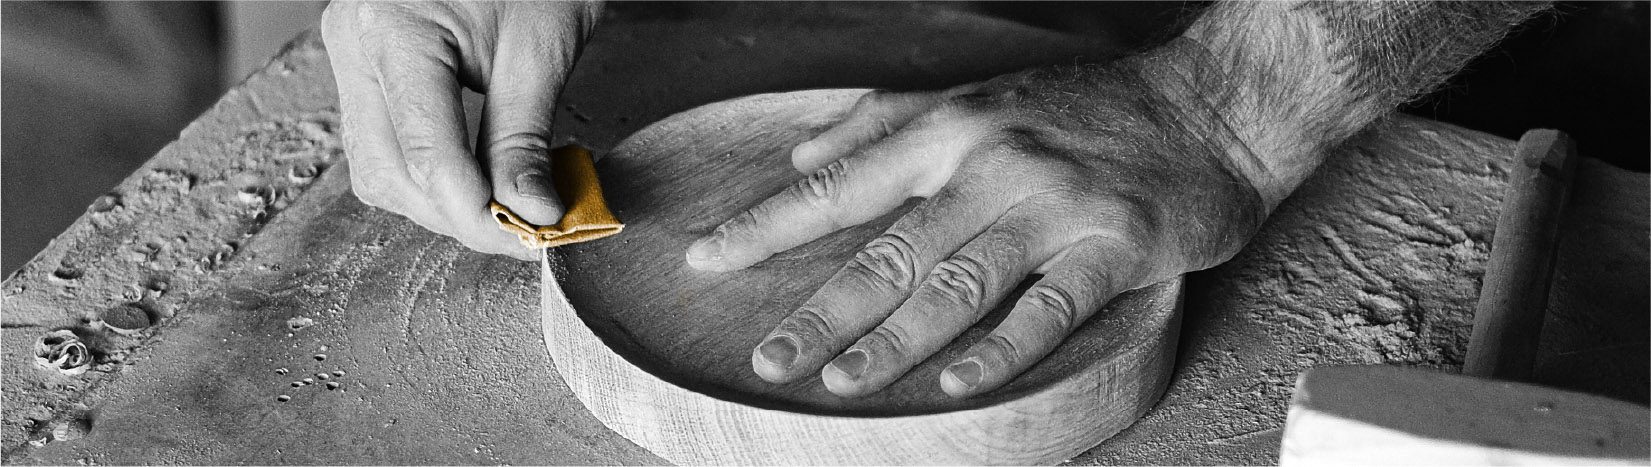
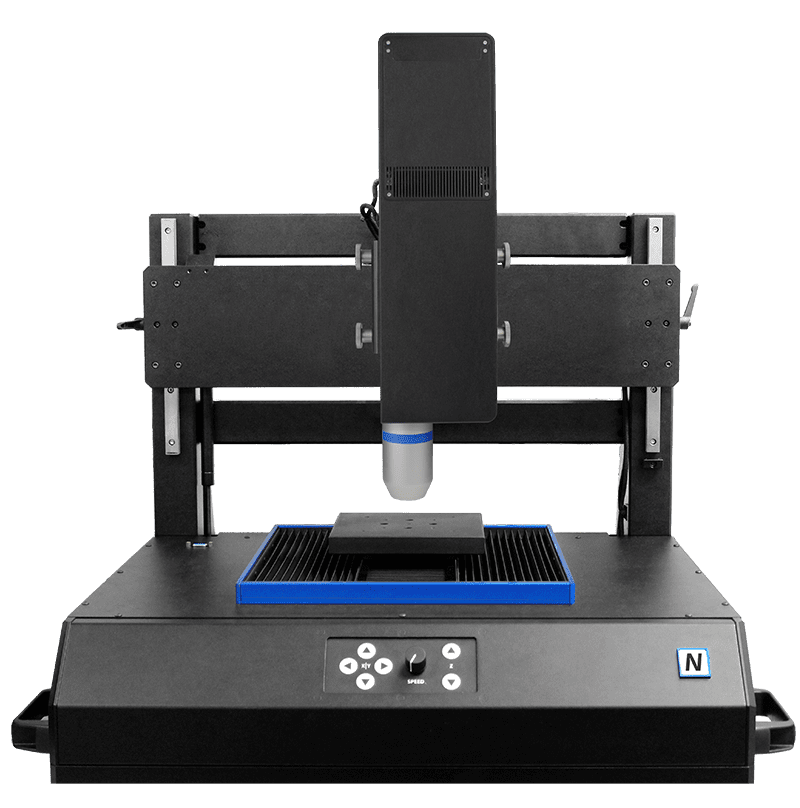
Fractography is the study of features on fractured surfaces and has historically been investigated via Microscope or SEM. Depending on the size of the feature, a microscope (macro features) or SEM (nano and micro features) are selected for the surface analysis. Both ultimately allowing for the identification of the fracture mechanism type. Although effective, the Microscope has clear limitations and the SEM in most cases, other than atomic-level analysis, is unpractical for fracture surface measurement and lacks broader use capability. With advances in optical measurement technology, the NANOVEA 3D Non-Contact Profilometer is now considered the instrument of choice, with its ability to provide nano through macro-scale 2D & 3D surface measurements
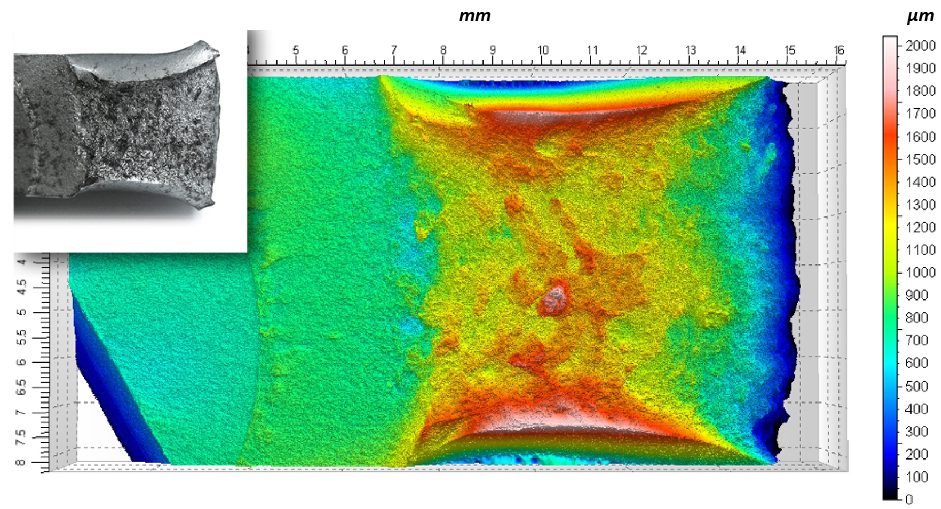
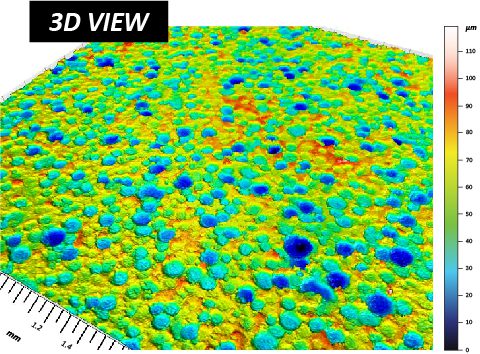
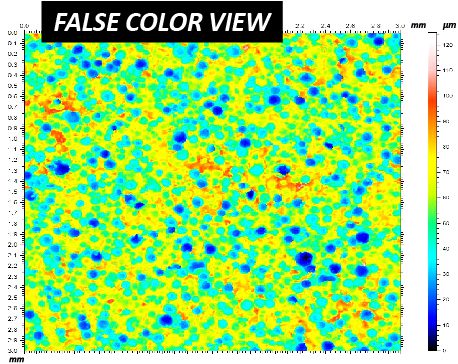
IMPORTANCE OF 3D NON-CONTACT PROFILOMETER FOR FRACTURE INSPECTION
Unlike an SEM, a 3D Non-Contact Profilometer can measure nearly any surface, sample size, with minimal sample prep, all while offering superior vertical/horizontal dimensions to that of an SEM. With a profiler, nano through macro range features are captured in a single measurement with zero influence from sample reflectivity. Easily measure any material: transparent, opaque, specular, diffusive, polished, rough etc. The 3D Non-Contact Profilometer provides broad and user-friendly capability to maximize surface fracture studies at a fraction of the cost of an SEM.