USA/GLOBAL: +1-949-461-9292
EUROPE: +39-011-3052-794
CONTACT US

Category: Profilometry Testing


Polymer Belt Wear and Friction using a Tribometer

POLYMER BELTS

WEAR AND FRICTION USING a TRIBOMETER

Prepared by

DUANJIE LI, PhD

INTRODUCTION

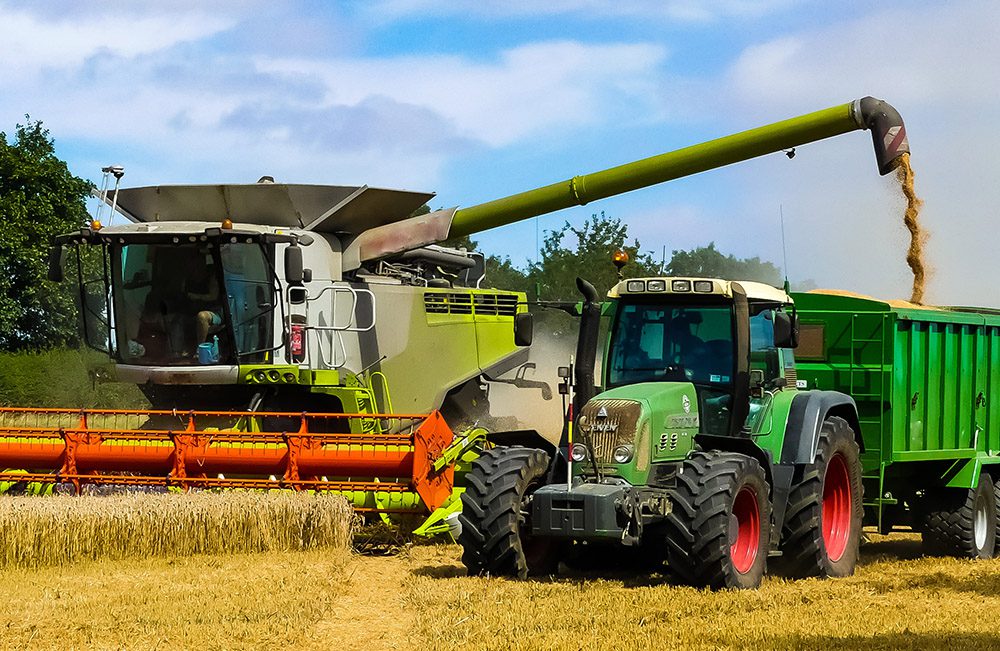
Belt drive transmits power and tracks relative movement between two or more rotating shafts. As a simple and inexpensive solution with minimal maintenance, belt drives are widely used in a variety of applications, such as bucksaws, sawmills, threshers, silo blowers and conveyors. Belt drives can protect the machinery from overload as well as damp and isolate vibration.

IMPORTANCE OF WEAR EVALUATION FOR BELT DRIVES

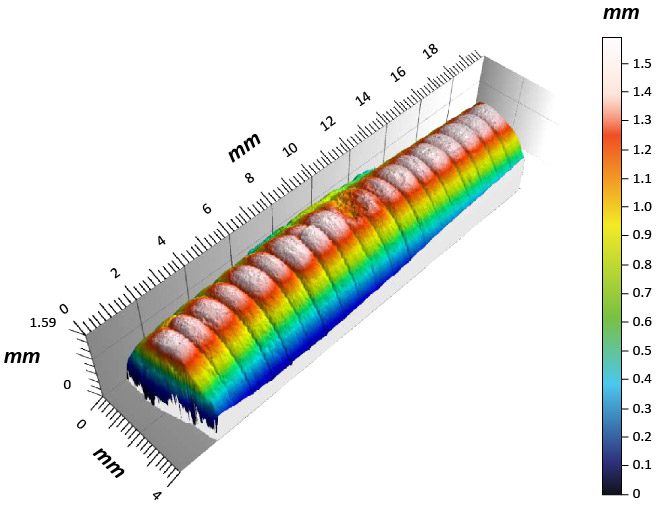
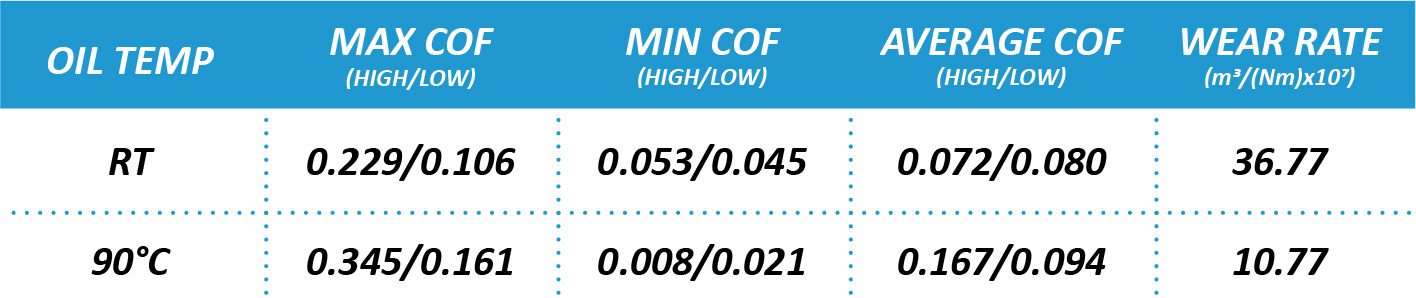
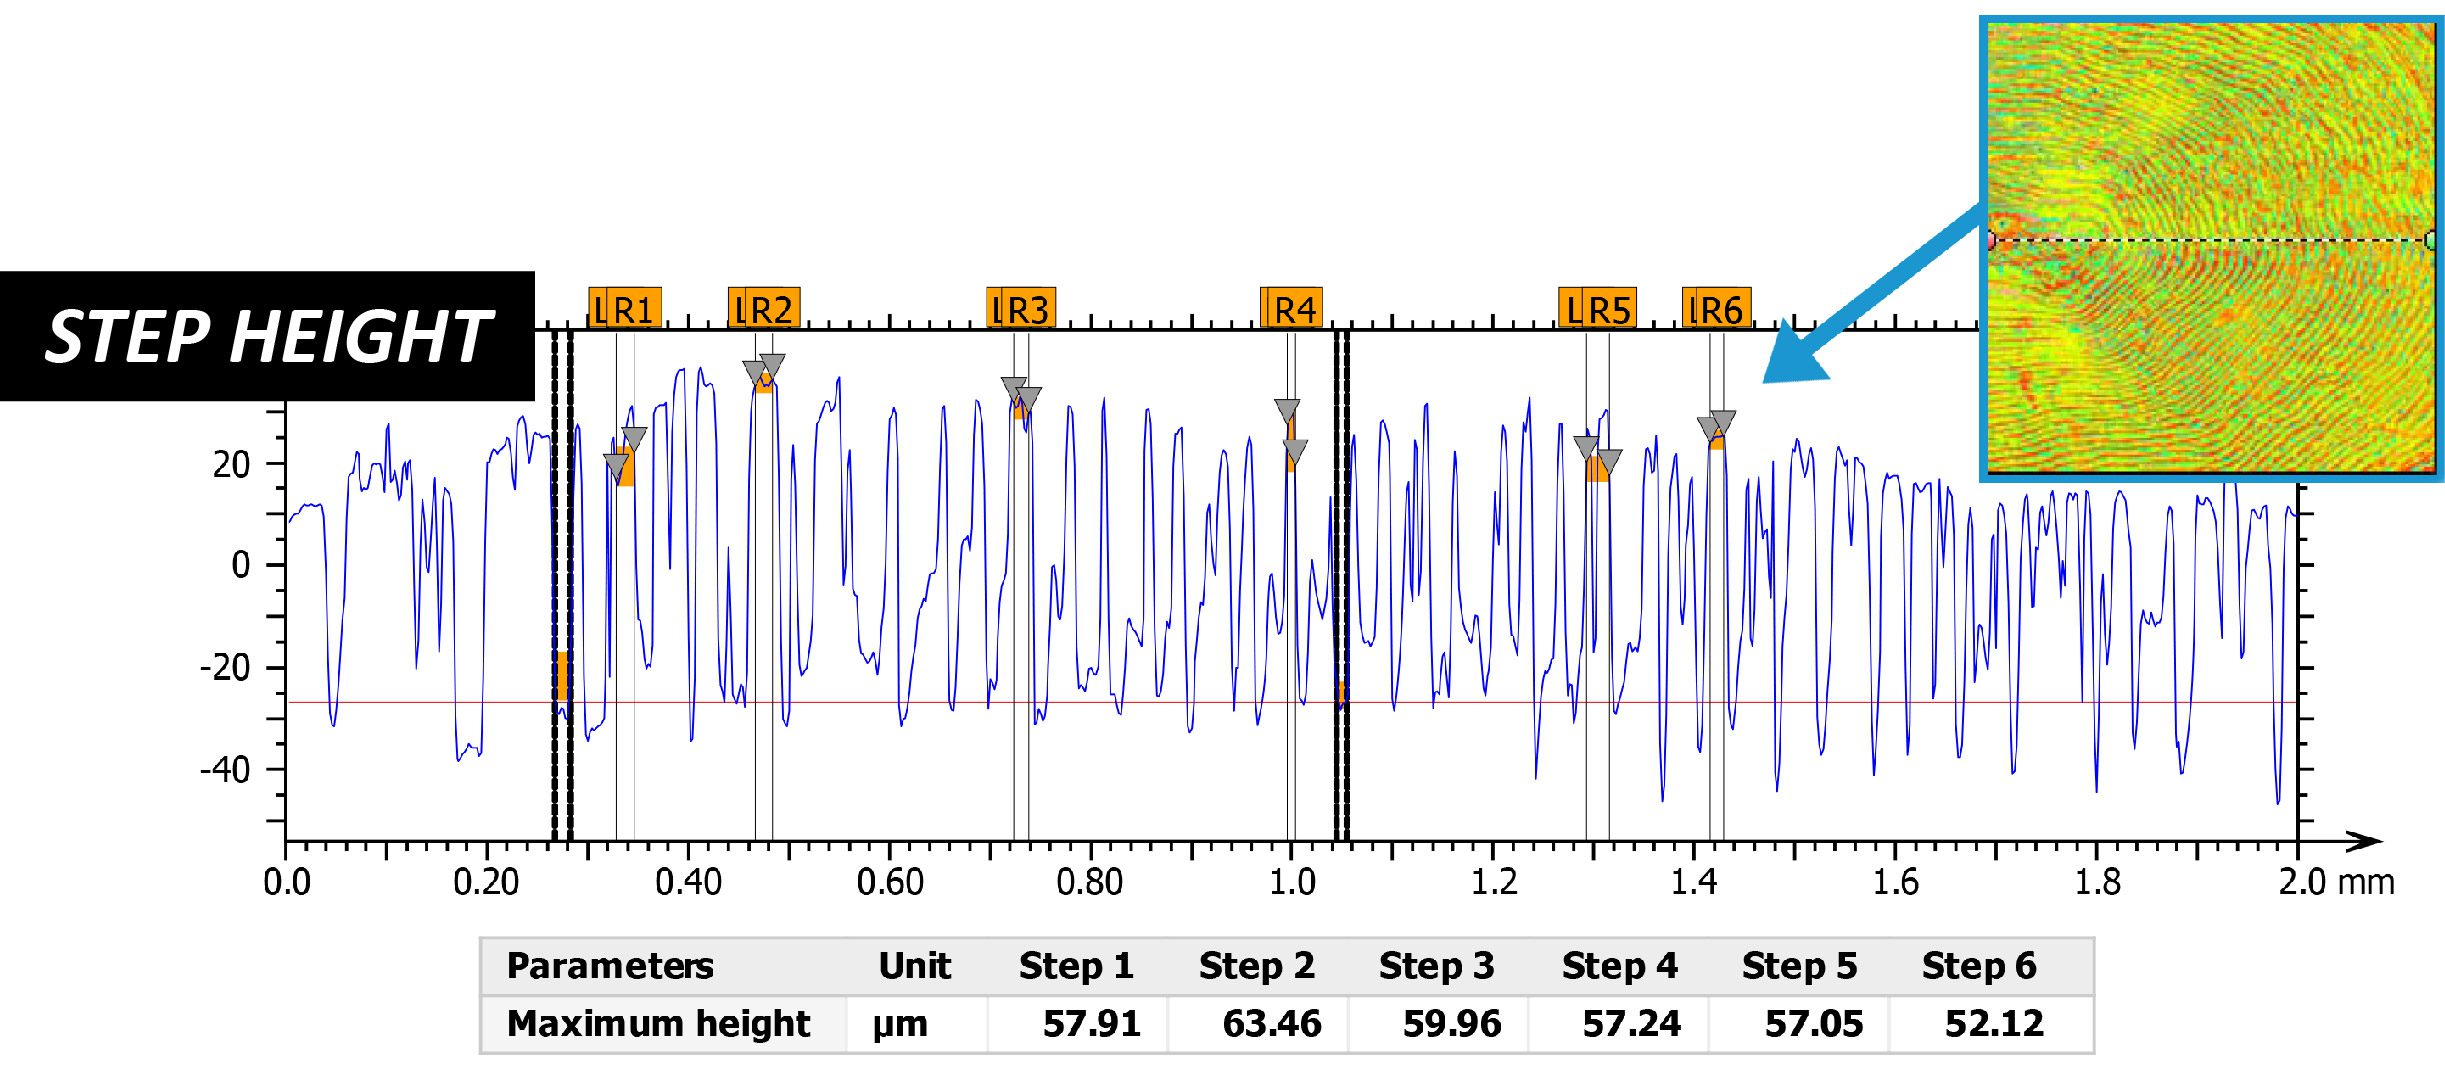
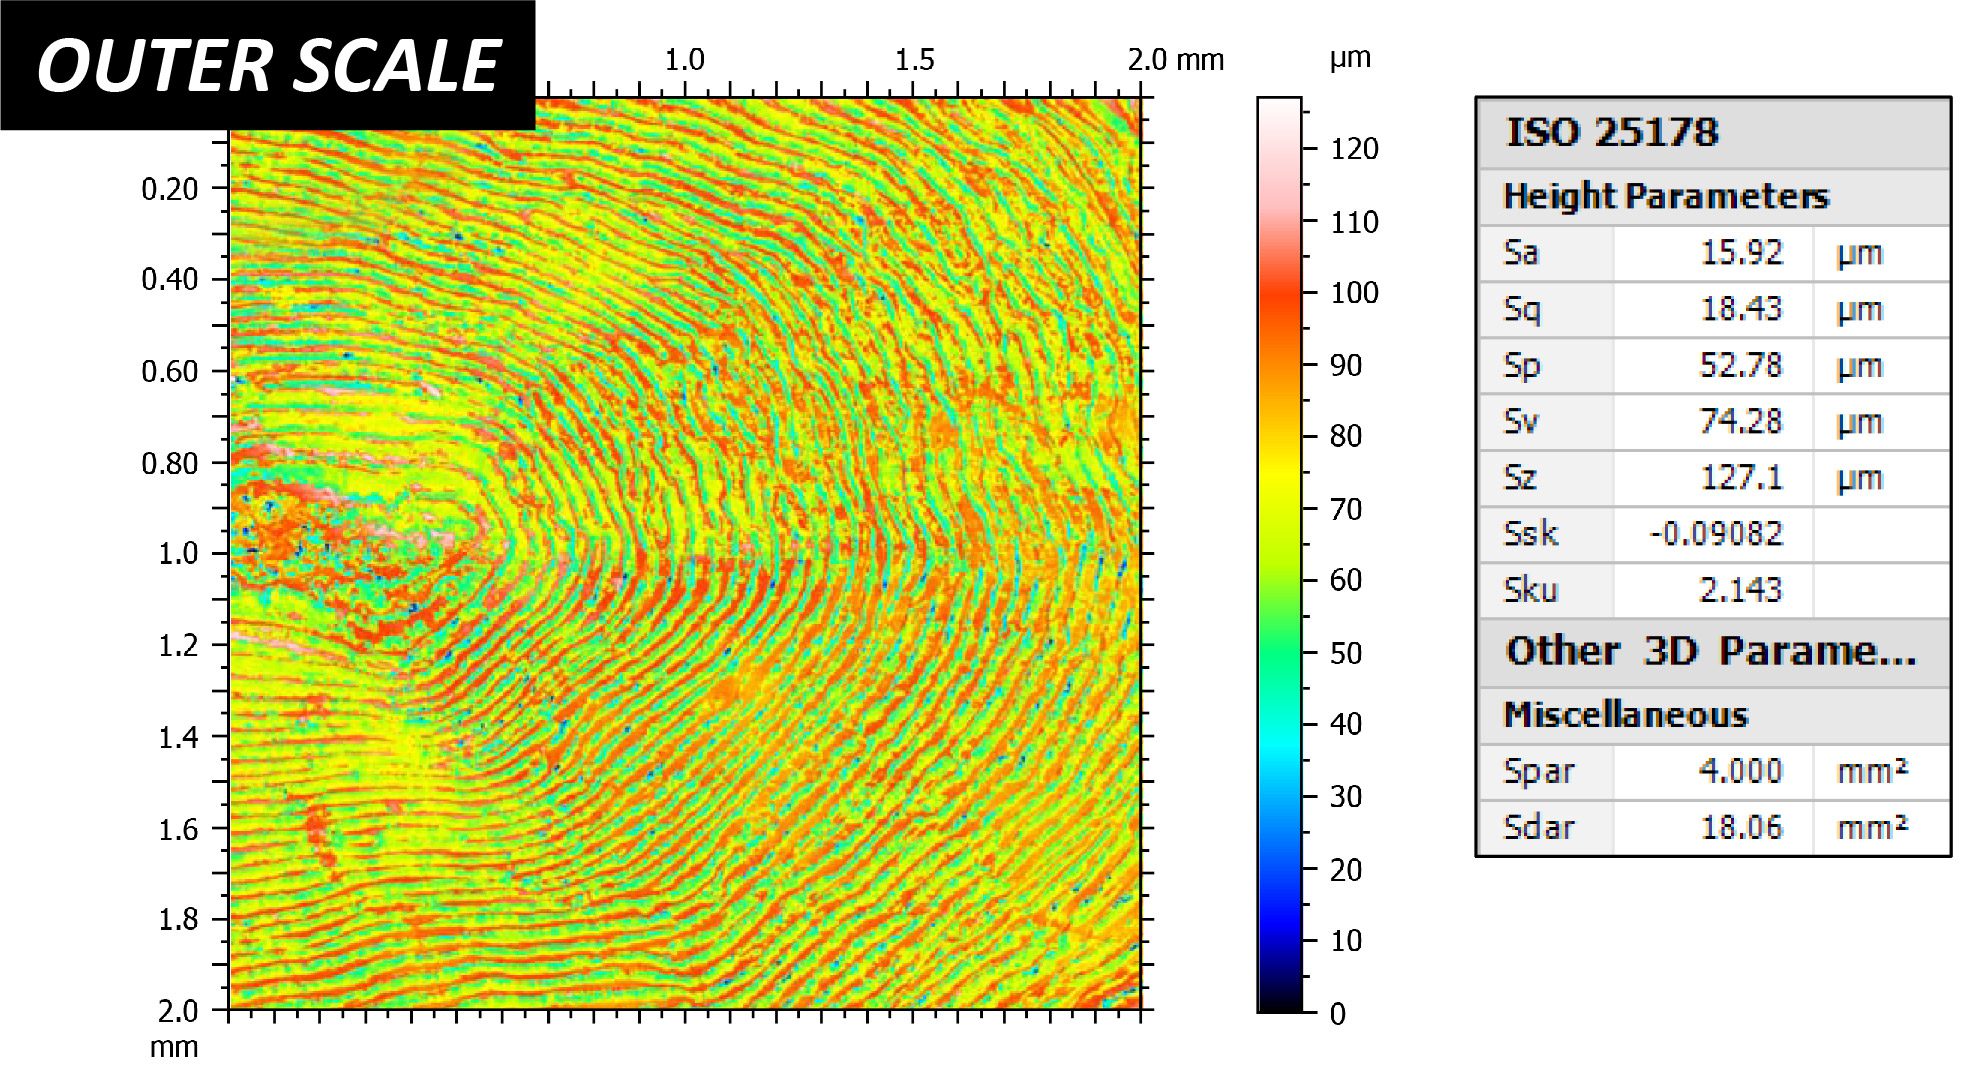
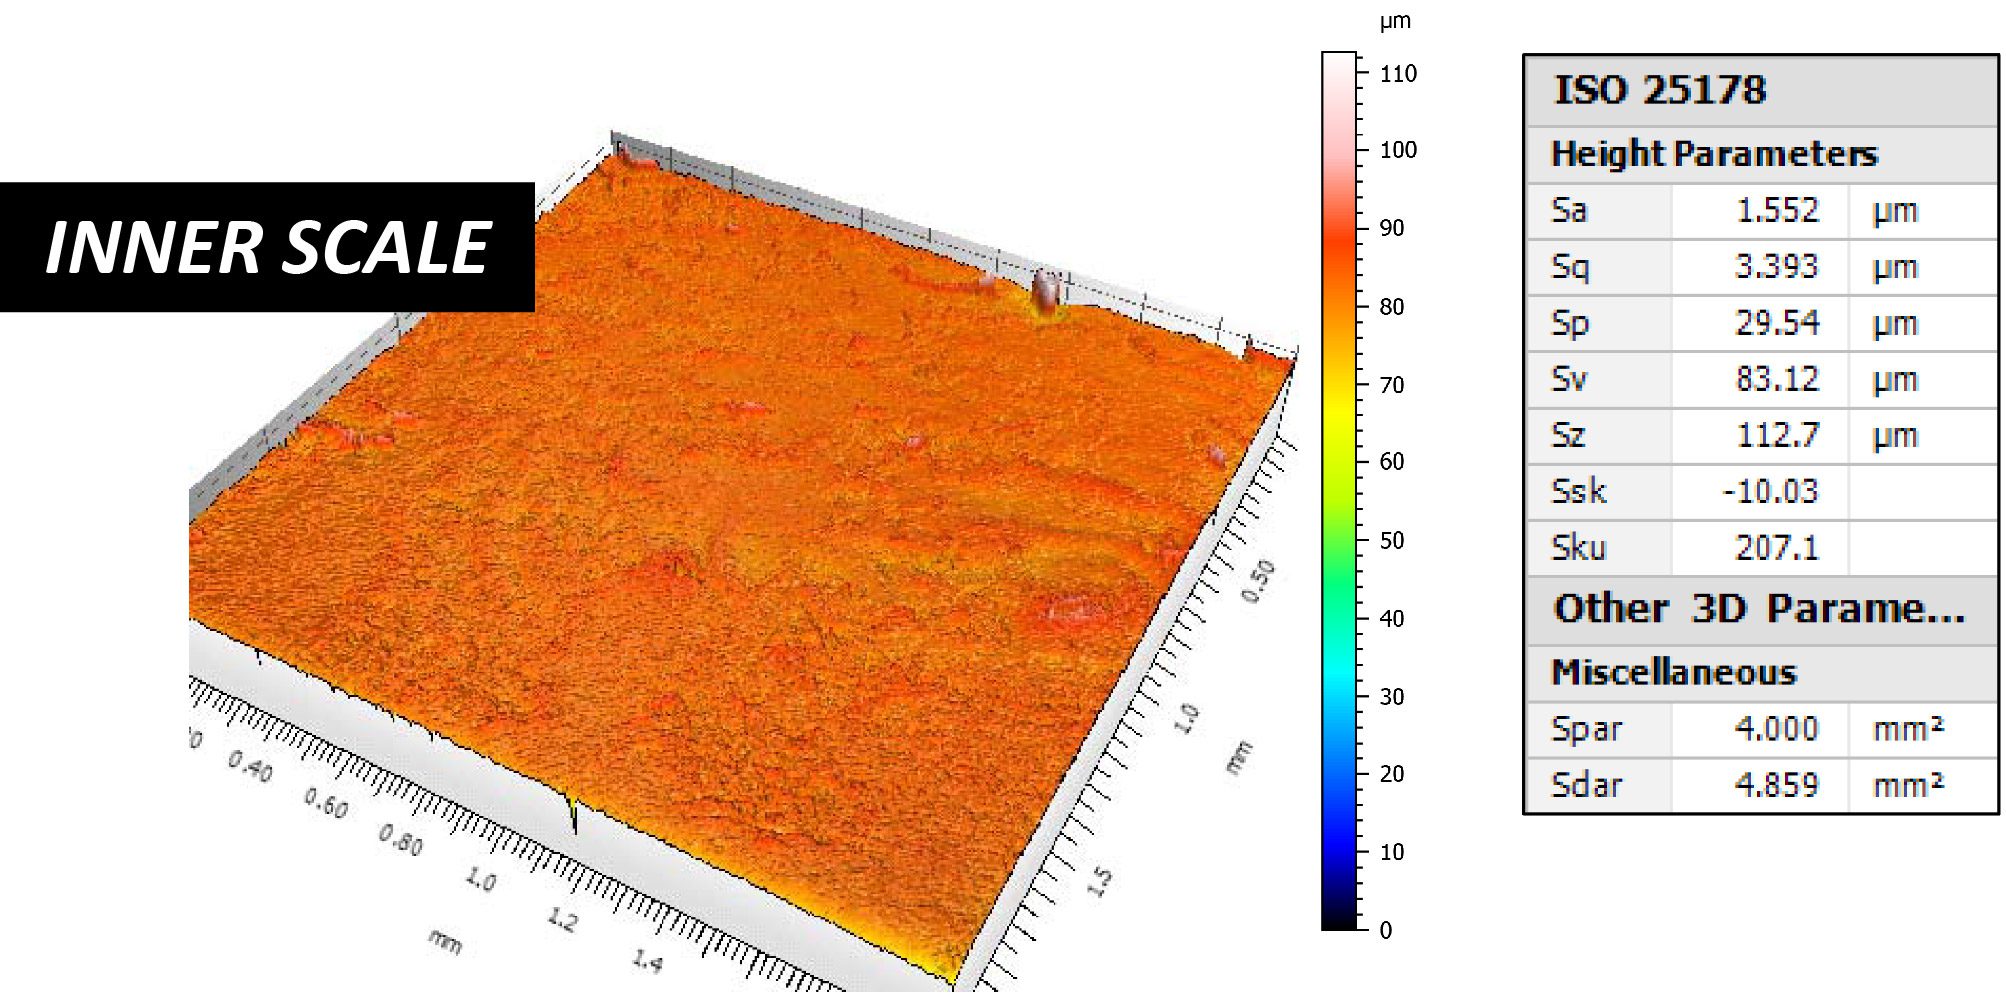
Friction and wear are inevitable for the belts in a belt-driven machine. Sufficient friction ensures effective power transmission without slipping, but excessive friction may rapidly wear the belt. Different types of wear such as fatigue, abrasion and friction take place during the belt drive operation. In order to extend the lifetime of the belt and to cut the cost and time on belt repairing and replacement, reliable evaluation of the wear performance of the belts is desirable in improving belt lifespan, production efficiency and application performance. Accurate measurement of the coefficient of friction and wear rate of the belt facilitates R&D and quality control of belt production.

MEASUREMENT OBJECTIVE

In this study, we simulated and compared the wear behaviors of belts with different surface textures to showcase the capacity of the NANOVEA T2000 Tribometer in simulating the wear process of the belt in a controlled and monitored manner.

NANOVEA

T2000

TEST PROCEDURES

The coefficient of friction, COF, and the wear resistance of two belts with different surface roughness and texture were evaluated by the NANOVEA High-Load Tribometer using Linear Reciprocating Wear Module. A Steel 440 ball (10 mm diameter) was used as the counter material. The surface roughness and wear track were examined using an integrated 3D Non-Contact profilometer. The wear rate, K, was evaluated using the formula K=Vl(Fxs), where V is the worn volume, F is the normal load and s is the sliding distance.


Please note that a smooth Steel 440 ball counterpart was used as an example in this study, any solid material with different shapes and surface finish can be applied using custom fixtures to simulate the actual application situation.

RESULTS & DISCUSSION

The Textured Belt and Smooth Belt have a surface roughness Ra of 33.5 and 8.7 um, respectively, according to the analyzed surface profiles taken with a NANOVEA 3D Non-Contact Optical profiler. The COF and wear rate of the two tested belts were measured at 10 N and 100 N, respectively, to compare the wear behavior of the belts at different loads.

FIGURE 1 shows the evolution of COF of the belts during the wear tests. The belts with different textures exhibit substantially different wear behaviors. It is interesting that after the run-in period during which the COF progressively increases, the Textured Belt reaches a lower COF of ~0.5 in both the tests conducted using loads of 10 N and 100 N. In comparison, the Smooth Belt tested under the load of 10 N exhibits a significantly higher COF of~ 1.4 when the COF gets stable and maintains above this value for the rest of the test. The Smooth Belt tested under the load of 100 N rapidly was worn out by the steel 440 ball and formed a large wear track. The test was therefore stopped at 220 revolutions.

FIGURE 1: Evolution of COF of the belts at different loads.

FIGURE 2 compares the 3D wear track images after the tests at 100 N. The NANOVEA 3D non-contact profilometer offers a tool to analyze the detailed morphology of the wear tracks, providing more insight in fundamental understanding of wear mechanism.

TABLE 1: Result of wear track analysis.

FIGURE 2:  3D view of the two belts
after the tests at 100 N.

The 3D wear track profile allows direct and accurate determination of the wear track volume calculated by the advanced analysis software as shown in TABLE 1. In a wear test for 220 revolutions, the Smooth Belt has a much larger and deeper wear track with a volume of 75.7 mm3, compared to a wear volume of 14.0 mm3 for the Textured Belt after a 600-revolution wear test. The significantly higher friction of the Smooth Belt against the steel ball leads to a 15 fold higher wear rate compared to the Textured Belt.


Such a drastic difference of COF between the Textured Belt and Smooth Belt is possibly related to the size of the contact area between the belt and the steel ball, which also leads to their different wear performance. FIGURE 3 shows the wear tracks of the two belts under the optical microscope. The wear track examination is in agreement with the observation on COF evolution: The Textured Belt, which maintains a low COF of ~0.5, exhibits no sign of wear after the wear test under a load of 10 N. The Smooth Belt shows a small wear track at 10 N. The wear tests carried out at 100 N create substantially larger wear tracks on both the Textured and Smooth Belts, and the wear rate will be calculated using 3D profiles as will be discussed in the following paragraph.

FIGURE 3:  Wear tracks under optical microscope.

CONCLUSION

In this study, we showcased the capacity of the NANOVEA T2000 Tribometer in evaluating the coefficient of friction and wear rate of belts in a well-controlled and quantitative manner. The surface texture plays a critical role in the friction and wear resistance of the belts during their service performance. The textured belt exhibits a stable coefficient of friction of ~0.5 and possesses a long lifetime, which results in reduced time and cost on tool repairing or replacement. In comparison, the excessive friction of the smooth belt against the steel ball rapidly wears the belt. Further, the loading on the belt is a vital factor of its service lifetime. Overload creates very high friction, leading to accelerated wear to the belt.

The NANOVEA T2000 Tribometer offers precise and repeatable wear and friction testing using ISO and ASTM compliant rotative and linear modes, with optional high temperature wear, lubrication and tribocorrosion modules available in one pre-integrated system. NANOVEA’s unmatched range is an ideal solution for determining the full range of tribological properties of thin or thick, soft or hard coatings, films and substrates.

Fossil Microstructure Using 3D Profilometry

FOSSIL MICROSTRUCTURE

USING 3D PROFILOMETRY

Prepared by

DUANJIE LI, PhD

INTRODUCTION

Fossils are the preserved remains of traces of plants, animals and other organisms buried in sediment under ancient seas, lakes and rivers. The soft body tissue usually decays after death, but the hard shells, bones and teeth fossilize. Microstructure surface features are often preserved when mineral replacement of the original shells and bones takes place, which provides an insight into the evolution of weather and the formation mechanism of fossils.

IMPORTANCE OF A 3D NON-CONTACT PROFILOMETER FOR FOSSIL EXAMINATION

3D profiles of the fossil enable us to observe the detailed surface features of the fossil sample from a closer angle. The high resolution and accuracy of the NANOVEA profilometer may not be discernible by the naked eye. The profilometer’s analysis software offers a wide range of studies applicable to these unique surfaces. Unlike other techniques such as touch probes, the NANOVEA 3D Non-Contact Profilometer measures the surface features without touching the sample. This allows for the preservation of the true surface features of certain delicate fossil samples. Moreover, the portable model Jr25 profilometer enables 3D measurement on fossil sites, which substantially facilitates fossil analysis and protection after excavation.

MEASUREMENT OBJECTIVE

In this study, the NANOVEA Jr25 Profilometer is used to measure the surface of two representative fossil samples. The entire surface of each fossil was scanned and analyzed in order to characterize its surface features which include roughness, contour and texture direction.

NANOVEA

Jr25

BRACHIOPOD FOSSIL

The first fossil sample presented in this report is a Brachiopod fossil, which came from a marine animal that has hard “valves” (shells) on its upper and lower surfaces. They first appeared in the Cambrian period, which is more than 550 million years ago.

The 3D View of the scan is shown in FIGURE 1 and False Color View is shown in FIGURE 2. 

FIGURE 1: 3D View of the Brachiopod fossil sample.

FIGURE 2: False Color View of the Brachiopod fossil sample.

The overall form was then removed from the surface in order to investigate the local surface morphology and contour of the Brachiopod fossil as shown in FIGURE 3. A peculiar divergent groove texture can now be observed on the Brachiopod fossil sample.

FIGURE 3: False Color View and Contour Lines View after form removal.

A line profile is extracted from the textured area to show a crossectional view of the fossil surface in FIGURE 4. The Step Height study measures precise dimensions of the surface features. The grooves possess an average width of ~0.38 mm and depth of ~0.25 mm.

FIGURE 4: Line profile and Step Height studies of the textured surface.

CRINOID STEM FOSSIL

The second fossil sample is a Crinoid stem fossil. Crinoids first appeared in the seas of the Middle Cambrian Period, about 300 million years before dinosaurs. 


The 3D View of the scan is shown in FIGURE 5 and False Color View is shown in FIGURE 6. 

FIGURE 5: 3D View of the Crinoid fossil sample.

The surface texture isotropy and roughness of the Crinoid stem fossil are analyzed in FIGURE 7. 

 This fossil has a preferential texture direction in the angle close to 90°, leading to texture isotropy of 69%.

FIGURE 6: False Color View of the Crinoid stem sample.


FIGURE 7: Surface texture isotropy and roughness of the Crinoid stem fossil.

The 2D profile along the axial direction of the Crinoid stem fossil is shown in FIGURE 8. 

The size of the peaks of the surface texture is fairly uniform.

FIGURE 8: 2D profile analysis of the Crinoid stem fossil.

CONCLUSION

In this application, we comprehensively studied the 3D surface features of a Brachiopod and Crinoid stem fossil using the NANOVEA Jr25 Portable Non-Contact Profilometer. We showcase that the instrument can precisely characterize the 3D morphology of the fossil samples. The interesting surface features and texture of the samples are then further analyzed. The Brachiopod sample possesses a divergent groove texture, while the Crinoid stem fossil shows  preferential texture isotropy. The detailed and precise 3D surface scans prove to be ideal tools for palaeontologists and geologists to study the evolution of lives and the formation of fossils.

The data shown here represent only a portion of the calculations available in the analysis software. NANOVEA Profilometers measure virtually any surface in fields including Semiconductor, Microelectronics, Solar, Fiber Optics, Automotive, Aerospace, Metallurgy, Machining, Coatings, Pharmaceutical, Biomedical, Environmental and many others.

Sandpaper Abrasion Performance Using a Tribometer

SANDPAPER ABRASION PERFORMANCE

USING A TRIBOMETER

sandpaper abrasion testing

Prepared by

DUANJIE LI, PhD

INTRODUCTION

Sandpaper consists of abrasive particles glued to one face of a paper or cloth. Various abrasive materials can be used for the particles, such as garnet, silicon carbide, aluminum oxide and diamond. Sandpaper is widely applied in a variety of industrial sectors to create specific surface finishes on wood, metal and drywall. They often work under high pressure contact applied by hand or power tools.

IMPORTANCE OF EVALUATING SANDPAPER ABRASION PERFORMANCE

The effectiveness of sandpaper is often determined by its abrasion performance under different conditions. The grit size, i.e. the size of the abrasive particles embedded in the sandpaper, determines the wear rate and the scratch size of the material being sanded. Sandpapers of higher grit numbers have smaller particles, resulting in lower sanding speeds and finer surface finishes. Sandpapers with the same grit number but made of different materials can have unalike behaviors under dry or wet conditions. Reliable tribological evaluations are needed to ensure that manufactured sandpaper possesses the desired abrasive behavior intended. These evaluations allow users to quantitatively compare the wear behaviors of different types of sandpapers in a controlled and monitored manner in order to select the best candidate for the target application.

MEASUREMENT OBJECTIVE

In this study, we showcase the NANOVEA T2000 High Load Pneumatic Tribometer’s ability to quantitatively evaluate the abrasion performance of various sandpaper samples under dry and wet conditions.

NANOVEA T2000 High Load
Pneumatic Tribometer

TEST PROCEDURES

The coefficient of friction (COF) and the abrasion performance of two types of sandpapers were evaluated by the NANOVEA T100 Tribometer. A 440 stainless steel ball was used as the counter material. The ball wear scars were examined after each wear test using the NANOVEA 3D Non-Contact Optical Profiler to ensure precise volume loss measurements.

Please note that a 440 stainless steel ball was chosen as the counter material to create a comparative study but any solid material could be substituted to simulate a different application condition.

sandpaper abrasion testing parameters
sandpaper tribology testing

TEST RESULTS & DISCUSSION

FIGURE 1 shows a COF comparison of Sandpaper 1 and 2 under dry and wet environmental conditions. Sandpaper 1, under dry conditions, shows a COF of 0.4 at the beginning of the test which progressively decreases and stabilizes to 0.3. Under wet conditions, this sample exhibits a lower average COF of 0.27. In contrast, Sample 2’s COF results show a dry COF of 0.27 and wet COF of ~ 0.37. 

Please note the oscillation in the data for all COF plots was caused by the vibrations generated by the sliding movement of the ball against the rough sandpaper surfaces.

sandpaper abrasion cof

FIGURE 1: Evolution of COF during the wear tests.

FIGURE 2 summarizes the results of the wear scar analysis. The wear scars were measured using an optical microscope and a NANOVEA 3D Non-Contact Optical Profiler. FIGURE 3 and FIGURE 4 compare the wear scars of the worn SS440 balls post wear tests on Sandpaper 1 and 2 (wet and dry conditions). As shown in FIGURE 4 the NANOVEA Optical Profiler precisely captures the surface topography of the four balls and their respective wear tracks which were then processed with the NANOVEA Mountains Advanced Analysis software to calculate volume loss and wear rate. On the microscope and profile image of the ball it can be observed that the ball used for Sandpaper 1 (dry) testing exhibited a larger flattened wear scar compared to the others with a volume loss of 0.313 mm3. In contrast, the volume loss for Sandpaper 1 (wet) was 0.131 mm3. For Sandpaper 2 (dry) the volume loss was 0.163 mm3 and for Sandpaper 2 (wet) the volume loss increased to 0.237 mm3.

Moreover, it is interesting to observe that the COF played an important role in the abrasion performance of the sandpapers. Sandpaper 1 exhibited higher COF in the dry condition, leading to a higher abrasion rate for the SS440 ball used in the test. In comparison, the higher COF of Sandpaper 2 in the wet condition resulted in a higher abrasion rate. The wear tracks of the sandpapers after the measurements are displayed in FIGURE 5.

Both Sandpapers 1 and 2 claim to work in either dry and wet environments. However, they exhibited significantly different abrasion performance in the dry and wet conditions. NANOVEA tribometers provide well-controlled quantifiable and reliable wear assessment capabilities that ensure reproducible wear evaluations. Moreover, the capacity of in situ COF measurement allows users to correlate different stages of a wear process with the evolution of COF, which is critical in improving fundamental understanding of the wear mechanism and tribological characteristics of sandpaper

sandpaper abrasion tribology testing

FIGURE 2: Wear scar volume of the balls and average COF under different conditions.

sandpaper abrasion test - dry
sandpaper abrasion testing - dry
sandpaper abrasion test - wet
sandpaper abrasion testing - wet

FIGURE 3: Wear scars of the balls after the tests.

sandpaper abrasion - profilometry
sandpaper abrasion - surface profile
sandpaper abrasion test - 3d surface profile
sandpaper abrasion testing - 3d surface scan

FIGURE 4: 3D morphology of the wear scars on the balls.

sandpaper abrasion test results
sandpaper abrasion testing results
sandpaper abrasion tribology test results
sandpaper abrasion testing results

FIGURE 5: Wear tracks on the sandpapers under different conditions.

CONCLUSION

The abrasion performance of two types of sandpapers of the same grit number were evaluated under dry and wet conditions in this study. The service conditions of the sandpaper play a critical role in the effectiveness of the work performance. Sandpaper 1 possessed significantly better abrasion behavior under dry conditions, while Sandpaper 2 performed better under wet conditions. The friction during the sanding process is an important factor to consider when evaluating abrasion performance. The NANOVEA Optical Profiler precisely measures the 3D morphology of any surface, such as wear scars on a ball, ensuring reliable evaluation on the abrasion performance of the sandpaper in this study. The NANOVEA Tribometer measures the coefficient of friction in situ during a wear test, providing an insight on the different stages of a wear process. It also offers repeatable wear and friction testing using ISO and ASTM compliant rotative and linear modes, with optional high temperature wear and lubrication modules available in one pre-integrated system. This unmatched range allows users to simulate different severe work environment of the ball bearings including high stress, wear and high temperature, etc. It also provides an ideal tool to quantitatively assess the tribological behaviors of superior wear resistant materials under high loads.

Processed Leather Surface Finish using 3D Profilometry

PROCESSED LEATHER

SURFACE FINISH USING 3D PROFILOMETRY

Prepared by

CRAIG LEISING

INTRODUCTION

Once the tanning process of a leather hide is complete the leather surface can undergo several finishing processes for a variety of looks and touch. These mechanical processes can include stretching, buffing, sanding, embossing, coating etc. Dependent upon the end use of the leather some may require a more precise, controlled and repeatable processing.

IMPORTANCE OF PROFILOMETRY INSPECTION FOR R&D AND QUALITY CONTROL

Due to the large variation and unreliability of visual inspection methods, tools that are capable of accurately quantifying micro and nano scales features can improve leather finishing processes. Understanding the surface finish of leather in a quantifiable sense can lead to improved data driven surface processing selection to achieve optimal finish results. NANOVEA 3D Non-Contact Profilometers utilize chromatic confocal technology to measure finished leather surfaces and offer the highest repeatability and accuracy in the market. Where other techniques fail to provide reliable data, due to probe contact, surface variation, angle, absorption or reflectivity, NANOVEA Profilometers succeed.

MEASUREMENT OBJECTIVE

In this application, the NANOVEA ST400 is used to measure and compare the surface finish of two different but closely processed leather samples. Several surface parameters are automatically calculated from the surface profile.

Here we will focus on surface roughness, dimple depth, dimple pitch and dimple diameter for comparative evaluation.

NANOVEA

ST400

RESULTS: SAMPLE 1

ISO 25178

HEIGHT PARAMETERS

OTHER 3D PARAMETERS

RESULTS: SAMPLE 2

ISO 25178

HEIGHT PARAMETERS

OTHER 3D PARAMETERS

DEPTH COMPARATIVE

Depth distribution for each sample.
A large number of deep dimples were observed in
SAMPLE 1.

PITCH COMPARATIVE

Pitch between dimples on SAMPLE 1 is slightly smaller
than
SAMPLE 2, but both have a similar distribution

 MEAN DIAMETER COMPARATIVE

Similar distributions of mean diameter of dimples,
with
SAMPLE 1 showing slightly smaller mean diameters on average.

CONCLUSION

In this application, we have shown how the NANOVEA ST400 3D Profilometer can precisely characterize the surface finish of processed leather. In this study, having the ability to measure surface roughness, dimple depth, dimple pitch and dimple diameter allowed us to quantify differences between the finish and quality of the two samples that may not be obvious by visual inspection.

Overall there were no visible difference in the appearance of the 3D scans between SAMPLE 1 and SAMPLE 2. However, in the statistical analysis there is a clear distinction between the two samples. SAMPLE 1 contains a higher quantity of dimples with smaller diameters, larger depths and smaller dimple-to-dimple pitch in comparison to SAMPLE 2.

Please note that additional studies are available. Special areas of interest could have been further analyzed with an integrated AFM or Microscope module. NANOVEA 3D Profilometer speeds range from 20 mm/s to 1 m/s for laboratory or research to meet the needs of high-speed inspection; can be built with custom sizing, speeds, scanning capabilities, Class 1 clean room compliance, indexing conveyor or for in-line or online integration.

Piston Wear Testing

PISTON WEAR TESTINGUSING NANOVEA TRIBOMETER

Piston wear testing using NANOVEA tribometer under lubricated conditions.

Prepared by

FRANK LIU

What Is Piston Wear Testing?

Piston wear testing evaluates the friction, lubrication, and material durability between piston skirts and cylinder liners under controlled laboratory conditions. Using a tribometer, engineers can replicate real reciprocating motion and precisely measure the coefficient of friction, wear rate, and 3D surface topography. These results provide key insights into the tribological behavior of coatings, lubricants, and alloys used in engine pistons, helping optimize performance, fuel efficiency, and long-term reliability.

schematic showing piston skirt and cylinder liner lubrication interface during wear testing

 Schematic of power cylinders system and piston skirt-lubricant-cylinder liner interfaces.

💡 Want to quantify wear rate and friction of your own samples? Request a custom tribology test tailored to your application.

Why Piston Wear Testing Matters in Engine Development

Motor oil is a lubricant that is well-designed for its application. In addition to the base oil, additives such as detergents, dispersants, viscosity improver (VI), anti-wear/anti-friction agents, and corrosion inhibitors are added to improve its performance. These additives affect how the oil behaves under different operating conditions. The behavior of oil affects the P-L-C interfaces and determines if significant wear from metal-metal contact or if hydrodynamic lubrication (very little wear) is occurring.

It is difficult to understand the P-L-C interfaces without isolating the area from external variables. It is more practical to simulate the event with conditions that are representative of its real-life application. The NANOVEA Tribometer is ideal for this. Equipped with multiple force sensors, depth sensor, a drop-by-drop lubricant module, and linear reciprocating stage, the NANOVEA T2000 is able to closely mimic events occurring within an engine block and obtain valuable data to better understand the P-L-C interfaces.

nanovea tribometer piston wear and friction testing module setup

Liquid Module on the NANOVEA T2000 Tribometer

The drop-by-drop module is crucial for this study. Since pistons can move at a very fast rate (above 3000 rpm), it is difficult to create a thin film of lubricant by submerging the sample. To remedy this issue, the drop-by-drop module is able to consistently apply a constant amount of lubricant onto the piston skirt surface.

Application of fresh lubricant also removes concern of dislodged wear contaminants influencing the lubricant’s properties.

How Tribometers Simulate
Real Piston–Liner Wear

The piston skirt-lubricant-cylinder liner interfaces will be studied in this report. The interfaces will be replicated by conducting a linear reciprocating wear test with drop-by-drop lubricant module.

The lubricant will be applied at room temperature and heated conditions to compare cold start and optimal operation conditions. The COF and wear rate will be observed to better understand how the interfaces behaves in real-life applications.

NANOVEA T2000
High Load Tribometer

Piston Wear Test Parameters & Setup

LOAD ………………………. 100 N

TEST DURATION ………………………. 30 min

SPEED ………………………. 2000 rpm

AMPLITUDE ………………………. 10 mm

TOTAL DISTANCE ………………………. 1200 m

SKIRT COATING ………………………. Moly-graphite

PIN MATERIAL ………………………. Aluminum Alloy 5052

PIN DIAMETER ………………………. 10 mm

LUBRICANT ………………………. Motor Oil (10W-30)

APPROX. FLOW RATE ………………………. 60 mL/min

TEMPERATURE ………………………. Room temp & 90°C

Real-World Relevance of
Piston Wear Testing

Tribometer-based piston wear testing provides critical insight into how material choices and lubrication strategies affect real engine reliability. Instead of relying on costly full-engine tests, laboratories can evaluate coatings, oils, and alloy surfaces under realistic mechanical load and temperature conditions. NANOVEA’s 3D profilometry and tribology modules allow precise mapping of wear depth and friction stability, helping R&D teams optimize performance and reduce development cycles.

Piston Wear Test Results & Analysis

piston wear scar comparison from tribometer lubricated wear test

In this experiment, A5052 was used as the counter material. While engine blocks are usually made of cast aluminum such as A356, A5052 have mechanical properties similar to A356 for this simulative testing [1].

Under the testing conditions, significant wear was observed on the piston skirt at room temperature compared to at 90°C. The deep scratches seen on the samples suggest that contact between the static material and the piston skirt occurs frequently throughout the test. The high viscosity at room temperature may be restricting the oil from completely filling gaps at the interfaces and creating metal-metal contact. At higher temperature, the oil thins and is able to flow between the pin and the piston. As a result, significantly less wear is observed at higher temperature. FIGURE 5 shows one side of the wear scar wore significantly less than the other side. This is most likely due to the location of the oil output. The lubricant film thickness was thicker on one side than the other, causing uneven wearing.

[1] “5052 Aluminum vs 356.0 Aluminum.” MakeItFrom.com, makeitfrom.com/compare/5052-O-Aluminum/A356.0-SG70B-A13560-Cast-Aluminum

The COF of linear reciprocating tribology tests can be split into a high and low pass. High pass refers to the sample moving in the forward, or positive, direction and low pass refers to the sample moving in the reverse, or negative, direction. The average COF for the RT oil was observed to be under 0.1 for both directions. The average COF between passes were 0.072 and 0.080. The average COF of the 90°C oil was found to be different between passes. Average COF values of 0.167 and 0.09 were observed. The difference in COF gives additional proof that the oil was only able to properly wet one side of the pin. High COF was obtained when a thick film was formed between the pin and the piston skirt due to hydrodynamic lubrication occurring. Lower COF is observed in the other direction when mixed lubrication is occurring. For more information on hydrodynamic lubrication and mixed lubrication, please visit our application note on Stribeck Curves.
coefficient of friction and wear rate results from lubricated piston wear test

Table 1: Results from lubricated wear test on pistons.

friction coefficient graphs for piston wear test at room temperature showing raw high and low pass profiles

FIGURE 1: COF graphs for room temperature oil wear test A raw profile B high pass C low pass.

friction coefficient graphs for piston wear test at 90 degrees Celsius showing raw high and low pass profiles

FIGURE 2: COF graphs for 90°C wear oil test A raw profile B high pass C low pass.

optical microscope image of piston wear scar from room temperature motor oil wear test

FIGURE 3: Optical image of wear scar from RT motor oil wear test.

piston surface showing localized wear scar highlighted for tribological analysis
volume and depth analysis of piston wear scar from tribometer test

FIGURE 4: Volume of a hole analysis of wear scar from RT motor oil wear test.

3d surface profilometry scan of piston wear scar showing wear depth and roughness

FIGURE 5: Profilometry scan of wear scar from RT motor oil wear test.

optical microscope image of piston wear scar from 90 degree motor oil wear test

FIGURE 6: Optical image of wear scar from 90°C motor oil wear test

piston skirt showing wear zone analyzed during tribometer piston wear testing
volume and depth measurement of piston wear scar from 90 degree motor oil tribometer test

FIGURE 7: Volume of a hole analysis of wear scar from 90°C motor oil wear test.

3d surface profilometry scan of piston wear scar from 90 degree motor oil wear test showing wear depth and texture

FIGURE 8: Profilometry scan of wear scar from 90°C motor oil wear test.

Conclusion: Engine Wear Evaluation with NANOVEA Tribometers

Lubricated linear reciprocating wear testing was conducted on a piston to simulate events occurring in a real-life operational engine. The piston skirt-lubricant-cylinder liner interfaces is crucial to the operations of an engine. The lubricant thickness at the interface is responsible for energy loss due to friction or wear between the piston skirt and cylinder liner. To optimize the engine, the film thickness must be as thin as possible without allowing the piston skirt and cylinder liner to touch. The challenge, however, is how changes in temperature, speed, and force will affect the P-L-C interfaces.

With its wide range of loading (up to 2000 N) and speed (up to 15000 rpm), the NANOVEA T2000 tribometer is able to simulate different conditions possible in an engine. Possible future studies on this topic include how the P-L-C interfaces will behave under different constant load, oscillated load, lubricant temperature, speed, and lubricant application method. These parameters can be easily adjusted with the NANOVEA T2000 tribometer to give a complete understanding on the mechanisms of the piston skirt-lubricant-cylinder liner interfaces

ℹ️ Interested in brake pad testing? Learn more about our dedicated brake friction tester for pads, linings, and automotive R&D.

Organic Surface Topography using Portable 3D Profilometer

ORGANIC SURFACE TOPOGRAPHY

USING PORTABLE 3D PROFILOMETER

Prepared by

CRAIG LEISING

INTRODUCTION

Nature has become a vital pool of inspiration for the development of improved surface structure. Understanding the surface structures found in nature has led to adhesion studies based on gecko’s feet, resistance studies based on a sea cucumbers textural change and repellency studies based from leaves, among many others. These surfaces have a number of potential applications from biomedical to clothing and automotive. For any of these surface breakthroughs to be successful, fabrication techniques must be developed so surface characteristics can be mimicked and reproduced. It is this process that will require identification and control.

IMPORTANCE OF PORTABLE 3D NON-CONTACT OPTICAL PROFILER FOR ORGANIC SURFACES

Utilizing Chromatic Light technology, the NANOVEA Jr25 Portable Optical Profiler has superior capability to measure nearly any material. That includes the unique and steep angles, reflective and absorbing surfaces found within natures broad range of surface characteristics. 3D non-contact measurements provide a full 3D image to give a more complete understanding of surface features. Without 3D capabilities, identification of nature’s surfaces would be solely relying on 2D information or microscope imaging, which does not provide sufficient information to properly mimic the surface studied. Understanding the full range of the surface characteristics including texture, form, dimension, among many others, will be critical to successful fabrication.

The ability to easily obtain lab-quality results in the field opens the door for new research opportunities.

MEASUREMENT OBJECTIVE

In this application, the NANOVEA Jr25 is used to measure the surface of a leaf. There is an endless list of surface parameters that can be automatically calculated after the 3D surface scan.

Here we will review the 3D surface and select
areas of interest to further analyze, including
quantifying and investigating the surface roughness, channels and topography

NANOVEA

JR25

TEST CONDITIONS

FURROW DEPTH

Mean density of furrows: 16.471 cm/cm2
Mean depth of furrows: 97.428 μm
Maximum depth: 359.769 μm

CONCLUSION

In this application, we have shown how the NANOVEA Jr25 portable 3D Non-Contact Optical Profiler can precisely characterize both the topography and the nanometer scale details of a leaf surface in the field. From these 3D surface measurements, areas of interest can quickly be identified and then analyzed with a list of endless studies (Dimension, Roughness Finish Texture, Shape Form Topography, Flatness Warpage Planarity, Volume Area, Step-Height and others). A 2D cross section can be easily chosen to analyze further details. With this information organic surfaces can be broadly investigated with a complete set of surface measurement resources. Special areas of interest could have been further analyzed with integrated AFM module on table top models.

NANOVEA also offers portable high-speed profilometers for field research and a wide range of lab-based systems, as well as provides laboratory services.

Sandpaper Roughness Profilometer

Sandpaper: Roughness & Particle Diameter Analysis

Sandpaper: Roughness & Particle Diameter Analysis

Learn more


SANDPAPER

Roughness & Particle Diameter Analysis

Prepared by

FRANK LIU

INTRODUCTION

Sandpaper is a common commercially available product used as an abrasive. The most common use for sandpaper is to remove coatings or to polish a surface with its abrasive properties. These abrasive properties are classified into grits, each related to how smooth or
rough of a surface finish it will give. To achieve desired abrasive properties, manufactures of sandpaper must ensure that the abrasive particles are of a specific size and have little deviation. To quantify the quality of sandpaper, NANOVEA’s 3D Non-Contact Profilometer can be used to obtain the arithmetic mean (Sa) height parameter and average particle diameter of a sample area.

IMPORTANCE OF 3D NON-CONTACT OPTICAL PROFILER FOR SANDPAPER

When using sandpaper, interaction between abrasive particles and the surface being sanded must be uniform to obtain consistent surface finishes. To quantify this, the surface of the sandpaper can be observed with NANOVEA’s 3D Non-Contact Optical Profiler to see deviations in the particle sizes, heights, and spacing.

MEASUREMENT OBJECTIVE

In this study, five different sandpaper grits (120,
180, 320, 800, and 2000) are scanned with the
NANOVEA ST400 3D Non-Contact Optical Profiler.
The Sa is extracted from the scan and the particle
size is calculated by conducting a Motifs analysis to
find their equivalent diameter

NANOVEA

ST400

RESULTS & DISCUSSION

The sandpaper decreases in surface roughness (Sa) and particle size as the grit increases, as expected. The Sa ranged from 42.37 μm to 3.639 μm. The particle size ranges from 127 ± 48.7 to 21.27 ± 8.35. Larger particles and high height variations create stronger abrasive action on surfaces as opposed to smaller particles with low height variation.
Please note all definitions of the given height parameters are listed on page.A.1.

TABLE 1: Comparison between sandpaper grits and height parameters.

TABLE 2: Comparison between sandpaper grits and particle diameter.

2D & 3D VIEW OF SANDPAPER 

Below are the false-color and 3D view for the sandpaper samples.
A gaussian filter of 0.8 mm was used to remove the form or waviness.

MOTIF ANALYSIS

To accurately find the particles at the surface, the height scale threshold was redefined to only show the upper layer of the sandpaper. A motifs analysis was then conducted to detect the peaks.

CONCLUSION

NANOVEA’s 3D Non-Contact Optical Profiler was used to inspect the surface properties of various sandpaper grits due to its ability to scan surfaces with micro and nano features with precision.

Surface height parameters and the equivalent particle diameters were obtained from each of the sandpaper samples using advanced software to analyze the 3D scans. It was observed that as the grit size increased, the surface roughness (Sa) and particle size decreased as expected.

Styrofoam Surface Boundary Measurement Profilometry

Surface Boundary Measurement

Surface Boundary Measurement Using 3D Profilometry

Learn more


SURFACE BOUNDARY MEASUREMENT

USING 3D PROFILOMETRY

Prepared by

Craig Leising

INTRODUCTION

In studies where the interface of surface features, patterns, shapes etc., are being evaluated for orientation, it will be useful to quickly identify areas of interest over the entire profile of measurement. By segmenting a surface into significant areas the user can quickly evaluate boundaries, peaks, pits, areas, volumes and many others to understand their functional role in the entire surface profile under study. For example, like that of a grain boundary imaging of metals, the importance of analysis is the interface of many structures and their overall orientation. By understanding each area of interest defects and or abnormalities within the overall area can be identified. Although grain boundary imaging is typically studied at a range surpassing Profilometer capability, and is only 2D image analysis, it is a helpful reference to illustrate the concept of what will be shown here on a larger scale along with 3D surface measurement advantages.

IMPORTANCE OF 3D NON CONTACT PROFILOMETER FOR SURFACE SEPARATION STUDY

Unlike other techniques such as touch probes or interferometry, the 3D Non Contact Profilometer, using axial chromatism, can measure nearly any surface, sample sizes can vary widely due to open staging and there is no sample preparation needed. Nano through macro range is obtained during surface profile measurement with zero influence from sample reflectivity or absorption, has advanced ability to measure high surface angles and there is no software manipulation of results. Easily measure any material: transparent, opaque, specular, diffusive, polished, rough etc. The technique of the Non Contact Profilometer provides an ideal, broad and user friendly capability to maximize surface studies when surface boundary analysis will be needed; along with the benefits of combined 2D & 3D capability.

MEASUREMENT OBJECTIVE

In this application the Nanovea ST400 Profilometer is used to measure the surface area of Styrofoam. Boundaries were established by combining a reflected intensity file along with the topography, which are simultaneously acquired using the NANOVEA ST400. This data was then used to calculate different shape and size information of each Styrofoam “grain”.

NANOVEA

ST400

RESULTS & DISCUSSION: 2D Surface Boundary Measurement

Topography image(below left) masked by reflected intensity image(below right) to clearly define grain boundaries. All grains below 565µm diameter have been ignored by applying filter.

Total number of grains: 167
Total projected area occupied by the grains: 166.917 mm² (64.5962 %)
Total projected area occupied by boundaries: (35.4038 %)
Density of grains: 0.646285 grains / mm2

Area = 0.999500 mm² +/- 0.491846 mm²
Perimeter = 9114.15 µm +/- 4570.38 µm
Equivalent diameter = 1098.61 µm +/- 256.235 µm
Mean diameter = 945.373 µm +/- 248.344 µm
Min diameter = 675.898 µm +/- 246.850 µm
Max diameter = 1312.43 µm +/- 295.258 µm

RESULTS & DISCUSSION: 3D Surface Boundary Measurement

By using the 3D topography data obtained, the volume, height, peak, aspect ratio and general shape information can be analyzed on each grain. Total 3D area occupied: 2.525mm3

CONCLUSION

In this application, we have shown how the NANOVEA 3D Non Contact Profilometer can precisely characterize the surface of Styrofoam. Statistical information can be gained over the entire surface of interest or on individual grains, whether they are peaks or pits. In this example all grains larger than a user defined size were used to show the area, perimeter, diameter and height. The features shown here can be critical to research and quality control of natural and pre fabricated surfaces ranging from bio medical to micromachining applications along with many others. 

Contour Measurement using Profilometer by NANOVEA

Tire Tread Depth & Rubber Surface Roughness Measurement | 3D Optical Profiler

TIRE TREAD DEPTH & RUBBER SURFACE ROUGHNESS MEASUREMENT using 3D Optical Profiler

Tire tread depth measurement reference showing multiple car tire tread patterns

Prepared by

ANDREA HERRMANN

While tire tread depth is commonly measured with handheld gauges for consumer safety, industrial R&D and tire manufacturers require more advanced methods. This application note demonstrates how a 3D optical profilometer provides precise tire tread depth measurement, contour mapping, and rubber surface roughness analysis for high-accuracy studies.

INTRODUCTION

Like all materials, rubber’s coefficient of friction is related in part to its surface roughness. In vehicle tires, both tread depth and surface roughness directly affect traction, braking, and wear performance. In this study, the rubber surface and tread’s roughness and dimensions are analyzed using 3D non-contact profilometry.
Tire sample used for tread depth and rubber surface roughness measurement

THE SAMPLE

IMPORTANCE OF 3D NON-CONTACT PROFILOMETRY FOR TIRE TREAD DEPTH MEASUREMENT

Unlike other techniques such as touch probes or interferometry, NANOVEA’s 3D Non-Contact Optical Profilers use axial chromatism to measure nearly any surface.

The Profiler system’s open staging allows for a wide variety of sample sizes and requires zero sample preparation. With a single scan, users can capture both overall tire tread depth and micro-level surface roughness, with zero influence from sample reflectivity or absorption. Plus, these profilers have the advanced ability to measure high surface angles without requiring software manipulation of results.

This versatility makes NANOVEA profilers ideal for both tire tread wear testing and advanced rubber material research.

MEASUREMENT OBJECTIVE

In this application, we showcase the NANOVEA ST400, a 3D Non-Contact Optical Profiler measuring tire tread depth, contour geometry, and rubber surface roughness. A sample surface area large enough to represent the entire tire surface was selected at random for this study. To quantify the rubber’s characteristics, we used the NANOVEA Ultra 3D analysis software to measure groove dimensions, tread depth, surface roughness, and developed vs. projected area.

NANOVEA ST400 Standard
Optical 3D Profilometer

ANALYSIS: TIRE TREAD
The 3D View and False Color View of the treads show the value of mapping 3D surface designs. This provides engineers with a straightforward tool to evaluate tread depth uniformity, groove design, and wear from multiple angles. The Advanced Contour Analysis and Step Height Analysis are both extremely powerful tools for measuring precise dimensions of sample shapes and design.
False color 3D optical profilometry of tire tread depth and groove geometry
3D profilometer surface view of tire tread depth measurement

ADVANCED CONTOUR ANALYSIS

Advanced contour analysis of tire tread grooves using 3D profilometry

STEP HEIGHT ANALYSIS

Step height analysis for tire tread depth measurement with 3D optical profiler
3D profilometry step height profile showing tire tread depth measurement
ANALYSIS: RUBBER SURFACE
The rubber surface can be quantified in numerous ways using built-in software tools as shown in the following figures. It can be observed that the surface roughness is 2.688 μm, and the developed area vs. projected area is 9.410 mm² vs. 8.997 mm². These results demonstrate how rubber surface roughness affects traction and performance, enabling comparisons between different rubber formulations or varying levels of surface wear.
Rubber surface roughness analysis with 3D optical profilometer
ISO 25178 Height Parameters of Tire Rubber Surface
3D optical profilometry view of rubber surface roughness and developed area
Tire Rubber Surface Profiler Parameters

CONCLUSION

In this application, we have shown how the NANOVEA 3D Non-Contact Optical Profiler can precisely characterize tire tread depth, contour dimensions, and rubber surface roughness. The data shows a surface roughness of 2.69 µm and a developed area of 9.41 mm² with a projected area of 9 mm². Various dimensions and radii of the rubber treads were measured as well. This information can be used by tire manufacturers, automotive researchers, and materials engineers to compare tread designs, rubber formulations, or tires with varying degrees of wear. The data shown here represents only a portion of the calculations available in the Ultra 3D analysis software.

Fish Scale Surface Analysis Using 3D Optical Profiler

Fish Scale Surface Analysis Using 3D Optical Profiler

Learn more


FISH SCALE SURFACE ANALYSIS

using 3D OPTICAL PROFILER

Fish Scales profilometer

Prepared by

Andrea Novitsky

INTRODUCTION

The morphology, patterns, and other features of a fish scale are studied using the NANOVEA 3D Non-Contact Optical Profiler. The delicate nature of this biological sample along with its very small and high angled grooves also highlights the importance of the profiler’s non-contact technique. The grooves on the scale are called circuli, and can be studied to estimate the age of the fish, and even distinguish periods of different rates of growth, similar to the rings of a tree. This is very important information for the management of wild fish populations in order to prevent overfishing.

Importance of 3D Non-Contact Profilometry FOR BIOLOGICAL STUDIES

Unlike other techniques such as touch probes or interferometry, the 3D Non-Contact Optical Profiler, using axial chromatism, can measure nearly any surface. Sample sizes can vary widely due to open staging and there is no sample preparation needed. Nano through macro range features are obtained during a surface profile measurement with zero influence from sample reflectivity or absorption. The instrument provides an advanced ability to measure high surface angles with no software manipulation of the results. Any material can be easily measured, whether it’s transparent, opaque, specular, diffusive, polished or rough. The technique provides an ideal, broad and user friendly capability to maximize surface studies along with the benefits of combined 2D & 3D capabilities.

MEASUREMENT OBJECTIVE

In this application, we showcase NANOVEA ST400, a 3D Non-Contact Profiler with a high-speed sensor, providing comprehensive analysis of the surface of a scale.

The instrument has been used to scan the entire sample, along with a higher resolution scan of the center area. The outer and inner side surface roughness of the scale was measured for comparison as well.

NANOVEA

ST400

3D & 2D Surface Characterization of Outer Scale

The 3D View and False Color View of the outer scale show a complex structure similar to a finger print or the rings of a tree. This provides users a straightforward tool to directly observe the surface characterization of the scale from different angles. Various other measurements of the outer scale are shown along with the comparison of the outer and inner side of the scale.

Fish Scale Scan 3D View Profilometer
Fish Scale Scan Volume 3D Profilometer
Fish Scale Scan Step Height 3D Optical Profiler

SURFACE ROUGHNESS COMPARISON

Fish Scale Profilometer 3D Scanning

CONCLUSION

In this application, we have shown how the NANOVEA 3D Non-Contact Optical Profiler can characterize a fish scale in a variety of ways. 

The outer and inner surfaces of the scale can be easily distinguished by surface roughness alone, with roughness values of 15.92μm and 1.56μm respectively. Additionally, precise and accurate information can be learned about a fish scale by analyzing the grooves, or circuli, on the outer surface of the scale. The distance of bands of circuli from the center focus were measured, and the height of the circuli were also found to be approximately 58μm high on average. 

The data shown here represents only a portion of the calculations available in the analysis software.