Stress Relaxation Measurement using Nanoindentation


INTRODUCTION
Viscoelastic materials are characterized as having both viscous and elastic material properties. These materials are subject to time-dependent stress decrease (stress ‘relaxation’) under constant strain, leading to a significant loss of initial contact force. Stress relaxation is dependent on the type of material, texture, temperature, initial stress, and time. Understanding stress relaxation is critical in selecting optimal materials that have the strength and flexibility (relaxation) required for specific applications.
Importance of Stress Relaxation Measurement

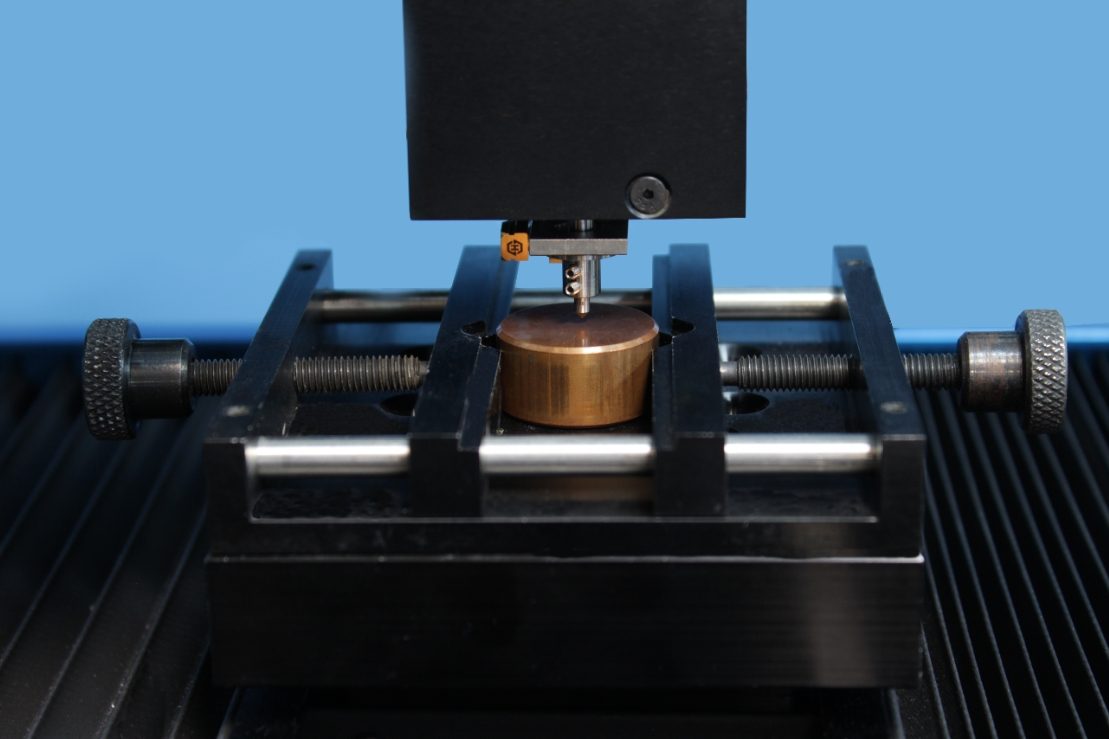
As per ASTM E328i, “Standard Test Methods for Stress Relaxation for Materials and Structures”, an external force is initially applied on a material or structure with an indenter until it reaches a predetermined maximum force. Once the maximum force is reached, the position of the indenter is held constant at this depth. Then the change in external force necessary to maintain the indenter’s position is measured as a function of time. The difficulty in stress relaxation testing is maintaining the depth constant. The Nanovea Mechanical Tester’s nanoindentation module accurately measures the stress relaxation by applying a closed (feedback) loop control of the depth with a piezo-electric actuator. The actuator reacts in real-time to keep the depth constant, while the change in load is measured and recorded by a highly sensitive load sensor. This test can be performed on virtually all types of materials without the need for stringent sample dimension requirements. Additionally, multiple tests can be performed on a single flat sample to ensure test repeatability
MEASUREMENT OBJECTIVE
In this application, the Nanovea Mechanical Tester’s nanoindentation module measures the stress relaxation behavior of an acrylic and copper sample. We showcase that the Nanovea Mechanical Tester is an ideal tool for evaluating the time-dependent viscoelastic behavior of polymer and metal materials.
TEST CONDITIONS
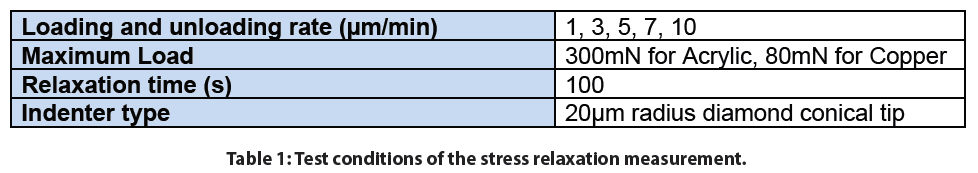
The stress relaxation of an acrylic and a copper sample was measured by the Nanovea Mechanical Tester’s nanoindentation module. Different indentation loading rates were applied ranging from 1 to 10 µm/min. The relaxation was measured at a fixed depth once the target maximum load was reached. A 100 second holding period was implemented at a fixed depth and the change in load was recorded as the holding time elapsed. All of the tests were conducted at ambient conditions (room temperature of 23 °C) and the indentation test parameters are summarized in Table 1.
RESULTS AND DISCUSSION
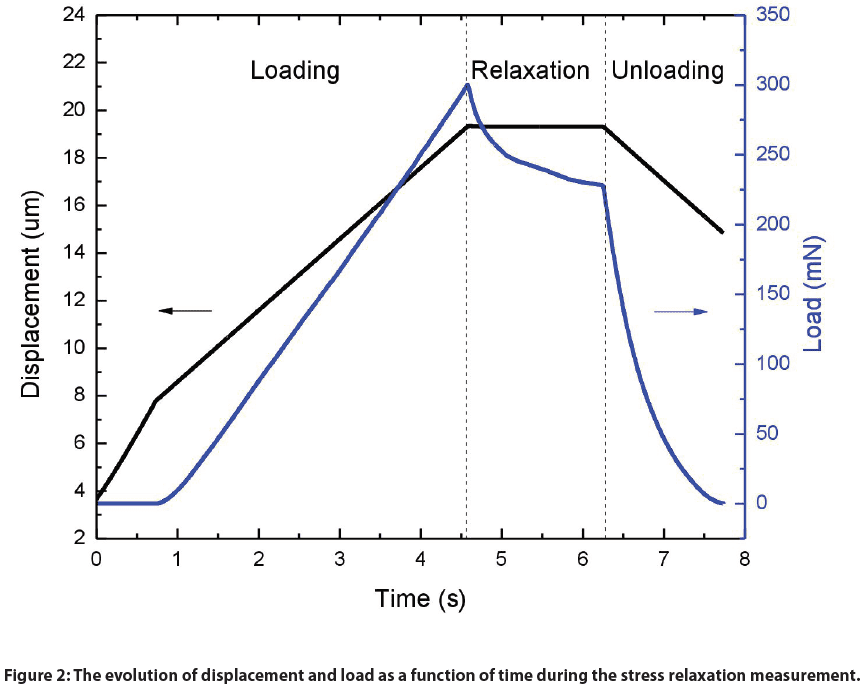
Figure 2 shows the evolution of displacement and load as a function of time during the stress relaxation measurement of an acrylic sample and an indentation loading rate of 3 µm/min as an example. The entirety of this test can be broken down into three stages: Loading, Relaxation and Unloading. During the Loading stage, the depth linearly increased as the load progressively increased. The Relaxation stage was initiated once the maximum load was reached. During this stage a constant depth was maintained for 100 seconds by using the closed feedback loop depth control feature of the instrument and it was observed that the load decreased over time. The entire test concluded with an unloading stage in order to remove the indenter from the acrylic sample.
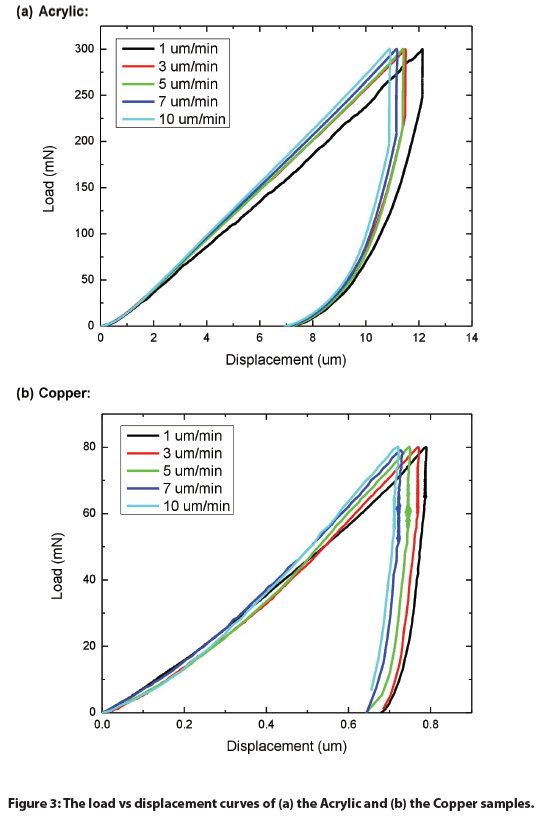
Additional indentation tests were conducted using the same indenter loading rates but excluding a relaxation (creep) period. Load vs. displacement plots were acquired from these tests and were combined in the graphs in Figure 3 for the acrylic and copper samples. As the indenter loading rate decreased from 10 to 1 µm/min, the load-displacement curve shifted progressively towards higher penetration depths for both Acrylic and Copper. Such a time-dependent increase in strain results from the viscoelastic creep effect of the materials. A lower loading rate allows a viscoelastic material to have more time to react to the external stress it experiences and to deform accordingly..
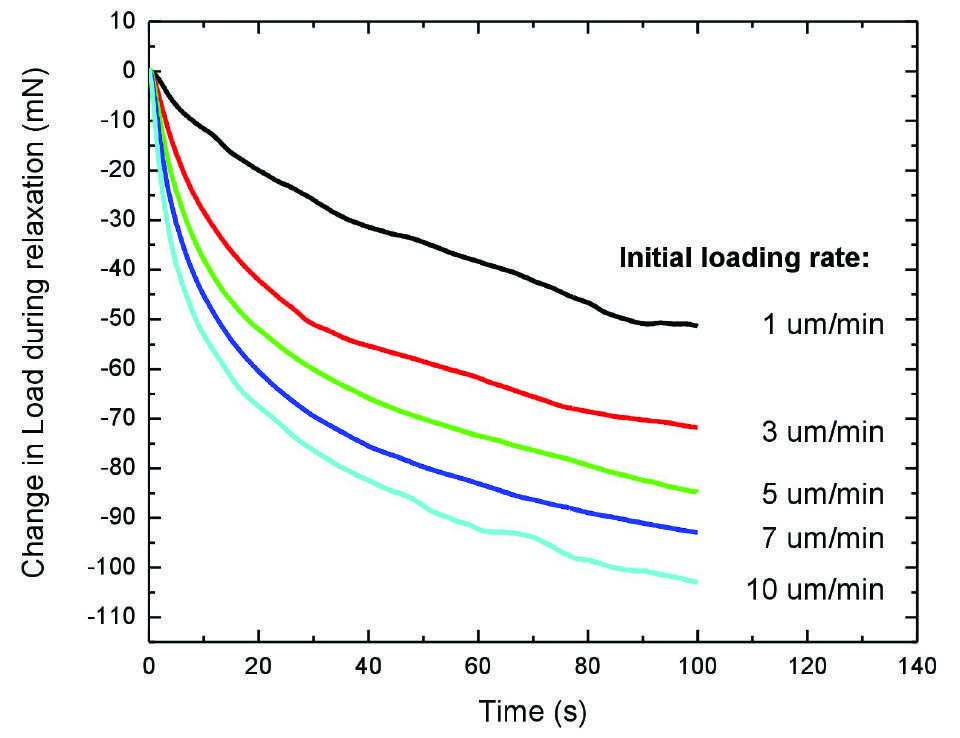
The evolution of load at a constant strain using different indentation loading rates were plotted in Figure 4 for both materials tested. The load decreased at a higher rate in the early stages of the relaxation stage (100 second hold period) of the tests and slowed down once the hold time reached ~50 seconds. Viscoelastic materials, such as polymers and metals, exhibit greater load loss rate when they are subjected to higher indentation loading rates. The load loss rate during relaxation increased from 51.5 to 103.2 mN for Acrylic, and from 15.0 to 27.4 mN for Copper, respectively, as the indentation loading rate increased from 1 to 10 µm/min, as summarized in Figure 5.


As mentioned In ASTM Standard E328ii, the major problem encountered in stress relaxation tests is an instrument’s inability of maintaining a constant strain/depth. The Nanovea Mechanical Tester provides excellent accurate stress relaxation measurements due to its ability to apply a closed feedback loop control of the depth between the fast acting piezo-electric actuator and the independent capacitor depth sensor. During the relaxation stage, the piezo-electric actuator adjusts the indenter to maintain its constant depth constraint in real-time while the change in load is measured and recorded by an independent high precision load sensor.
CONCLUSION

The stress relaxation of an acrylic and a copper sample were measured using the nanoindentation module of the Nanovea Mechanical Tester at different loading rates. A greater maximum depth is reached when indentations are performed at lower loading rates due to the creep effect of the material during loading. Both the acrylic and the copper sample exhibit stress relaxation behavior when the indenter position at a targeted maximum load is held constant. Larger changes in load loss during the relaxation stage were observed for the tests with higher indentation loading rates.
The stress relaxation test produced by the Nanovea Mechanical Tester showcase the instruments ability to quantify and reliably measure the time-dependent viscoelastic behavior of polymer and metal materials. It has an unmatched multi-function Nano and Micro modules on a single platform. Humidity and temperature control modules can be paired with these instruments for environmental testing capabilities applicable to a wide range of industries. Both the Nano and Micro modules include scratch testing, hardness testing, and wear testing modes, providing the widest and most user-friendly range of mechanical testing capabilities available on a single system.
Understanding Coating Failures using Scratch Testing
Introduction:
Surface engineering of materials plays a significant role in a variety of functional applications, ranging from decorative appearance to protecting the substrates from wear, corrosion and other forms of attacks. An important and overriding factor that determines the quality and service lifetime of the coatings is their cohesive and adhesive strength.

High Speed Scanning w/ Non-contact Profilometry
Introduction:
Quick and easy set-up surface measurements save time, effort and are essential for quality control, research and development and production facilities. The Nanovea Non-Contact Profilometer is capable of performing both 3D & 2D surface scans to measure nano to macro scale features on any surface, providing broad range usability.

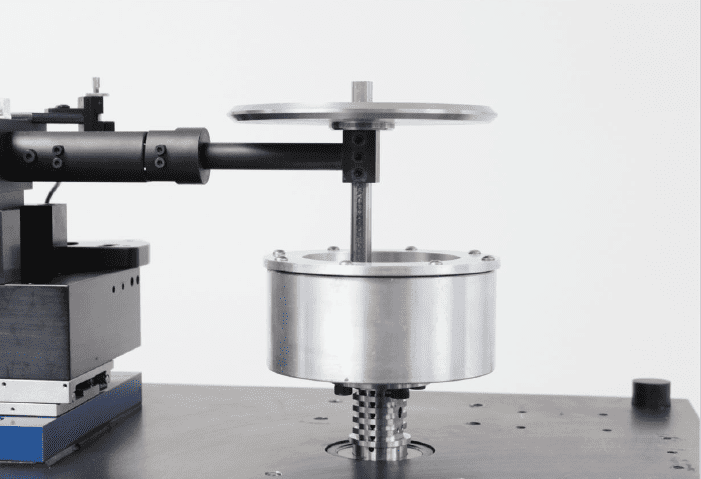
Continuous Stribeck Curve Measurement using Pin-on-Disk Tribometer
Introduction:
When lubrication is applied to reduce the wear/friction of moving surfaces, the lubrication contact at the interface can shift from several regimes such as Boundary, Mixed and Hydrodynamic Lubrication. The thickness of the fluid film plays a major role in this process, mainly determined by the fluid viscosity, the load applied at the interface and the relative speed between the two surfaces. How the lubrication regimes react to friction is shown in what is called a Stribeck [1-4] curve.
In this study we demonstrate for the first time the ability to measure a continuous Stribeck Curve. Using the Nanovea Tribometer advanced step-less speed control, from 15000 to 0.01 rpm, within 10 minutes the software directly provides a complete Stribeck Curve. The simple initial setup only requires users to select the Exponential Ramp Mode and enter initial and final speeds, rather than having to perform multiple tests or program a stepwise procedure at different speeds requiring data stitching for the conventional Stribeck curve measurements. This advancement provides precise data throughout lubricant regime evaluation and substantially reduces time and cost. The test shows a great potential to be used in different industrial engineering applications.

Surface Roughness and Features of a Solar Cell
Importance of Solar Panel Testing
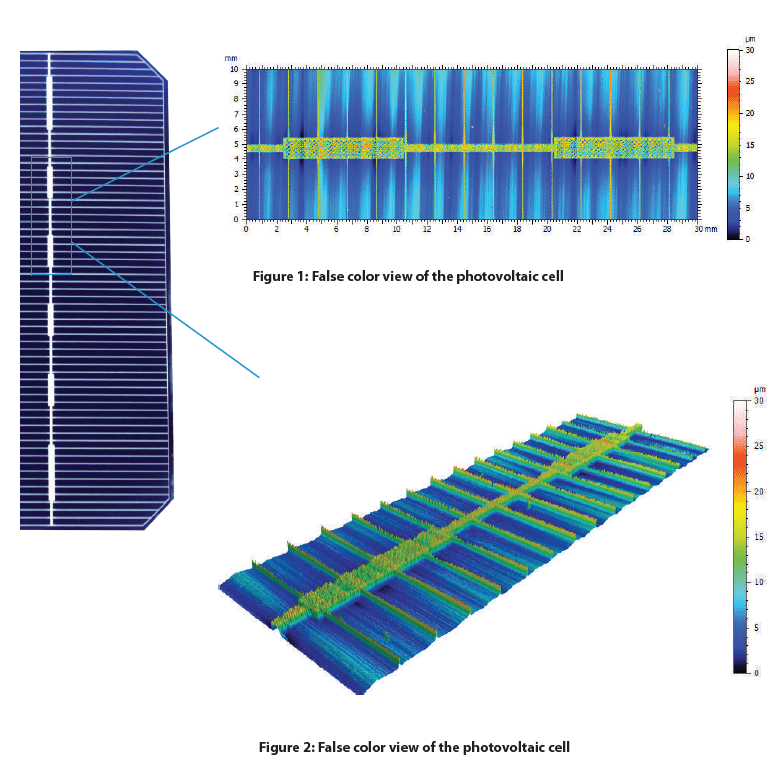
Maximizing a solar cell’s energy absorption is key for the technology’s survival as a renewable resource. The multiple layers of coating and glass protection allow for the absorption, transmittance, and reflection of light that is necessary for the photovoltaic cells to function. Given that most consumer solar cells operate at 15-18% efficiency, optimizing their energy output is an ongoing battle.
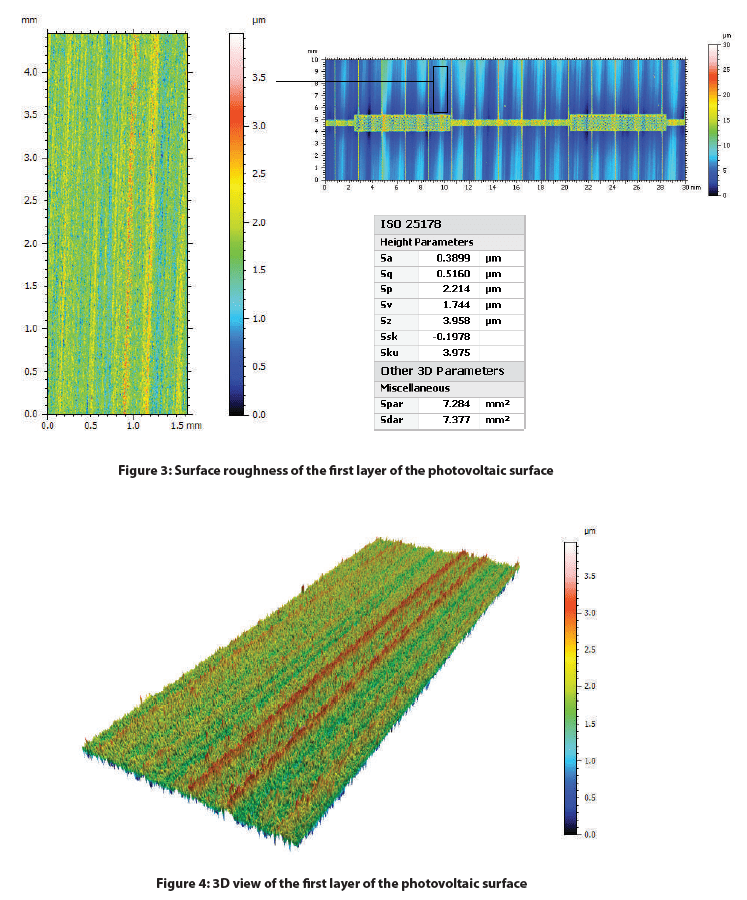
Studies have shown that surface roughness plays a pivotal role in the reflectance of light. The initial layer of glass must be as smooth as possible to mitigate the reflectance of light, but the subsequent layers do not follow this guideline. A degree of roughness is necessary at each coatings interface to another to increase the possibility of light scattering within their respective depletion zones and increase the absorption of light within the cell1. Optimizing the surface roughness in these regions allows the solar cell to operate to the best of its ability and with the Nanovea HS2000 High Speed Sensor, measuring surface roughness can be done quickly and accurately.
Measurement Objective
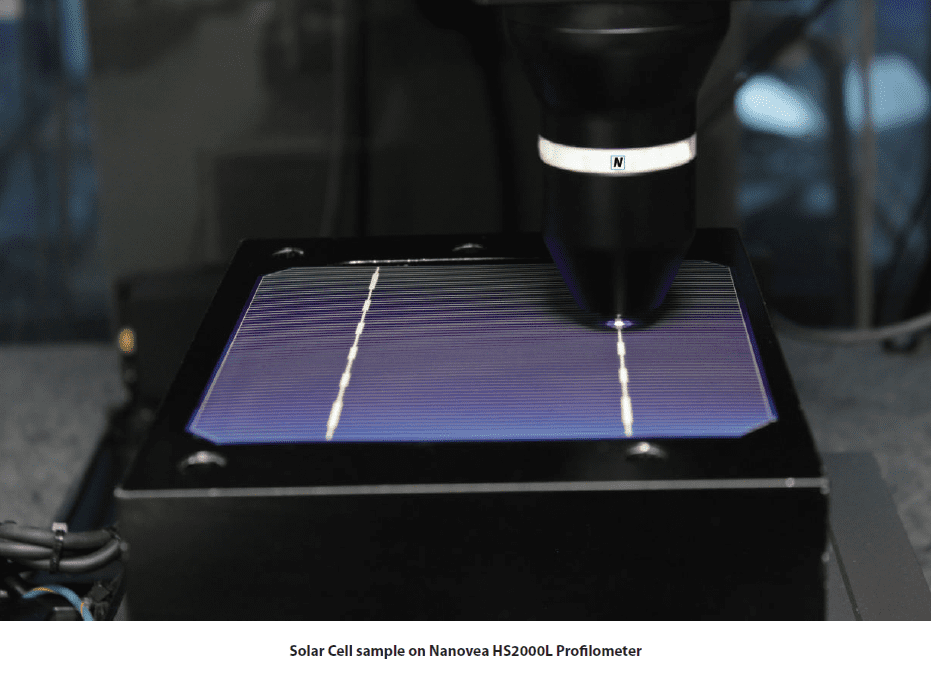
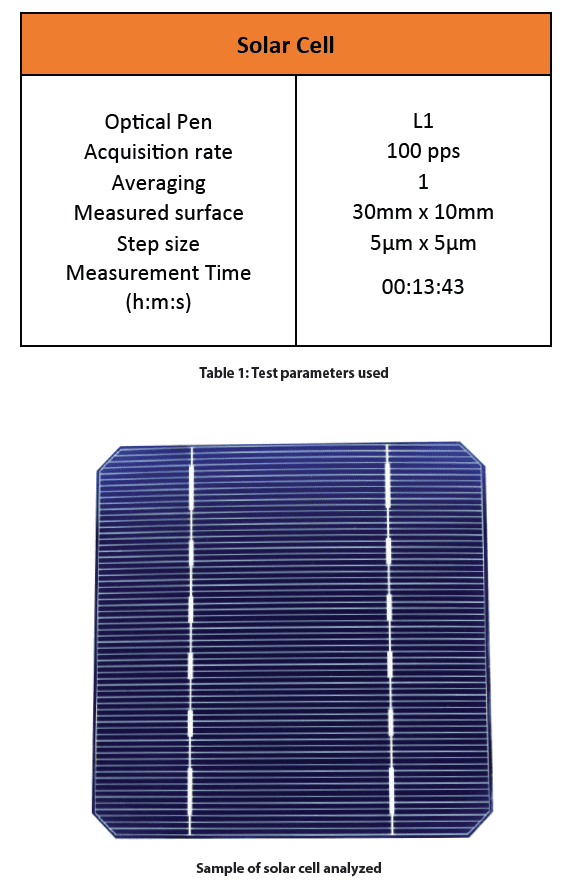
In this study we will display the capabilities of the Nanovea Profilometer HS2000 with High Speed Sensor by measuring the surface roughness and geometric features of a photovoltaic cell. For this demonstration a monocrystalline solar cell with no glass protection will be measured but the methodology can be used for various other applications.
Test Procedure and Procedures
The following test parameters were used to measure the surface of the solar cell.
Results and Discussion
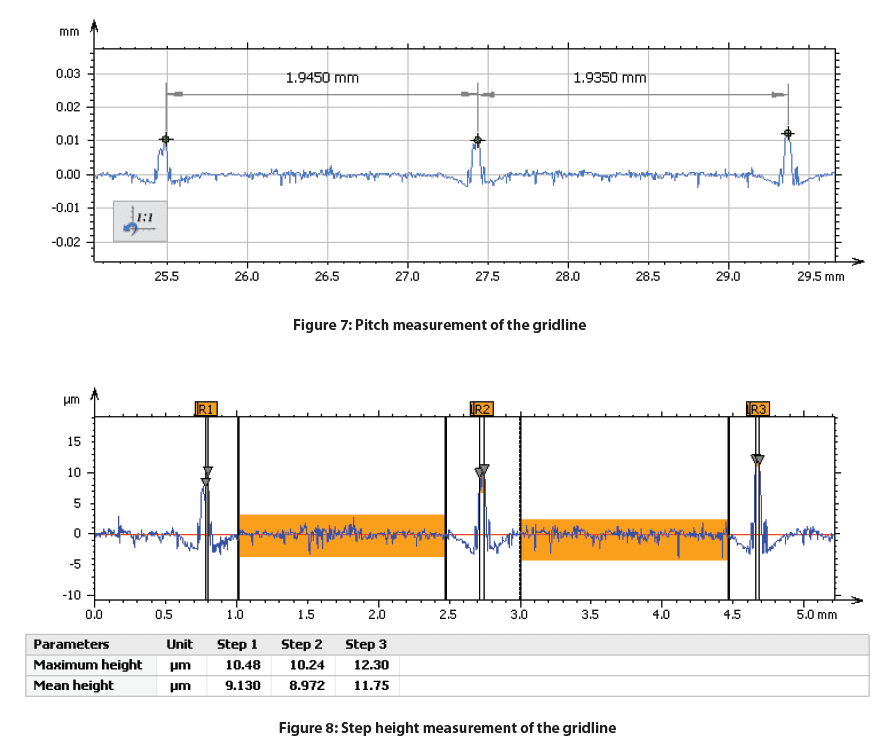
Depicted below is the 2D false-color view of the solar cell and an area extraction of the surface with its respective height parameters. A Gaussian filter was applied to both surfaces and a more aggressive index was used to flatten the extracted area. This excludes form (or waviness) larger than the cut-off index, leaving behind features that represent the solar cell’s roughness.
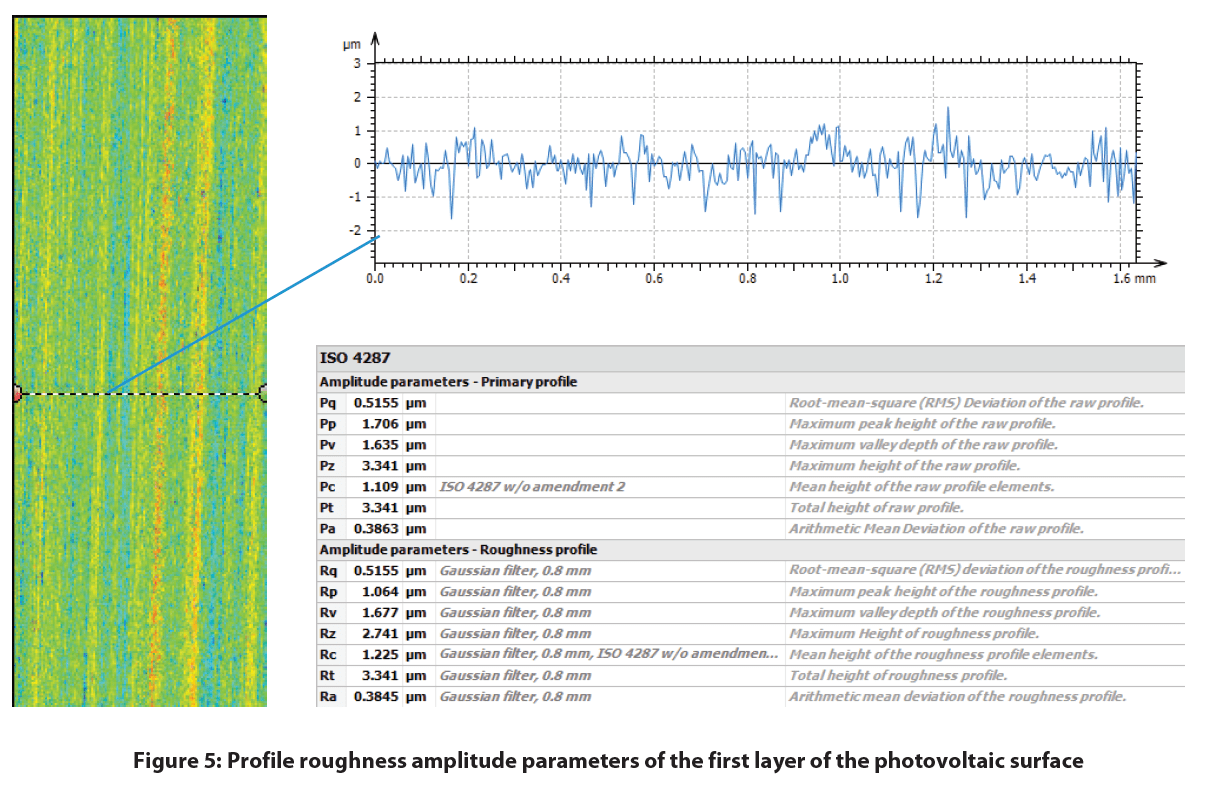
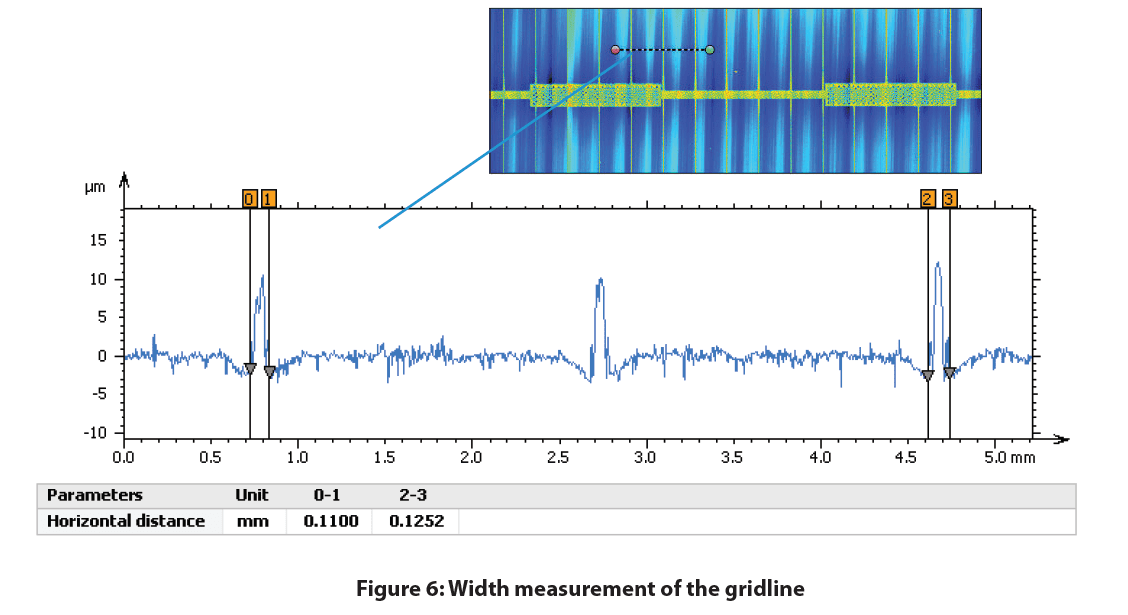
A profile was taken perpendicular to the orientation of the gridlines to measure their geometric characteristics which is shown below. The gridline width, step height, and pitch can be measured for any specific location on the solar cell.
Conclusion

In this study we were able to display the Nanovea HS2000 Line Sensor’s ability to measure a monocrystalline photovoltaic cell’s surface roughness and features. With the ability to automate accurate measurements of multiple samples and set pass fail limits, the Nanovea HS2000 Line Sensor is a perfect choice for quality control inspections.
Reference
1 Scholtz, Lubomir. Ladanyi, Libor. Mullerova, Jarmila. “Influence of Surface Roughness on Optical Characteristics of Multilayer Solar Cells “ Advances in Electrical and Electronic Engineering, vol. 12, no. 6, 2014, pp. 631-638.

Lubricating Eye Drop Comparison using the Nanovea T50 Tribometer
Importance of Testing Eye Drop Solutions
Eye drop solutions are used to alleviate symptoms caused by a range of eye problems. For example, they can be used to treat minor eye irritation (e.g. dryness and redness), delay the onset of glaucoma or treat infections. Eye drop solutions sold over-the-counter are mainly used to treat dryness. Their effectiveness in lubricating the eye can be compared and measured with a coefficient of friction test.
Dry eyes can be caused by a wide range of factors, for example, computer eye strain or being outdoors in extreme weather conditions. Good lubricating eye drops help maintain and supplement the moisture on the outer surface of the eyes. This works to alleviate the discomfort, burning or irritation and redness associated with dry eyes. By measuring the coefficient of friction (COF) of an eye drop solution, its lubricating efficiency and how it compares to other solutions can be determined.
Measurement Objective
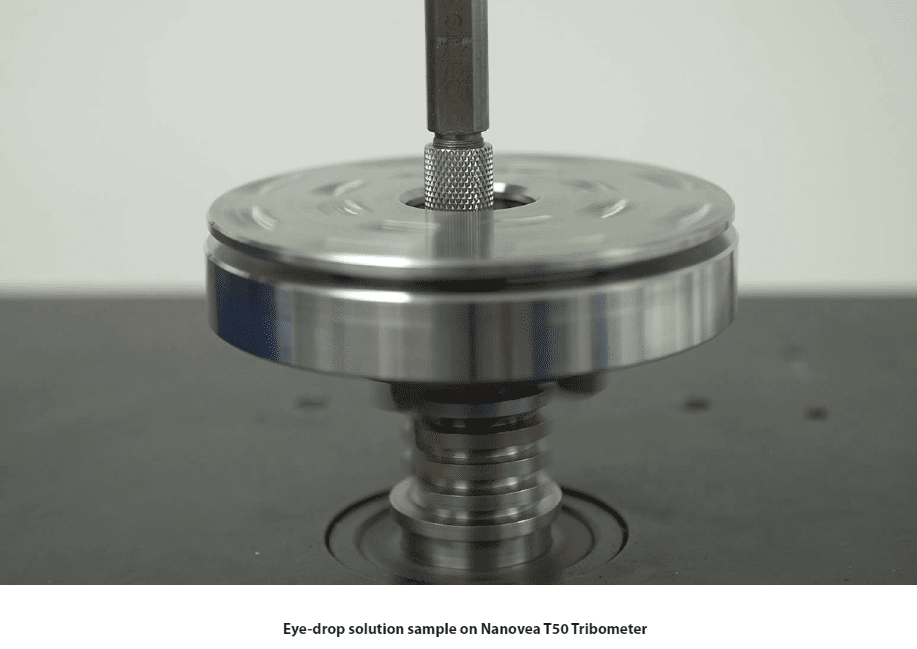
In this study, the coefficient of friction (COF) of three different lubricating eye drop solutions was measured using the pin-on-disk setup on the Nanovea T50 Tribometer.
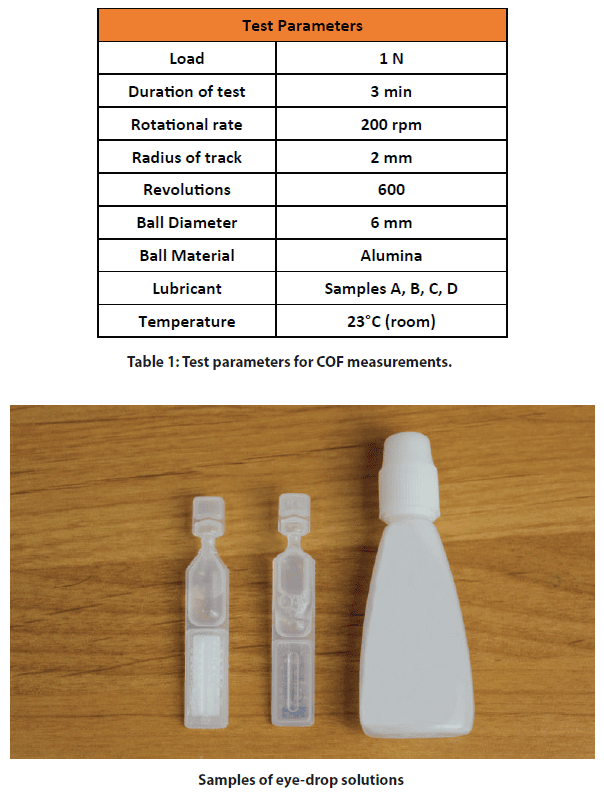
Test Procedure and Procedures
A 6mm diameter spherical pin made of alumina was applied to a glass slide with each eye drop solution acting as the lubricant between the two surfaces. The test parameters used for all experiments are summarized in Table 1 below.
Results and Discussion
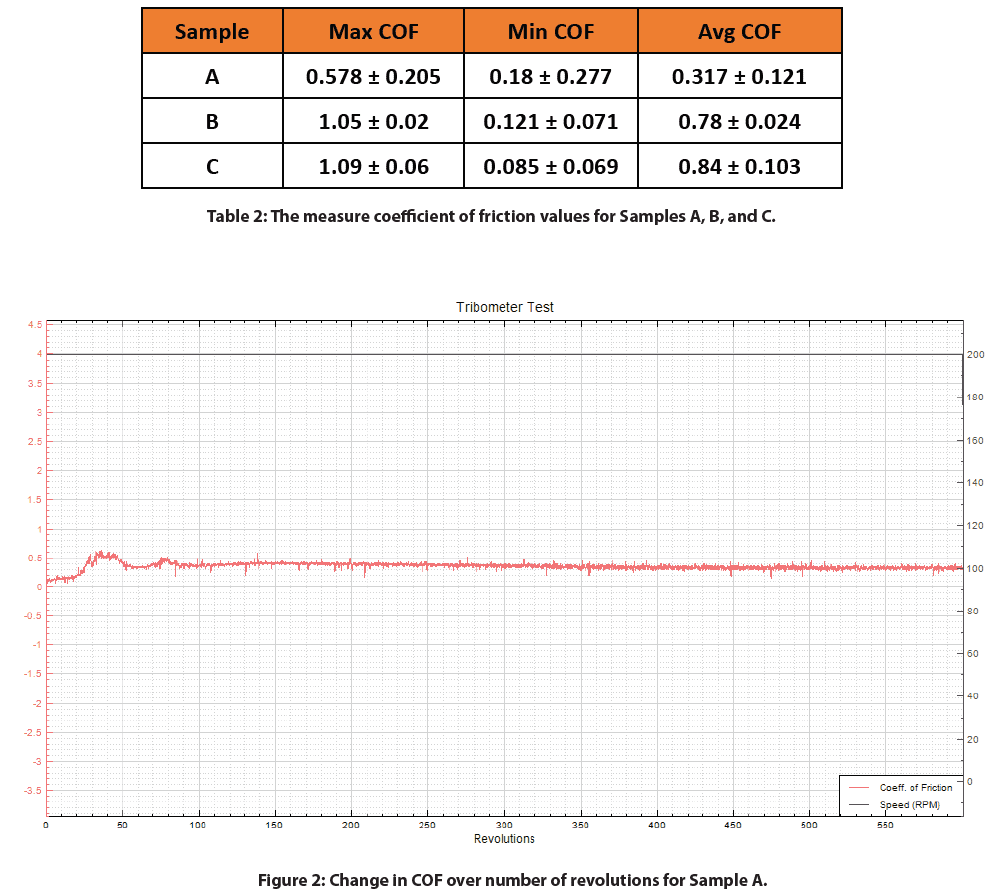
The maximum, minimum, and average coefficient of friction values for the three different eye drop solutions tested are tabulated in Table 2 below. The COF v. Revolutions graphs for each eye drop solution are depicted in Figures 2-4. The COF during each test remained relatively constant for most of the total test duration. Sample A had the lowest average COF indicating it had the best lubrication properties.
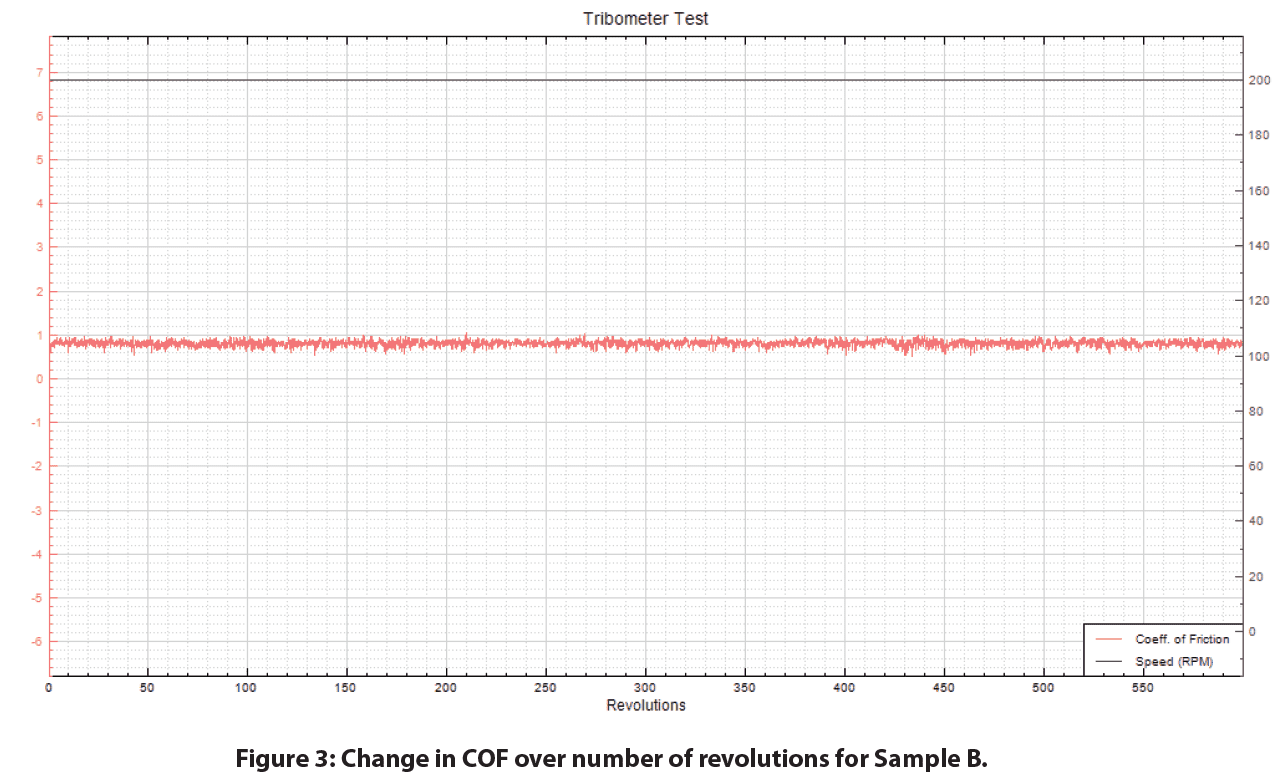
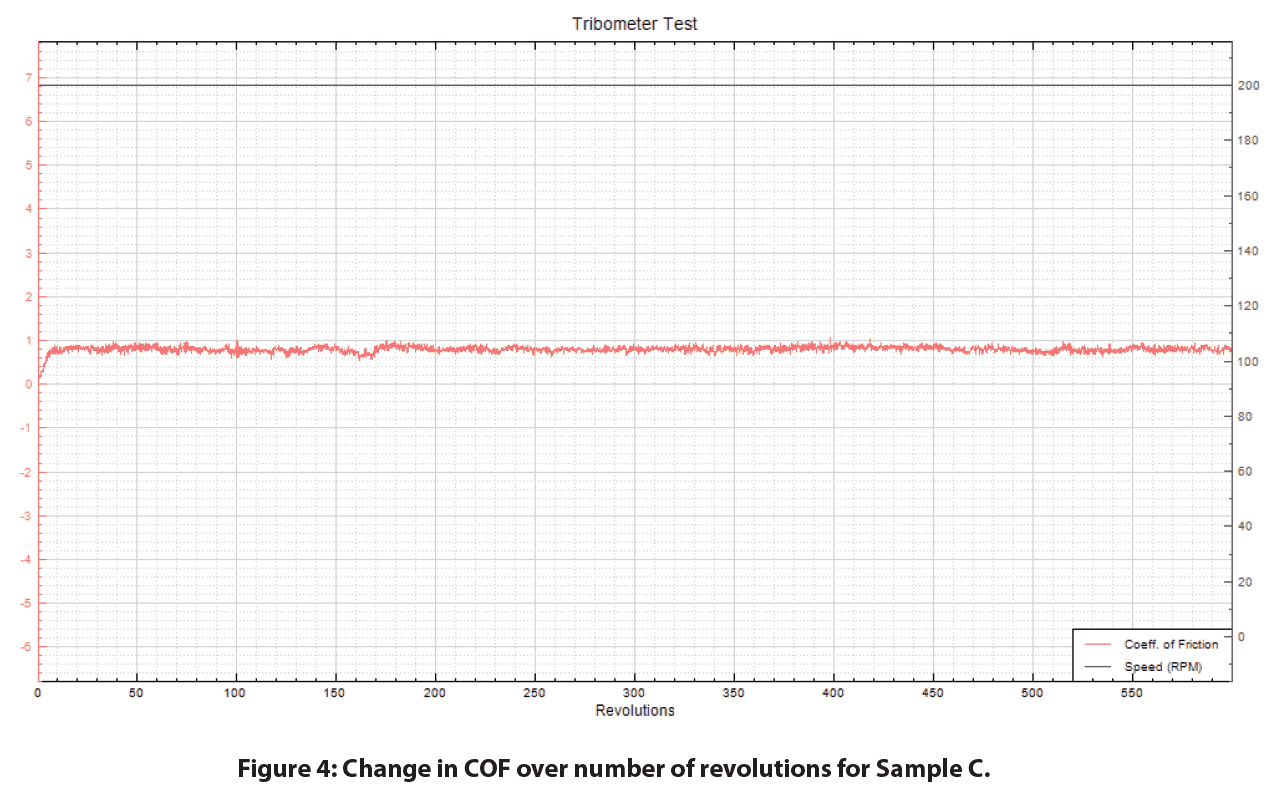
Conclusion

In this study we showcase the capability of the Nanovea T50 Tribometer in measuring the coefficient of friction of three eye drop solutions. Based on these values, we show that Sample A had a lower coefficient of friction and therefore exhibits better lubrication in comparison to the other two samples.
Nanovea Tribometers offers precise and repeatable wear and friction testing using ISO and ASTM compliant rotative and linear modules. It also provides optional high temperature wear, lubrication, and tribo-corrosion modules available in one pre-integrated system. Such versatility allows users to better simulate the real application environment and improve fundamental understanding of the wear mechanism and tribological characteristics of various materials.
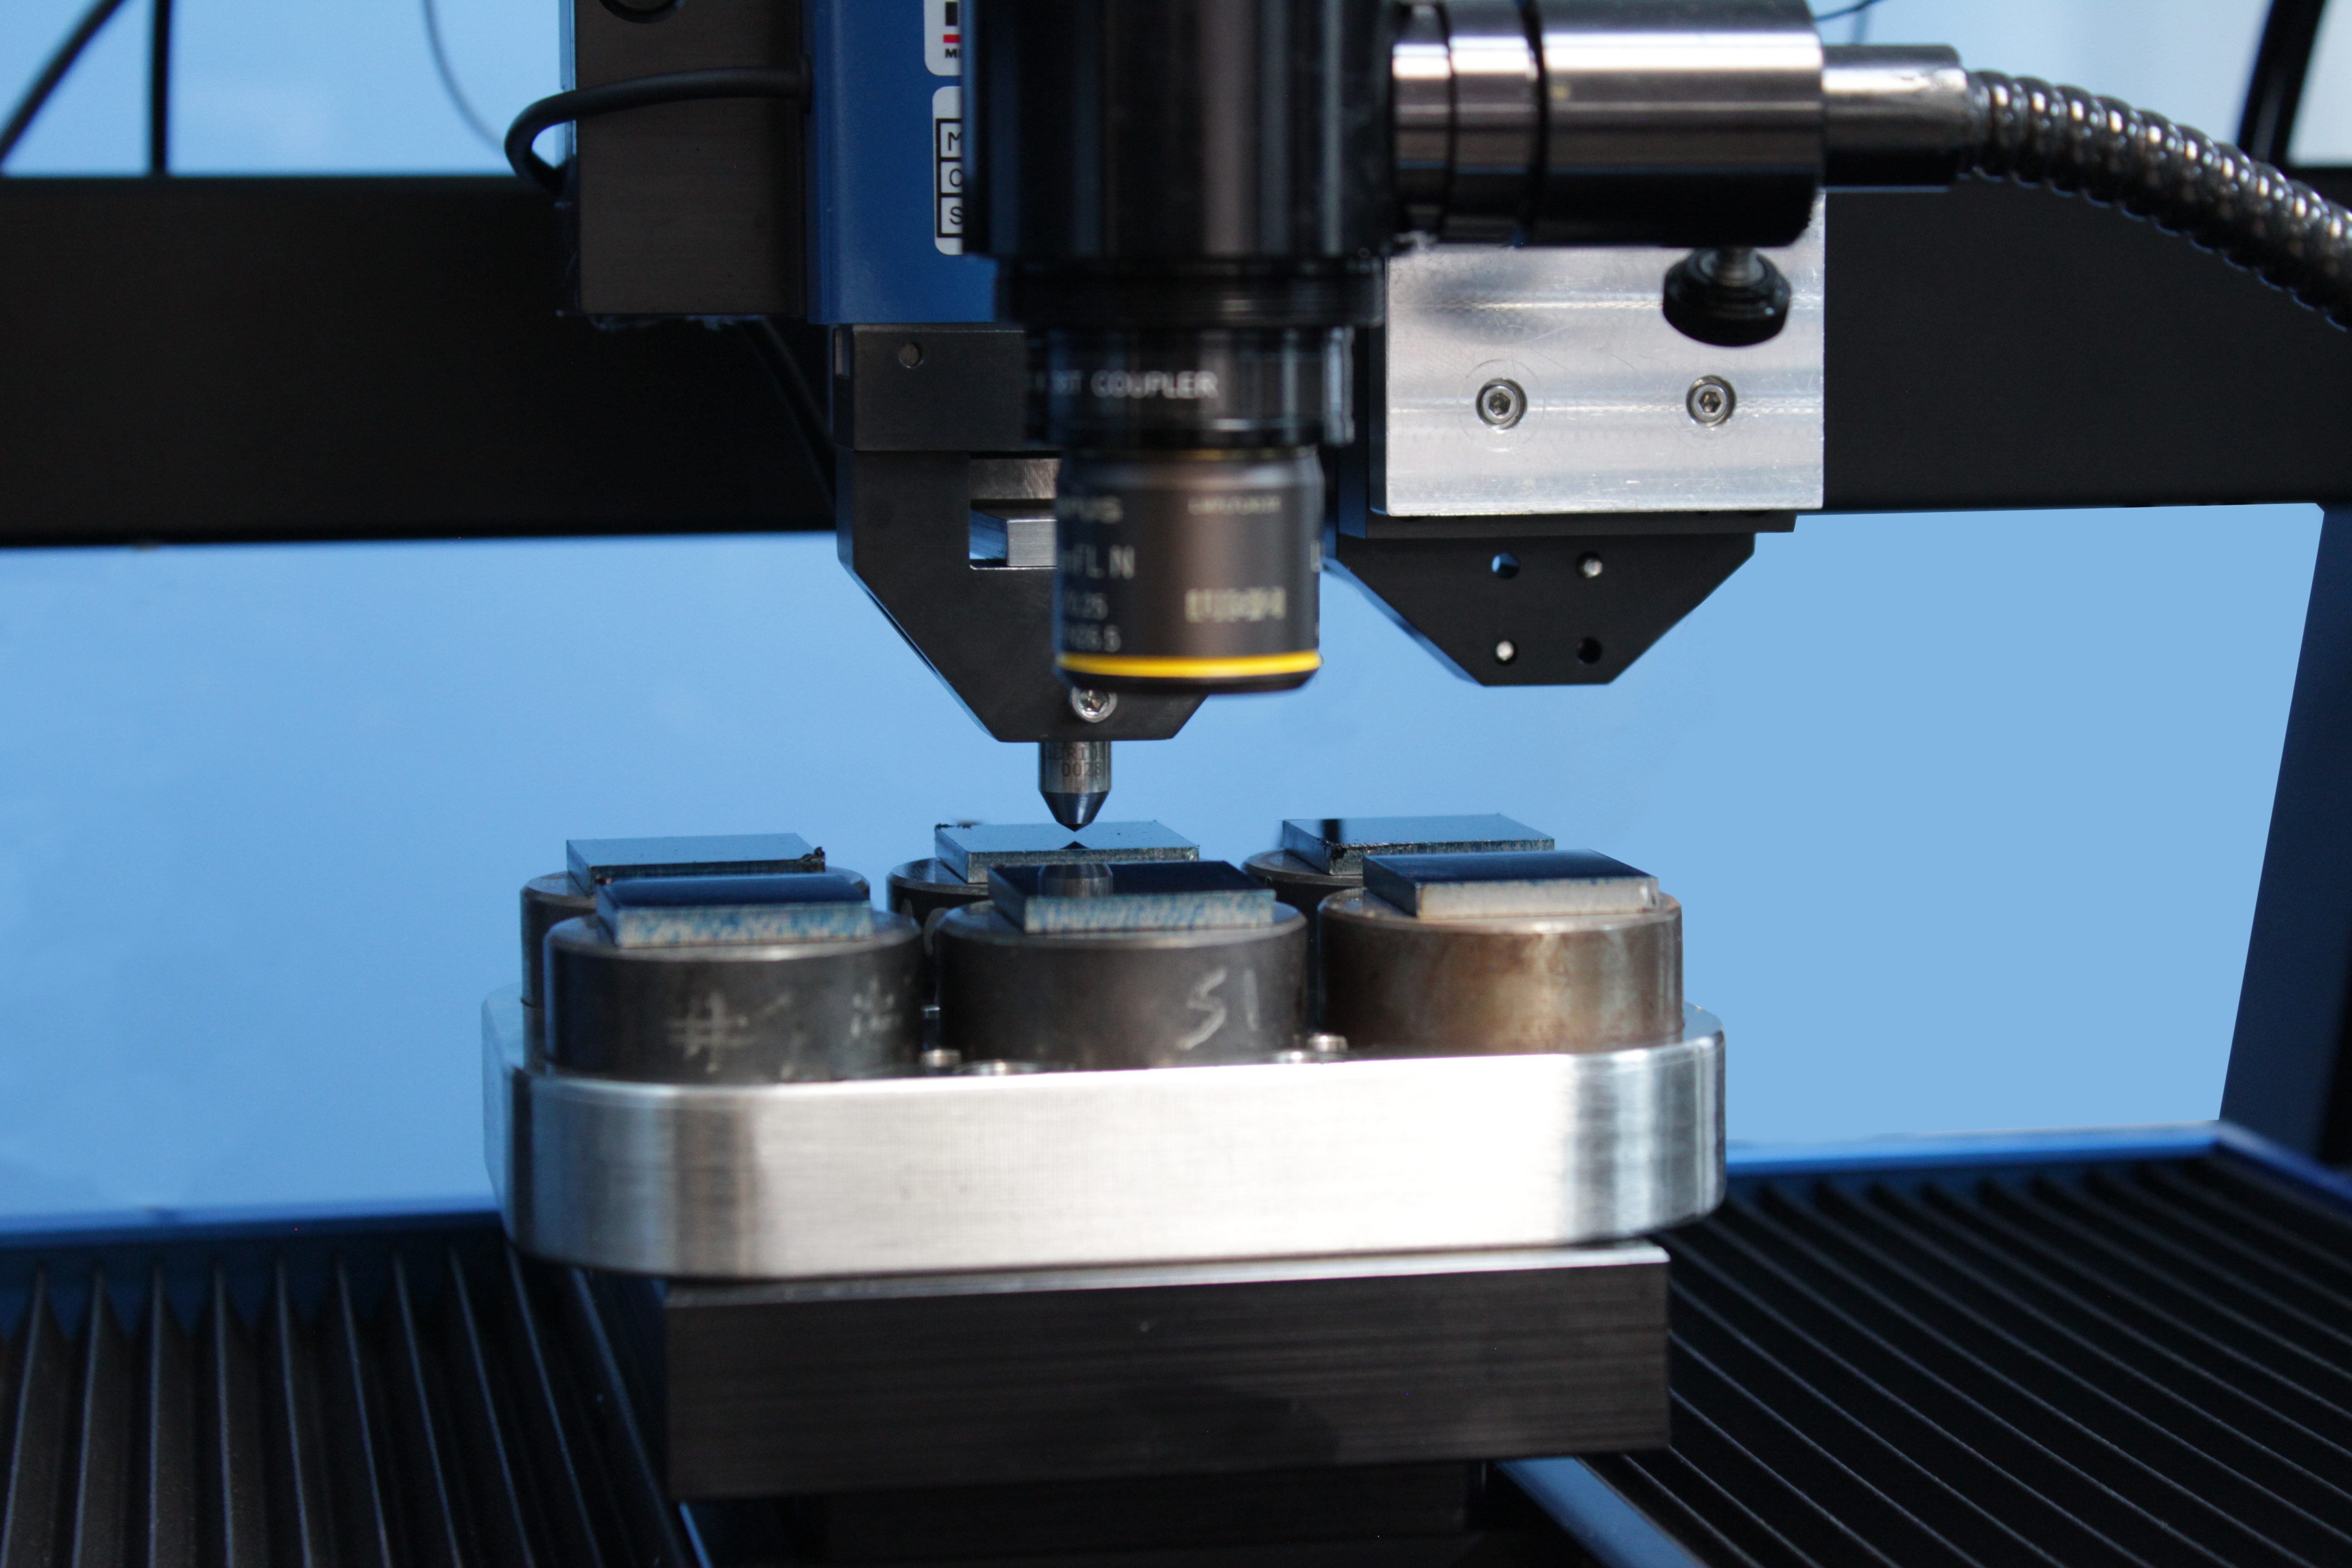
Multi Scratch Automation of Similar Samples using the PB1000 Mechanical Tester
Introduction :
Coatings are widely used in various industries because of their functional properties. A coating’s hardness, erosion resistance, low friction, and high wear resistance are just some of the many properties that make coatings important. A commonly used method to quantify these properties is scratch testing, this allows for a repeatable measurement of a coating’s adhesive and/or cohesive properties. By comparing the critical loads at which failure occurs, the intrinsic properties of a coating can be evaluated.
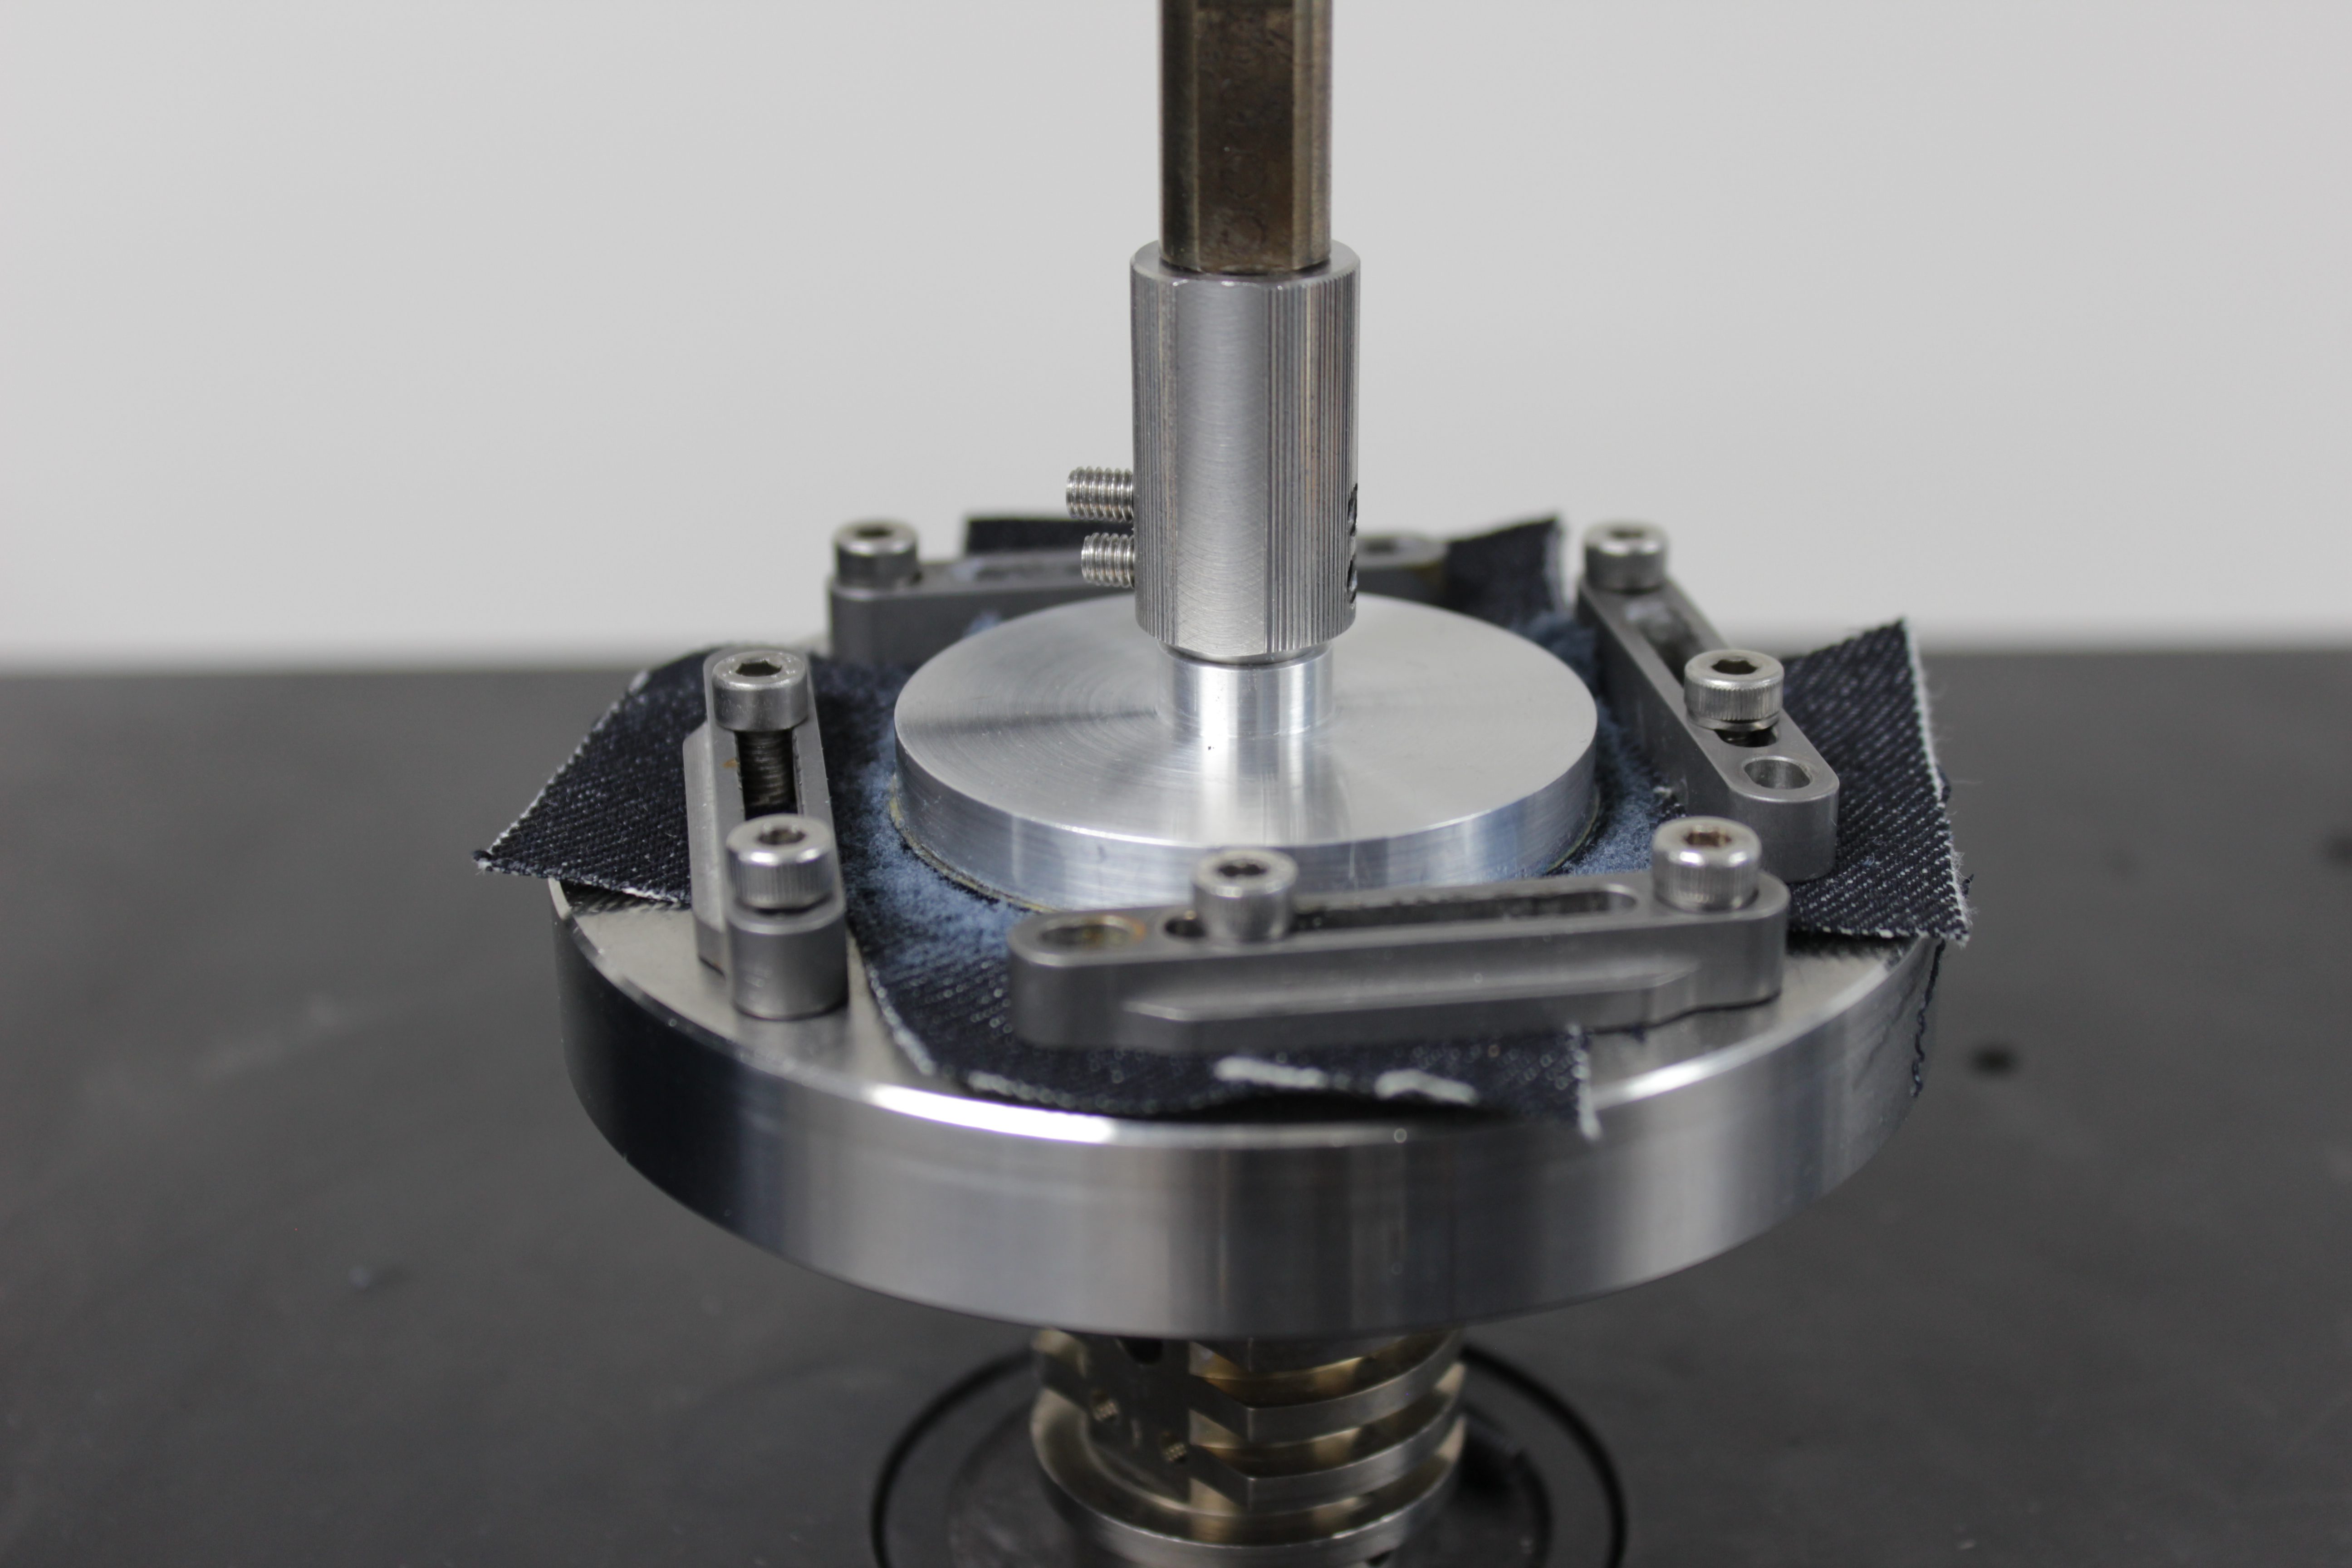
Comparing Abrasion Wear on Denim
Introduction
The form and function of a fabric is determined by its quality and durability. Daily usage of fabrics cause wear and tear on the material, e.g. piling, fuzzing, and discoloration. Subpar fabric quality used for clothing can often lead to consumer dissatisfaction and brand damage.
Attempting to quantify the mechanical properties of fabrics can pose many challenges. The yarn structure and even the factory in which it was produced can result in poor reproducibility of test results. Making it difficult to compare test results from different laboratories. Measuring the wear performance of fabrics is critical to the manufacturers, distributors, and retailers in the textile production chain. A well controlled and reproducible wear resistance measurement is crucial to ensure reliable quality control of the fabric.
Click to read the full application note!
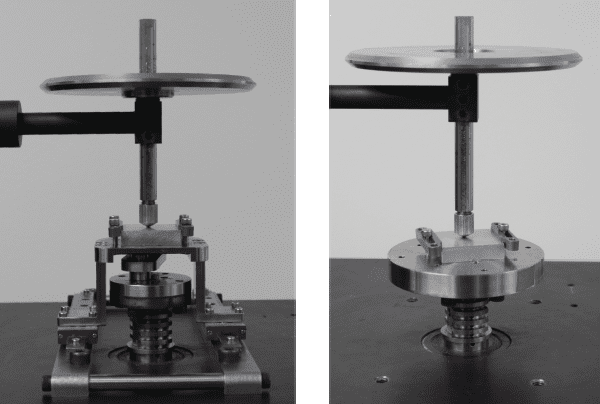
Rotative or Linear Wear & COF? (A Comprehensive Study Using the Nanovea Tribometer)
Wear is the process of removal and deformation of material on a surface as a result of the mechanical action of the opposite surface. It is influenced by a variety of factors, including unidirectional sliding, rolling, speed, temperature, and many others. The study of wear, tribology, spans many disciplines, from physics and chemistry to mechanical engineering and material science. The complex nature of wear requires isolated studies toward specific wear mechanisms or processes, such as adhesive wear, abrasive wear, surface fatigue, fretting wear, and erosive wear. However, “Industrial Wear” commonly involves multiple wear mechanisms occurring in synergy.
Linear reciprocating and Rotative (Pin on Disk) wear tests are two widely used ASTM-compliant setups for measuring sliding wear behaviors of materials. Since the wear rate value of any wear test method is often used to predict the relative ranking of material combinations, it is extremely important to confirm the repeatability of the wear rate measured using different test setups. This enables users to carefully consider the wear rate value reported in the literature, which is critical in understanding the tribological characteristics of materials.
Nano Mechanical Characterization of Spring Constants
A spring’s ability to store mechanical energy has a long history of use. From bows for hunting to locks for doors, spring technology has been around for many centuries. Nowadays we rely on springs, be it from mattresses, pens, or automotive suspension, as they play a vital role in our daily lives. With such a wide variety of use and designs, the ability to quantify their mechanical properties is necessary.