EN
EN  ES
ES  DE
DE  FR
FR  IT
IT  ZH
ZH  JA
JA  PT
PT  TR
TR  KO
KO  PL
PL  AR
AR Category: Profilometry | Flatness and Warpage

Honeycomb Panel Surface Finish with 3D Profilometry
INTRODUCTION
Roughness, porosity, and texture of the honeycomb panel surface are critical to quantify for the final panel design. These surface qualities can directly correlate to the aesthetics and functional characteristics of the panel surface. A better understanding of the surface texture and porosity can help optimize the panel surface processing and manufacturability. A quantitative, precise, and reliable surface measurement of the honeycomb panel is needed to control surface parameters for application and painting requirements. The Nanovea 3D Non-Contact sensors utilize unique chromatic confocal technology capable of precisely measuring these panel surfaces.
MEASUREMENT OBJECTIVE
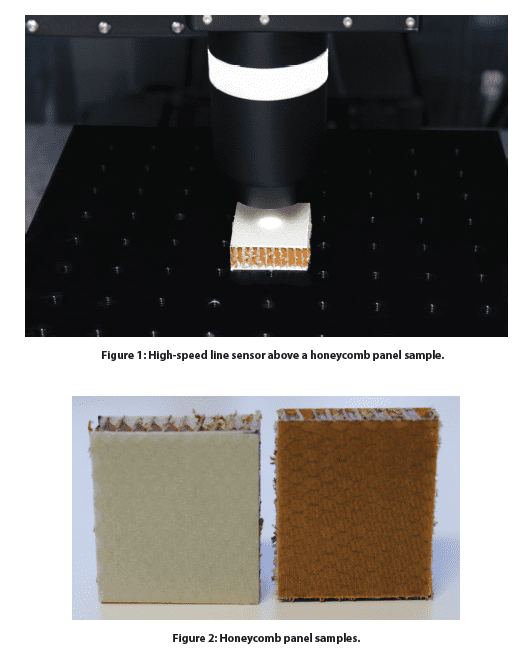
In this study, the Nanovea HS2000 platform equipped with a high-speed Line Sensor was used to measure and compare two honeycomb panels with different surface finishes. We showcase the Nanovea non-contact profilometer’s ability to provide fast and precise 3D profiling measurements and comprehensive in-depth analysis of the surface finish.
RESULTS AND DISCUSSION
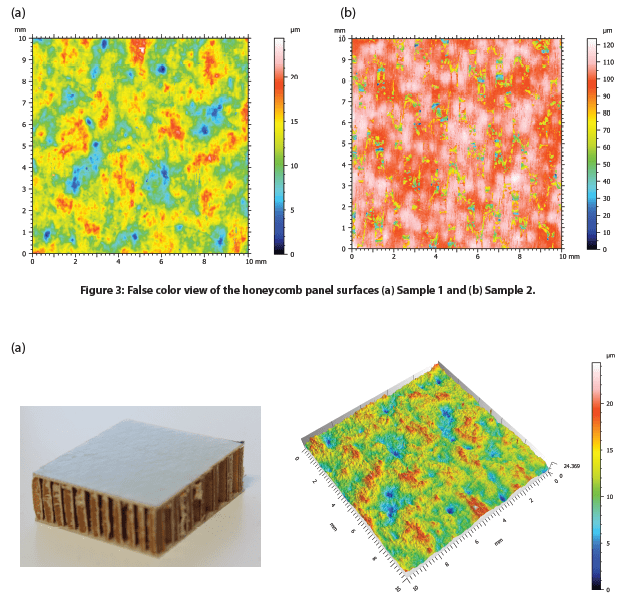
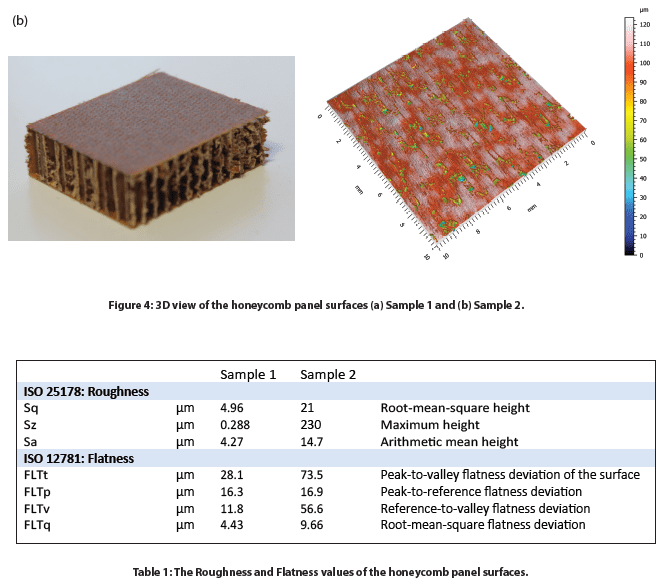
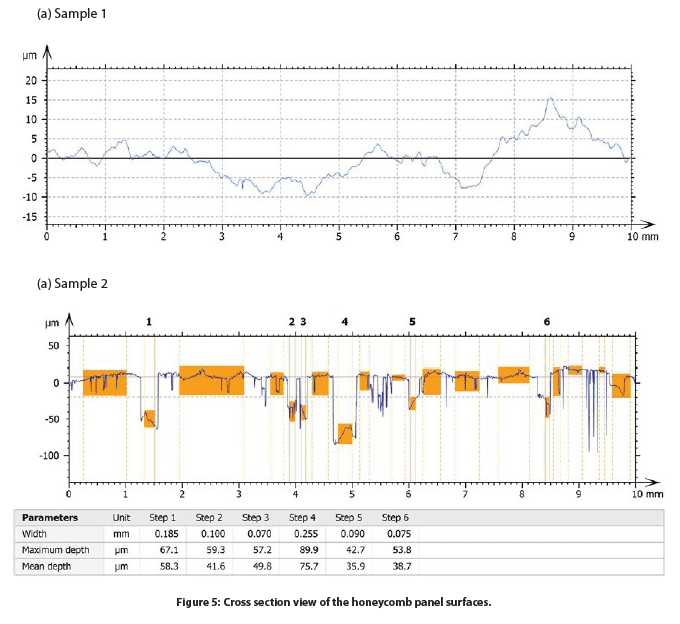
The surface of two honeycomb panel samples with varied surface finishes, namely Sample 1 and Sample 2, were measured. The false color and 3D view of the Samples 1 and 2 surfaces are shown in Figure 3 and Figure 4, respectively. The roughness and flatness values were calculated by advanced analysis software and are compared in Table 1. Sample 2 exhibits a more porous surface compared to Sample 1. As a result, Sample 2 possesses a higher roughness Sa of 14.7 µm, compared to an Sa value of 4.27 µm for Sample 1.
The 2D profiles of the honeycomb panel surfaces were compared in Figure 5, allowing users to have a visual comparison of the height change at different locations of the sample surface. We can observe that Sample 1 has a height variation of ~25 µm between the highest peak and lowest valley location. On the other hand, Sample 2 shows several deep pores across the 2D profile. The advanced analysis software has the ability to automatically locate and measure the depth of six relatively deep pores as shown in the table of Figure 4.b Sample 2. The deepest pore amongst the six possesses a maximum depth of nearly 90 µm (Step 4).
To further investigate the pore size and distribution of Sample 2, porosity evaluation was performed and discussed in the following section. The sliced view is displayed in Figure 5 and the results are summarized in Table 2. We can observe that the pores, marked in blue color in Figure 5, have a relatively homogeneous distribution on the sample surface. The projected area of the pores constitutes 18.9% of the whole sample surface. The volume per mm² of the total pores is ~0.06 mm³. The pores have an average depth of 42.2 µm, and the maximum depth is 108.1 µm.

CONCLUSION

In this application, we have showcased that the Nanovea HS2000 platform equipped with a high-speed Line Sensor is an ideal tool for analyzing and comparing the surface finish of honeycomb panel samples in a fast and accurate manner. The high-resolution profilometry scans paired with an advanced analysis software allow for a comprehensive and quantitative evaluation of the surface finish of honeycomb panel samples.
The data shown here represents only a small portion of the calculations available in the analysis software. Nanovea Profilometers measure virtually any surface for a wide range of applications in the Semiconductor, Microelectronic, Solar, Fiber Optics, Automotive, Aerospace, Metallurgy, Machining, Coatings, Pharmaceutical, Biomedical, Environmental and many other industries.

Surface Roughness and Features of a Solar Cell
Importance of Solar Panel Testing
Maximizing a solar cell’s energy absorption is key for the technology’s survival as a renewable resource. The multiple layers of coating and glass protection allow for the absorption, transmittance, and reflection of light that is necessary for the photovoltaic cells to function. Given that most consumer solar cells operate at 15-18% efficiency, optimizing their energy output is an ongoing battle.
Studies have shown that surface roughness plays a pivotal role in the reflectance of light. The initial layer of glass must be as smooth as possible to mitigate the reflectance of light, but the subsequent layers do not follow this guideline. A degree of roughness is necessary at each coatings interface to another to increase the possibility of light scattering within their respective depletion zones and increase the absorption of light within the cell1. Optimizing the surface roughness in these regions allows the solar cell to operate to the best of its ability and with the Nanovea HS2000 High Speed Sensor, measuring surface roughness can be done quickly and accurately.
Measurement Objective
In this study we will display the capabilities of the Nanovea Profilometer HS2000 with High Speed Sensor by measuring the surface roughness and geometric features of a photovoltaic cell. For this demonstration a monocrystalline solar cell with no glass protection will be measured but the methodology can be used for various other applications.
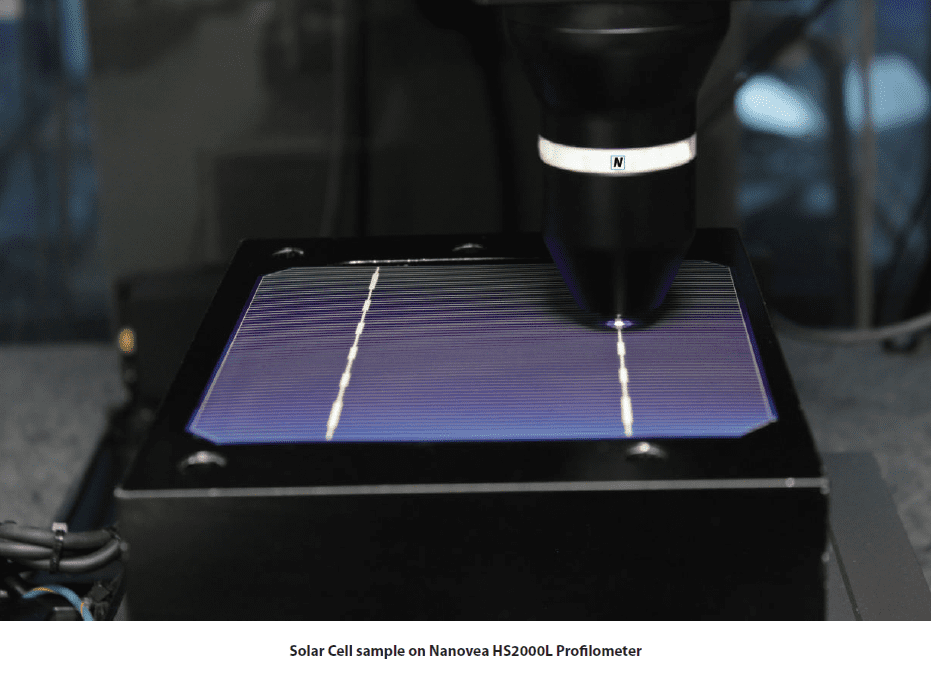
Test Procedure and Procedures
The following test parameters were used to measure the surface of the solar cell.
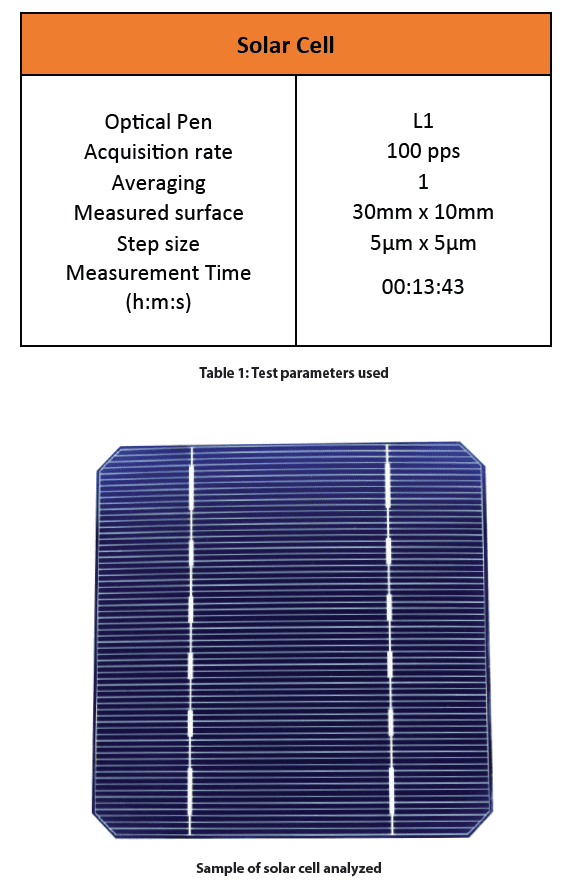
Results and Discussion
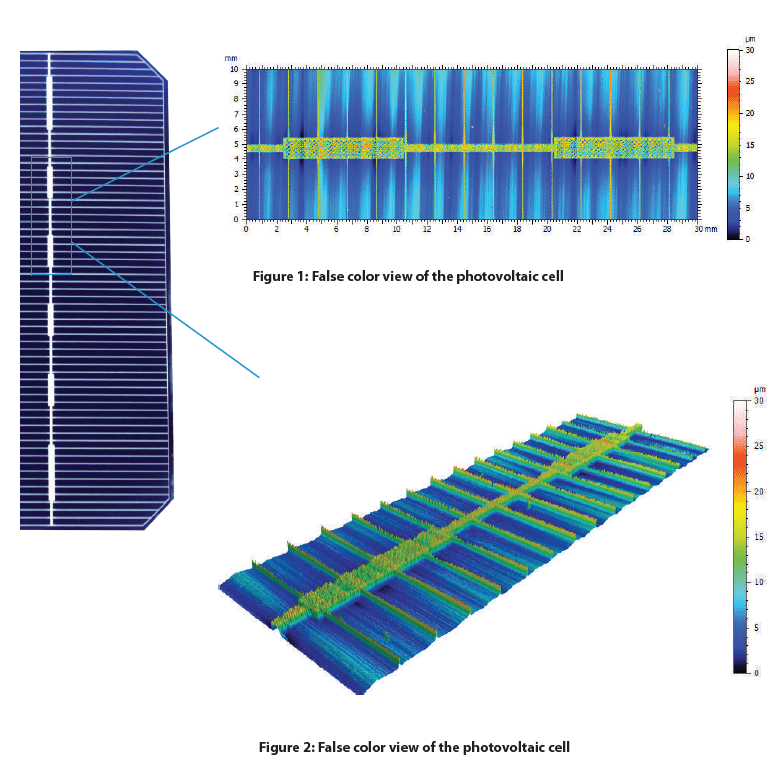
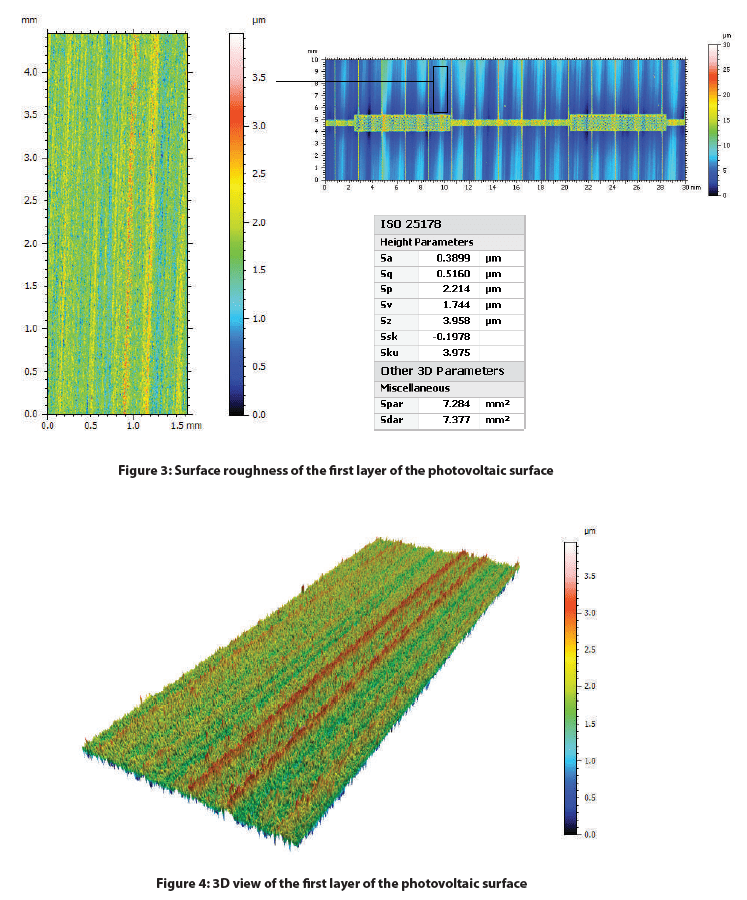
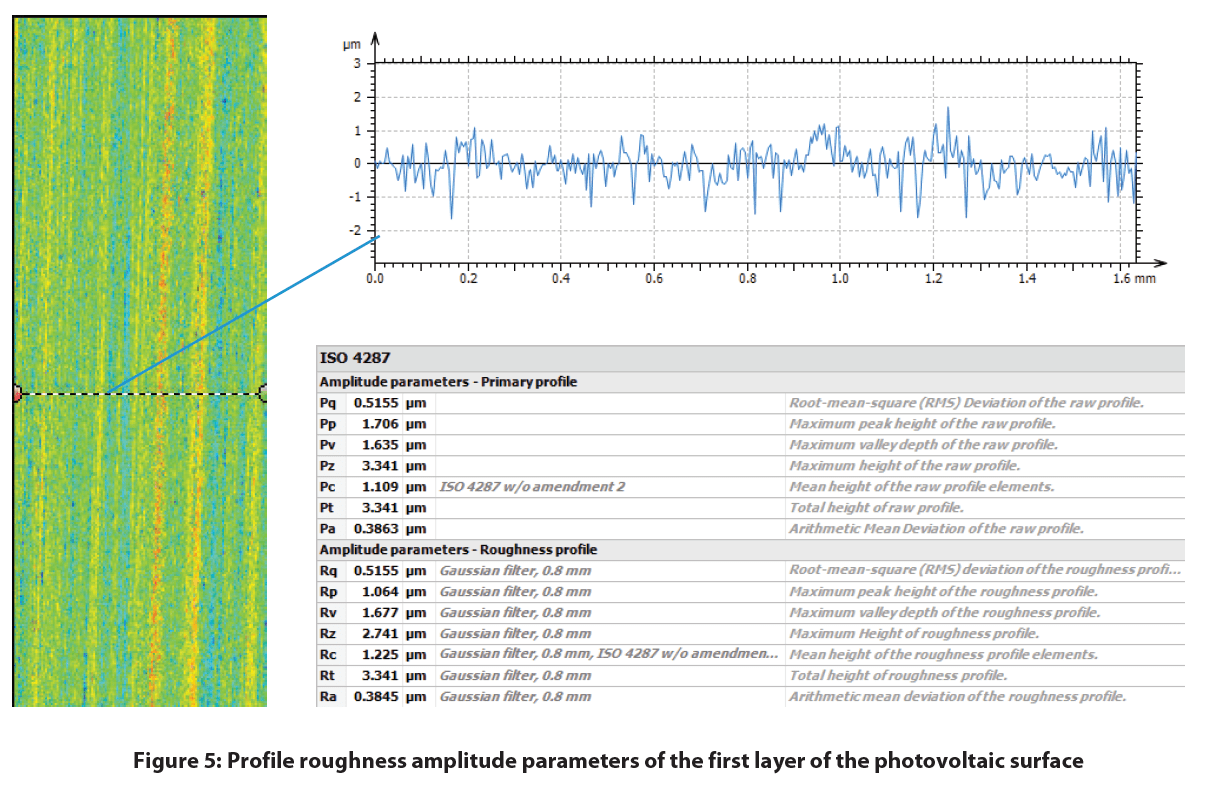
Depicted below is the 2D false-color view of the solar cell and an area extraction of the surface with its respective height parameters. A Gaussian filter was applied to both surfaces and a more aggressive index was used to flatten the extracted area. This excludes form (or waviness) larger than the cut-off index, leaving behind features that represent the solar cell’s roughness.
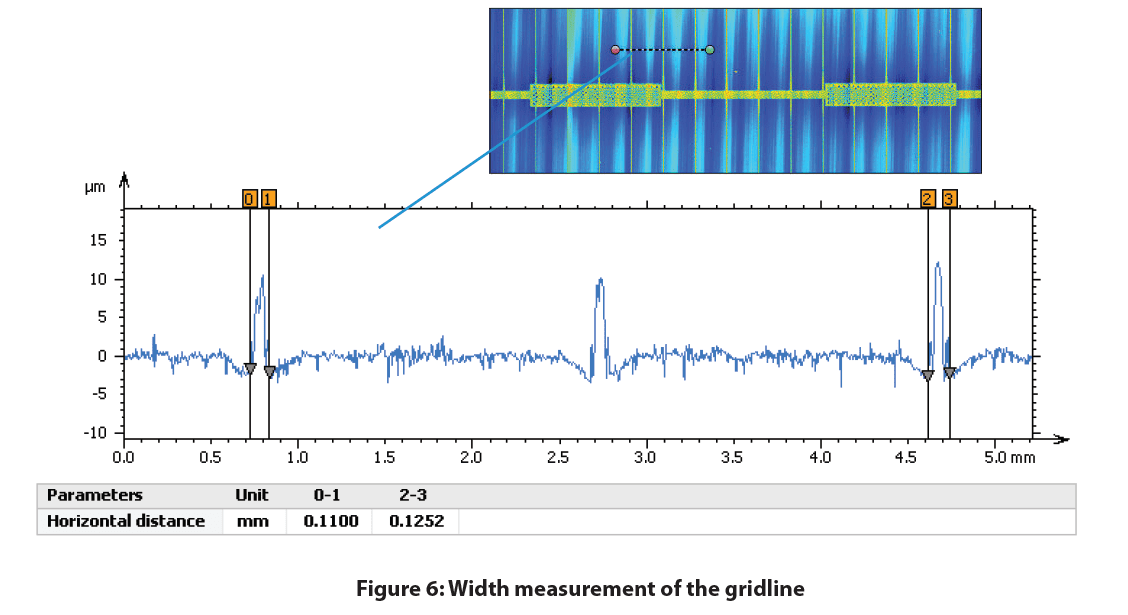
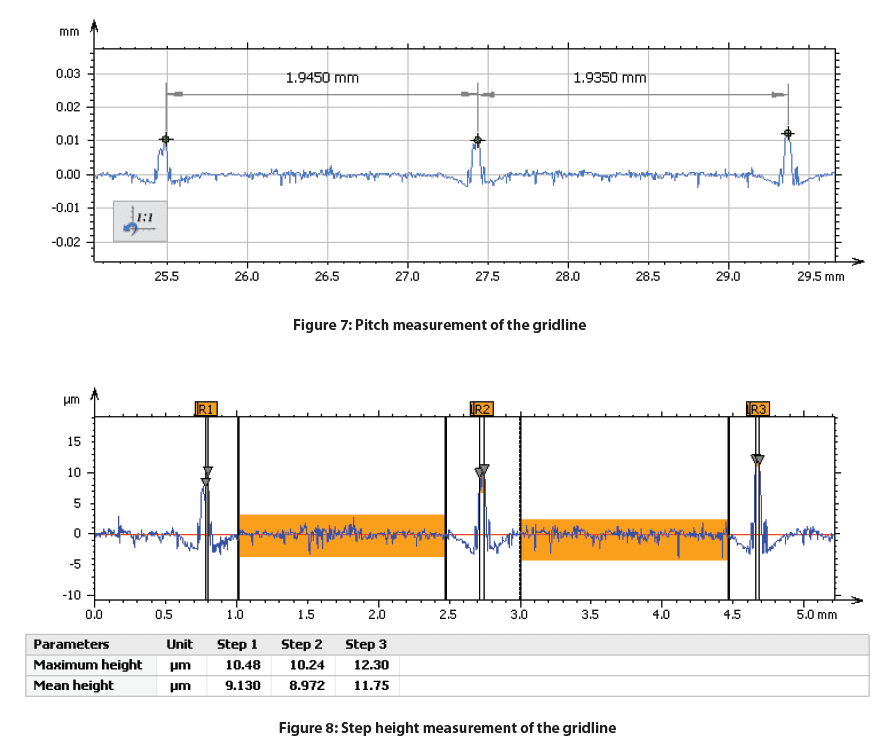
A profile was taken perpendicular to the orientation of the gridlines to measure their geometric characteristics which is shown below. The gridline width, step height, and pitch can be measured for any specific location on the solar cell.
Conclusion

In this study we were able to display the Nanovea HS2000 Line Sensor’s ability to measure a monocrystalline photovoltaic cell’s surface roughness and features. With the ability to automate accurate measurements of multiple samples and set pass fail limits, the Nanovea HS2000 Line Sensor is a perfect choice for quality control inspections.
Reference
1 Scholtz, Lubomir. Ladanyi, Libor. Mullerova, Jarmila. “Influence of Surface Roughness on Optical Characteristics of Multilayer Solar Cells “ Advances in Electrical and Electronic Engineering, vol. 12, no. 6, 2014, pp. 631-638.

Surface Finish Inspection of Wood Flooring
Importance of Profiling Wood Finishes
In various industries, the purpose of a wood finish is to protect the wooden surface from various types of damage such as chemical, mechanical or biological and/or provide a specific visual aesthetic. For manufacturers and buyers alike, quantifying surface characteristics of their wood finishes can be vital to the quality control or optimization of finishing processes for wood. In this application, we will explore the various surface features that can be quantified using a Nanovea 3D Non-Contact Profilometer.
Quantifying the amount of roughness and texture that exists on a wooden surface can be essential to know in order to ensure it can meet the requirements of its application. Refining the finishing process or checking the quality of wooden surfaces based on a quantifiable, repeatable and reliable surface inspection method would allow manufacturers to create controlled surface treatments and buyers the ability to inspect and select wood materials to meet their needs.
Measurement Objective
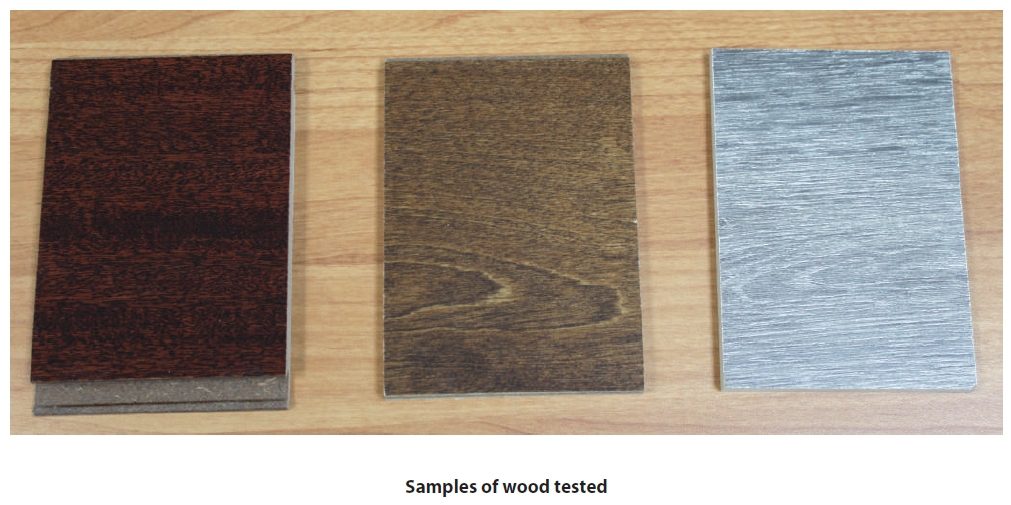
In this study, the high-speed Nanovea HS2000 profilometer equipped with a non-contact profiling line sensor was used to measure and compare the surface finish of three flooring samples: Antique Birch Hardwood, Courtship Grey Oak, and Santos Mahogany flooring. We showcase the capability of the Nanovea Non-Con-tact Profilometer in delivering both speed and precision when measuring three types of surface areas and a comprehensive in-depth analysis of the scans.
Test Procedure and Procedures
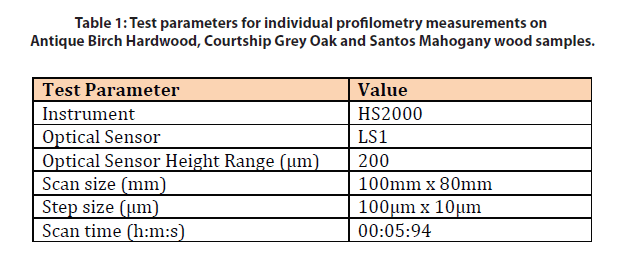
Results and Discussion
Sample description: Courtship Grey Oak and Santos Mahogany flooring are laminate flooring types. Courtship Grey Oak is a low gloss, textured slate gray sample with an EIR finish. Santos Mahogany is a high gloss, dark burgundy sample that was prefinished. Antique Birch Hardwood has a 7-layer aluminum oxide finish, providing everyday wear and tear protection.
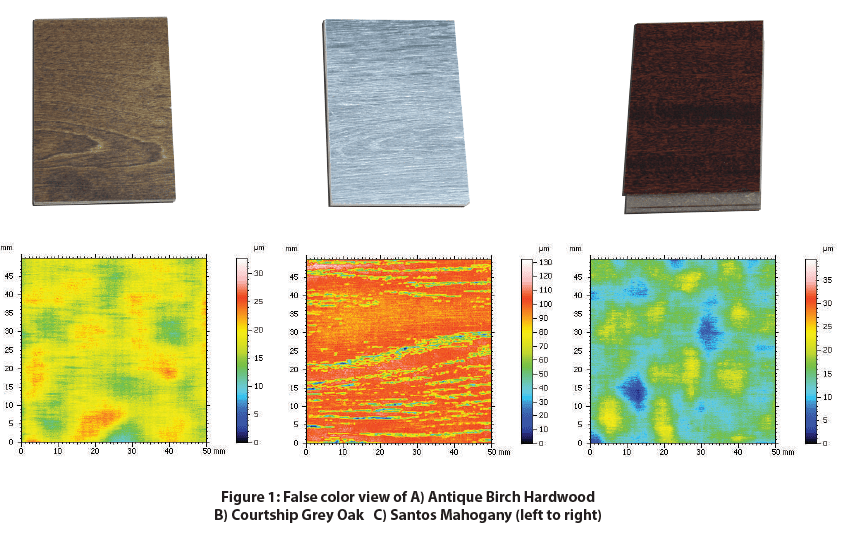
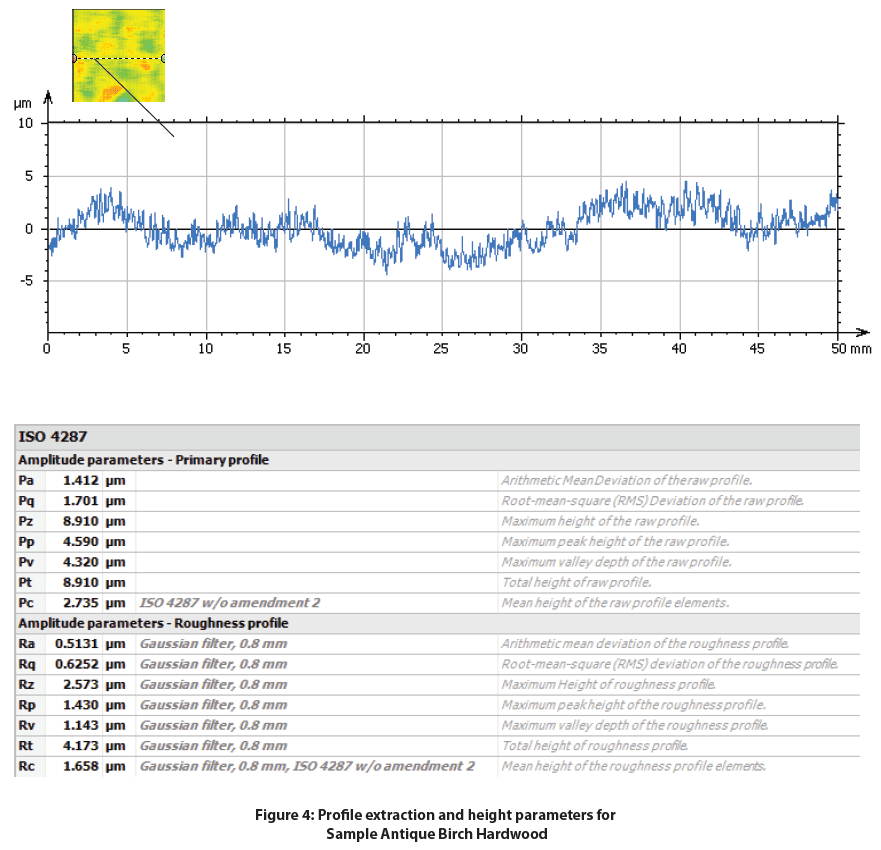
Antique Birch Hardwood
Courtship Grey Oak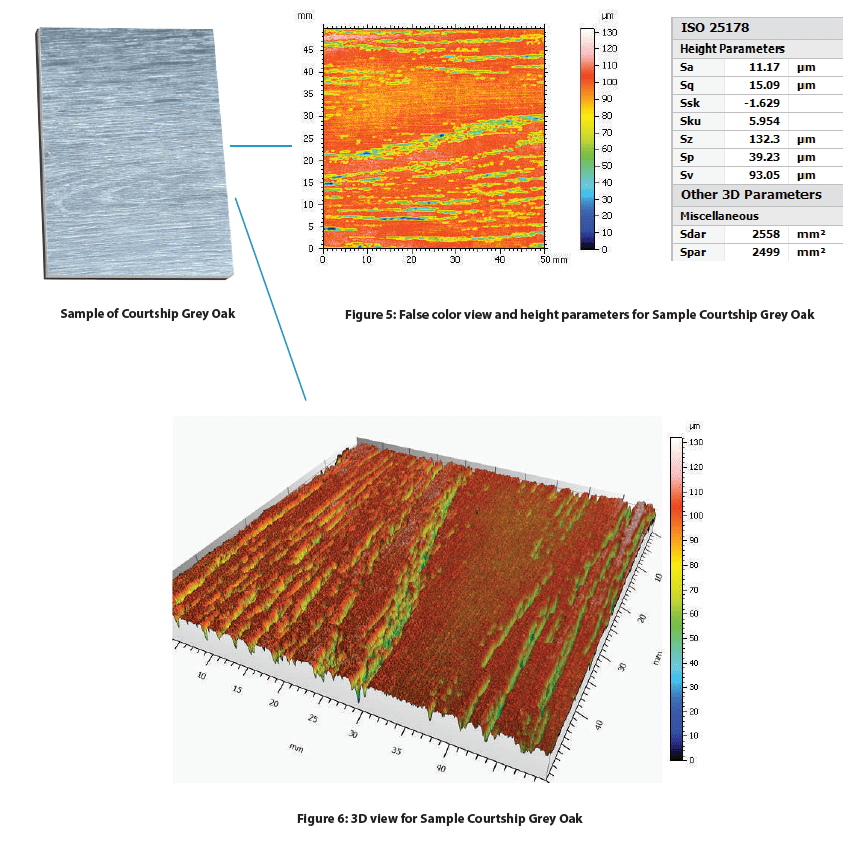
Santos Mahogany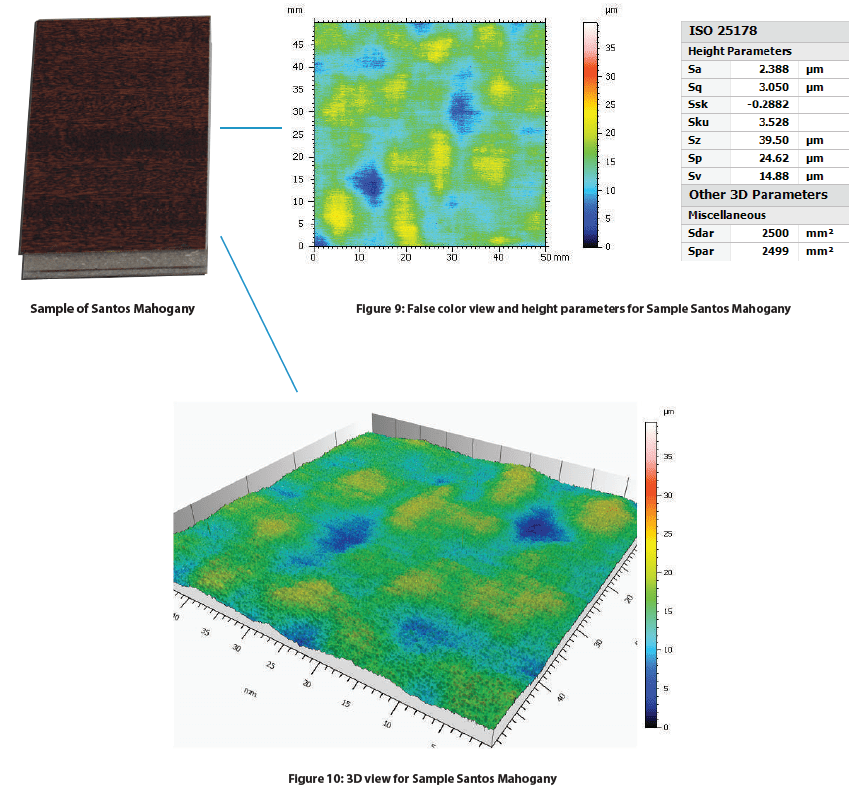

Discussion
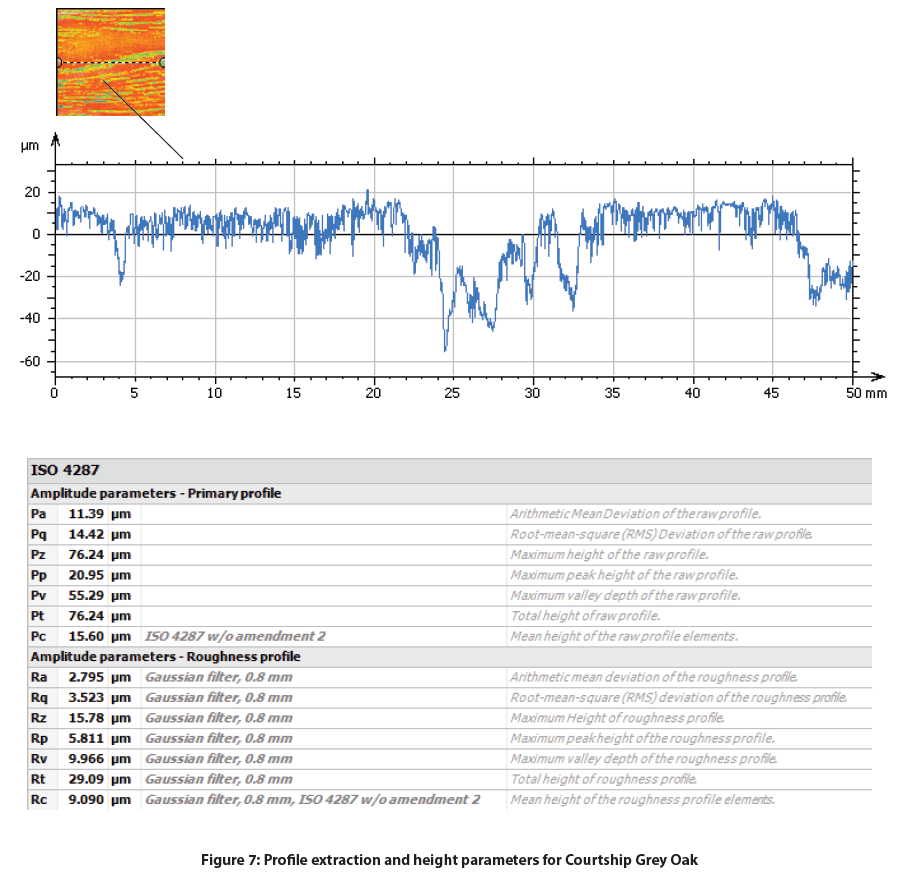
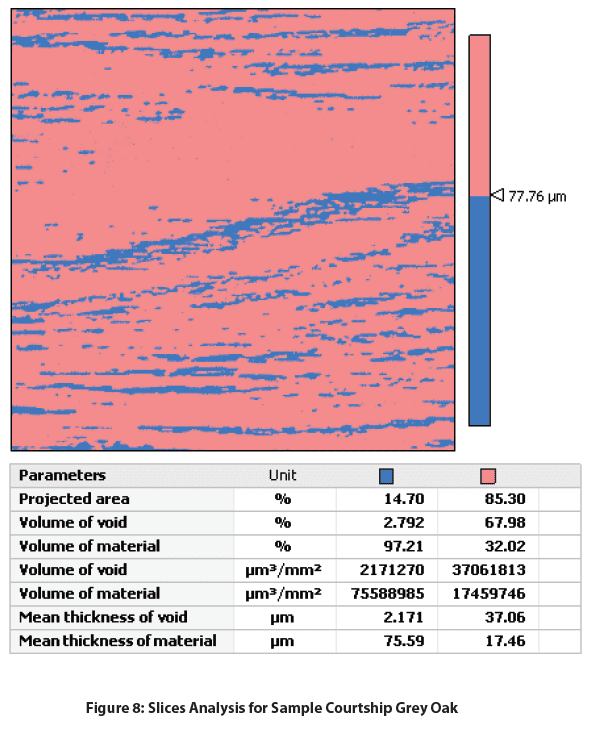
There is a clear distinction between all the samples’ Sa value. The smoothest was Antique Birch Hardwood with a Sa of 1.716 µm, followed by Santos Mahogany with a Sa of 2.388 µm, and significantly increasing for Courtship Grey Oak with a Sa of 11.17 µm. P-values and R-values are also common roughness values that can be used to assess the roughness of specific profiles along the surface. The Courtship Grey Oak possess-es a coarse texture full of crack-like features along the wood’s cellular and fiber direction. Additional analysis was done on the Courtship Grey Oak sample because of its textured surface. On the Courtship Grey Oak sample, slices were used to separate and calculate the depth and volume of the cracks from the flatter uniform surface.
Conclusion

In this application, we have shown how the Nanovea HS2000 high-speed profilometer can be used to inspect the surface finish of wood samples effectively and efficiently. Surface finish measurements can prove to be important to both manufactures and consumers of hardwood flooring in understanding how they can improve a manufacturing process or choose the appropriate product that performs best for a specific application.
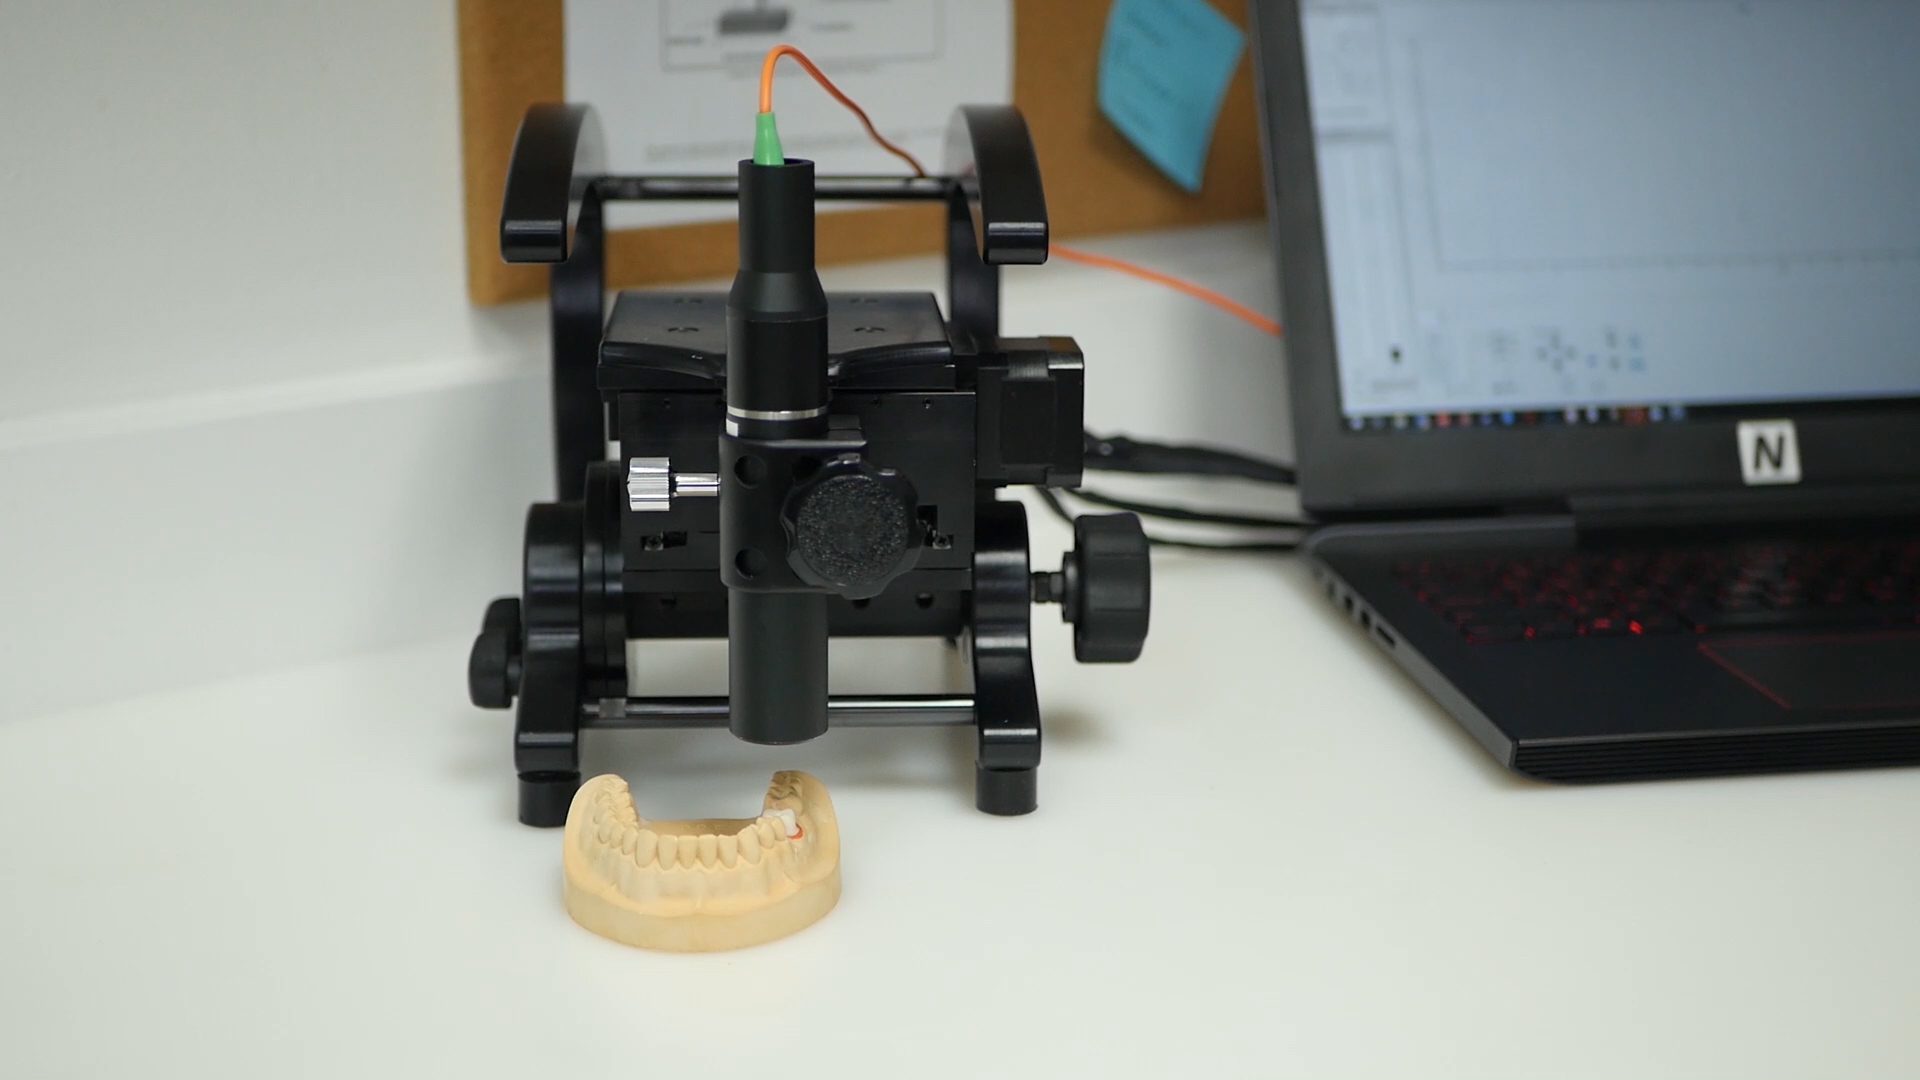
Portability and Flexibility of the Jr25 3D Non-contact Profilometer
Understanding and quantifying a sample’s surface is crucial for many applications including quality control and research. To study surfaces, profilometers are often used to scan and image samples. A large problem with conventional profilometry instruments is the inability to accommodate for non conventional samples. Difficulties in measuring non conventional samples can occur due to sample size, geometry, inability to move the sample, or other inconvenient sample preparations. Nanovea’s portable 3D non-contact profilometers, the JR series, is able to solve most of these problems with its ability to scan sample surfaces from varying angles and its portability.
Read about the Jr25 Non-contact Profilometer!

Flatness Measurement of Screen Using Fast 3D Profilometry
Flatness measurement is an important geometric surface quality in the manufacture of precision parts and assemblies. Flatness of the surface plays a vital role in the end use of the product. For example, the parts that are connected in an air-tight or liquid-tight manner across a surface area require stringent surface conditions of superior flatness at the contact face. Flatness of the screen is critical to the functionality and aesthetics of electronic devices such as cellphones, pads and laptops. Any imperfection of the screen flatness can create negative user impression and experience of the product.
See Video Clip or Read Report: Flatness Measurement of Screen Using Fast 3D Profilometry
Humidity Effect On Paper Flatness
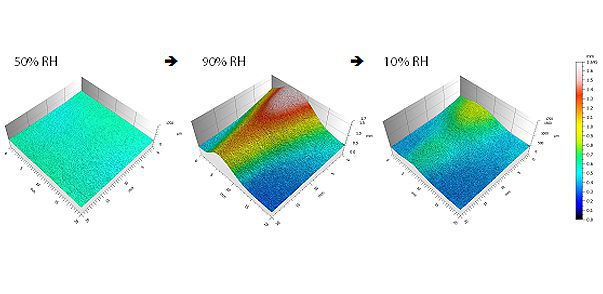
Paper flatness is critical to the proper performance of printing paper. It communicates functional characteristics and makes an impression of the paper quality. A better understanding of the effect of humidity on paper flatness, texture and consistency allows optimizing the processing and control measures to obtain the best product. Quantifiable, precise and reliable surface inspection of the paper in different humid environments is in need to simulate the use of paper in the realistic application. The Nanovea 3D Non-Contact Profilometers utilizes chromatic confocal technology with unique capability to precisely measure the paper surface. A humidity controller provides precise control of the humidity in a sealed chamber where the test sample is exposed to the moisture.
Flatness Measurement of Wafer Using 3D Profilometry
In this application the Nanovea ST400 Profilometer is used to measure the section of a wafer array. The area measured was selected at random, and assumed large enough in that it could be extrapolated to make assumptions about a much larger surface. Surface flatness measurement, planarity & other surface parameters are used to analyze the surface.