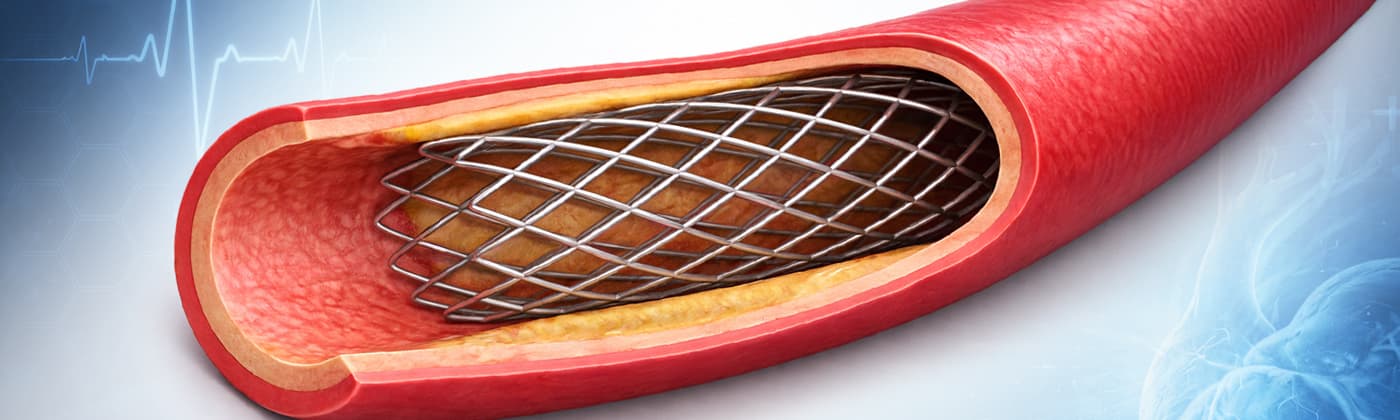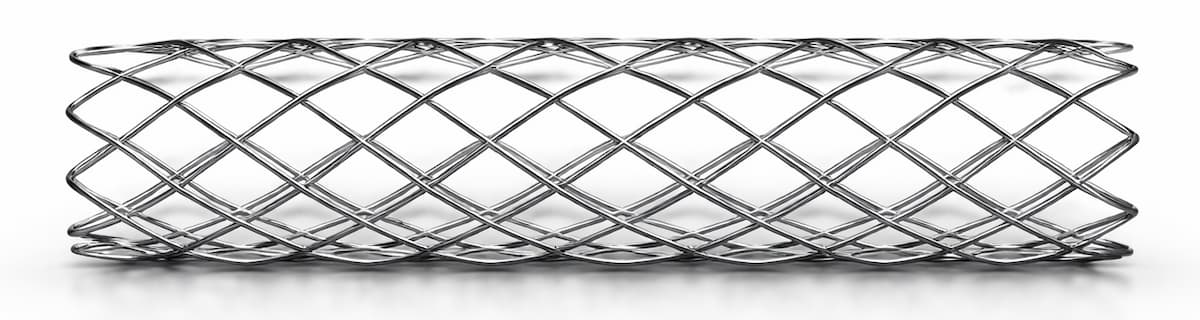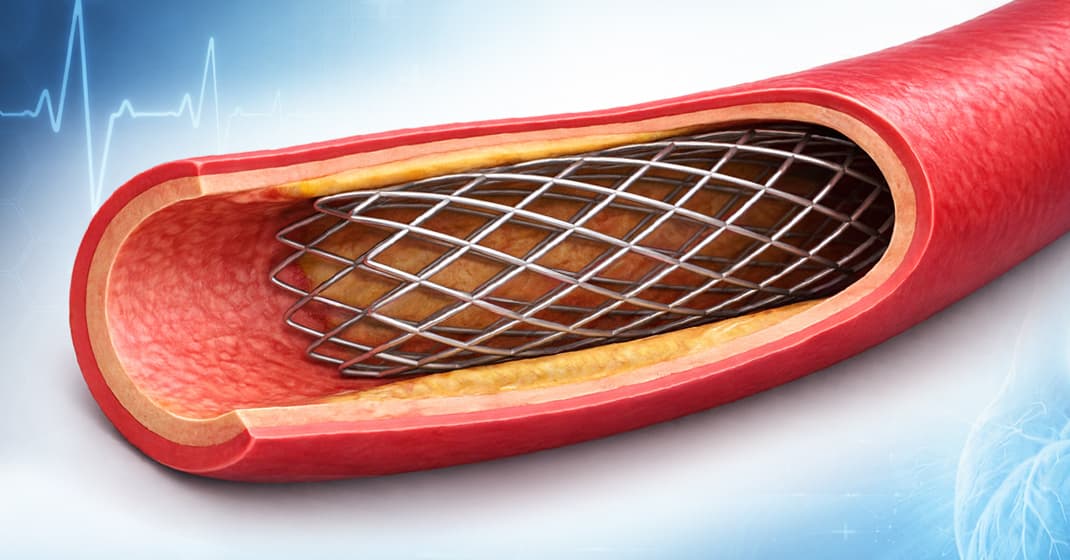
Stent Coating Adhesion and Delamination Analysis Using Nano Scratch Testing
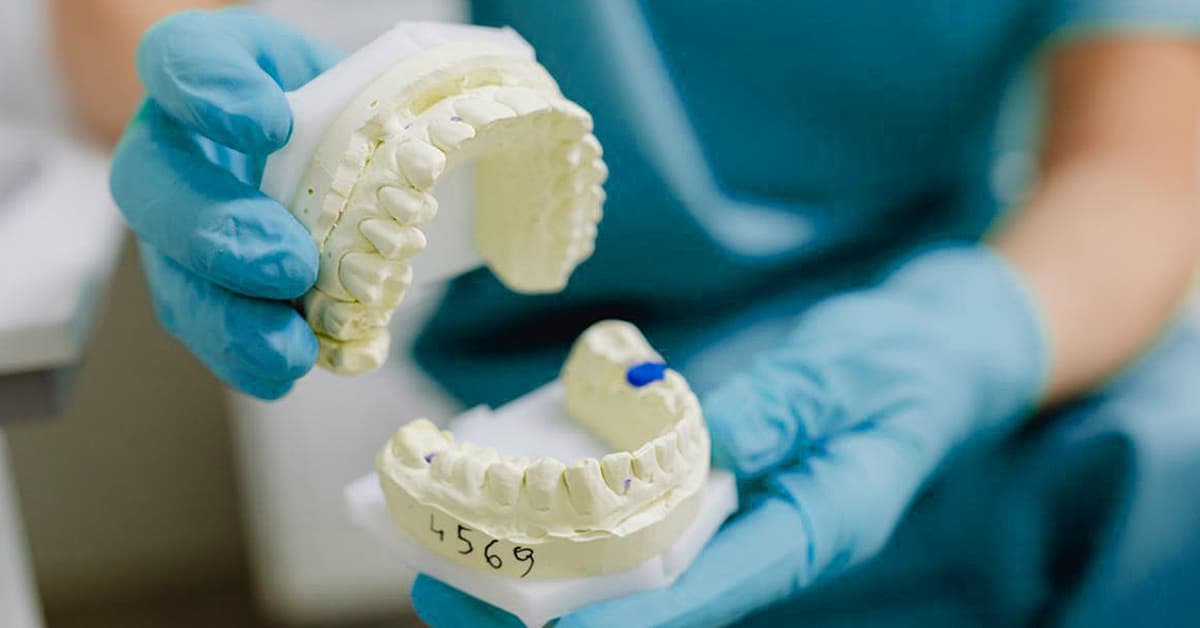
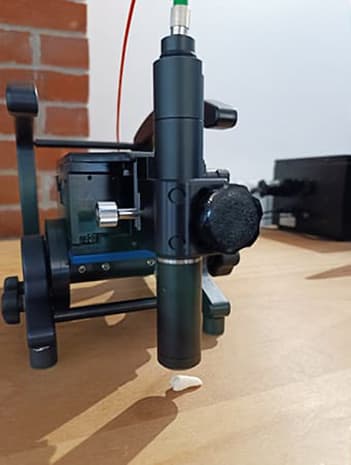
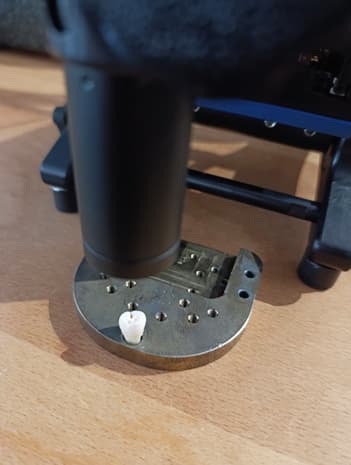
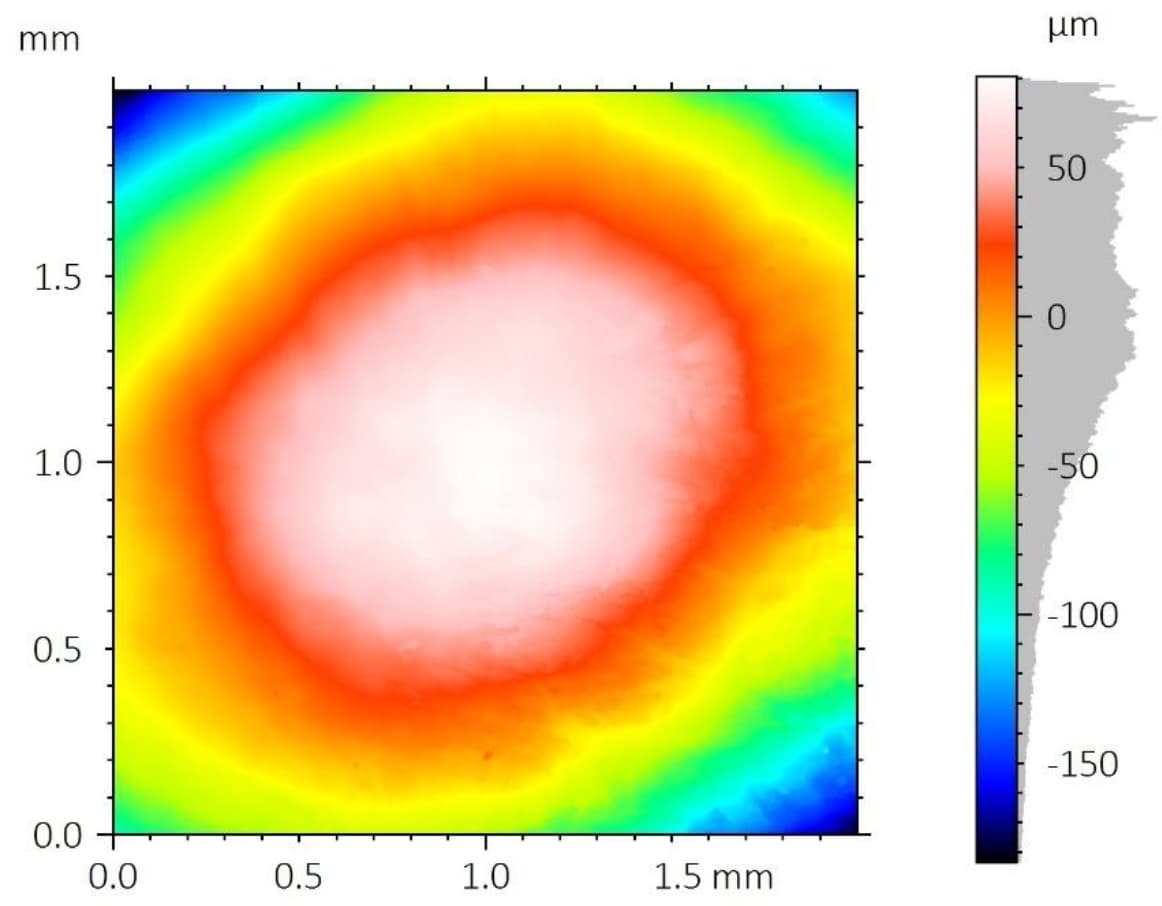
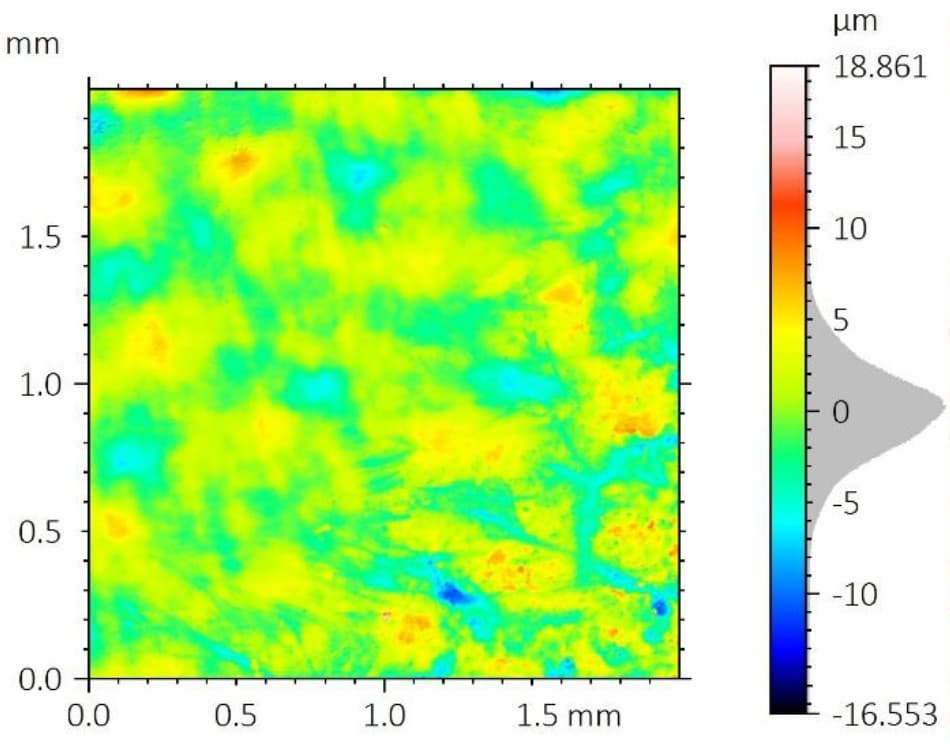
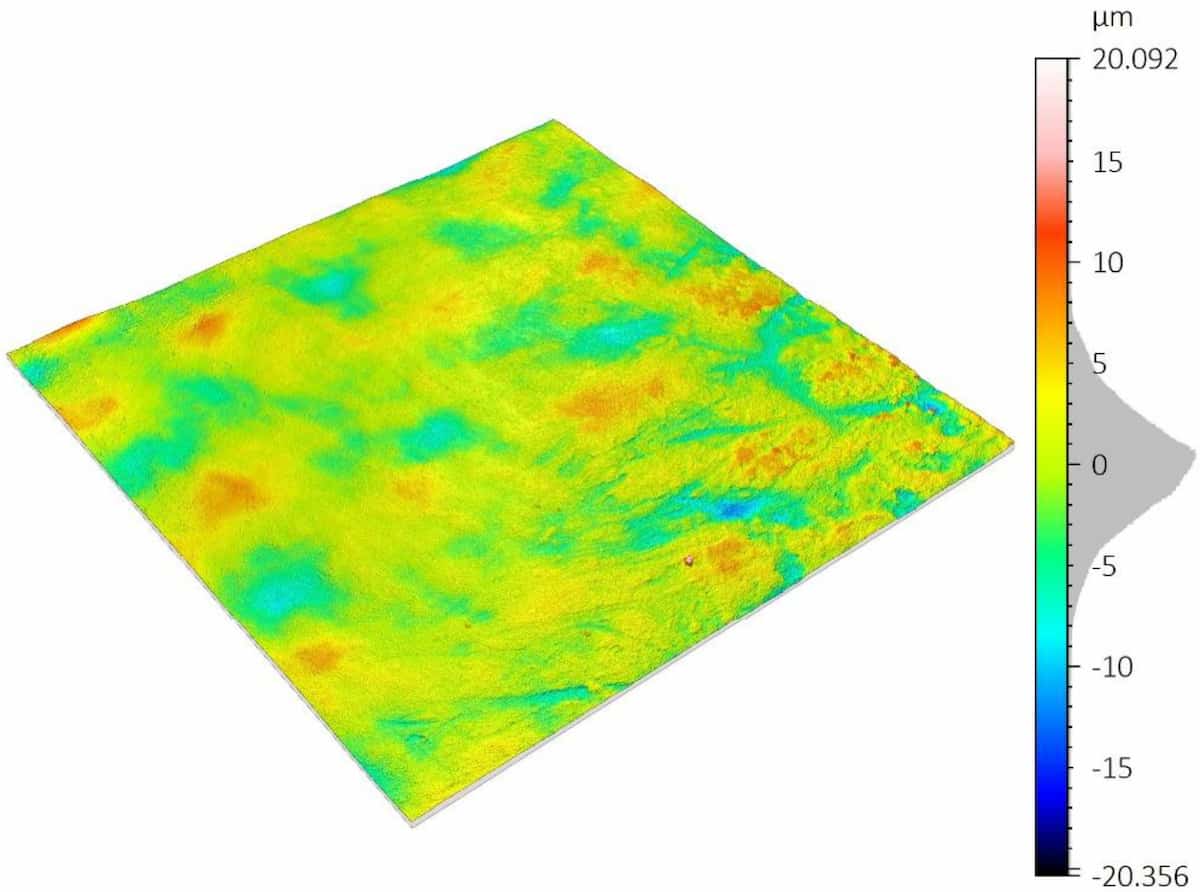
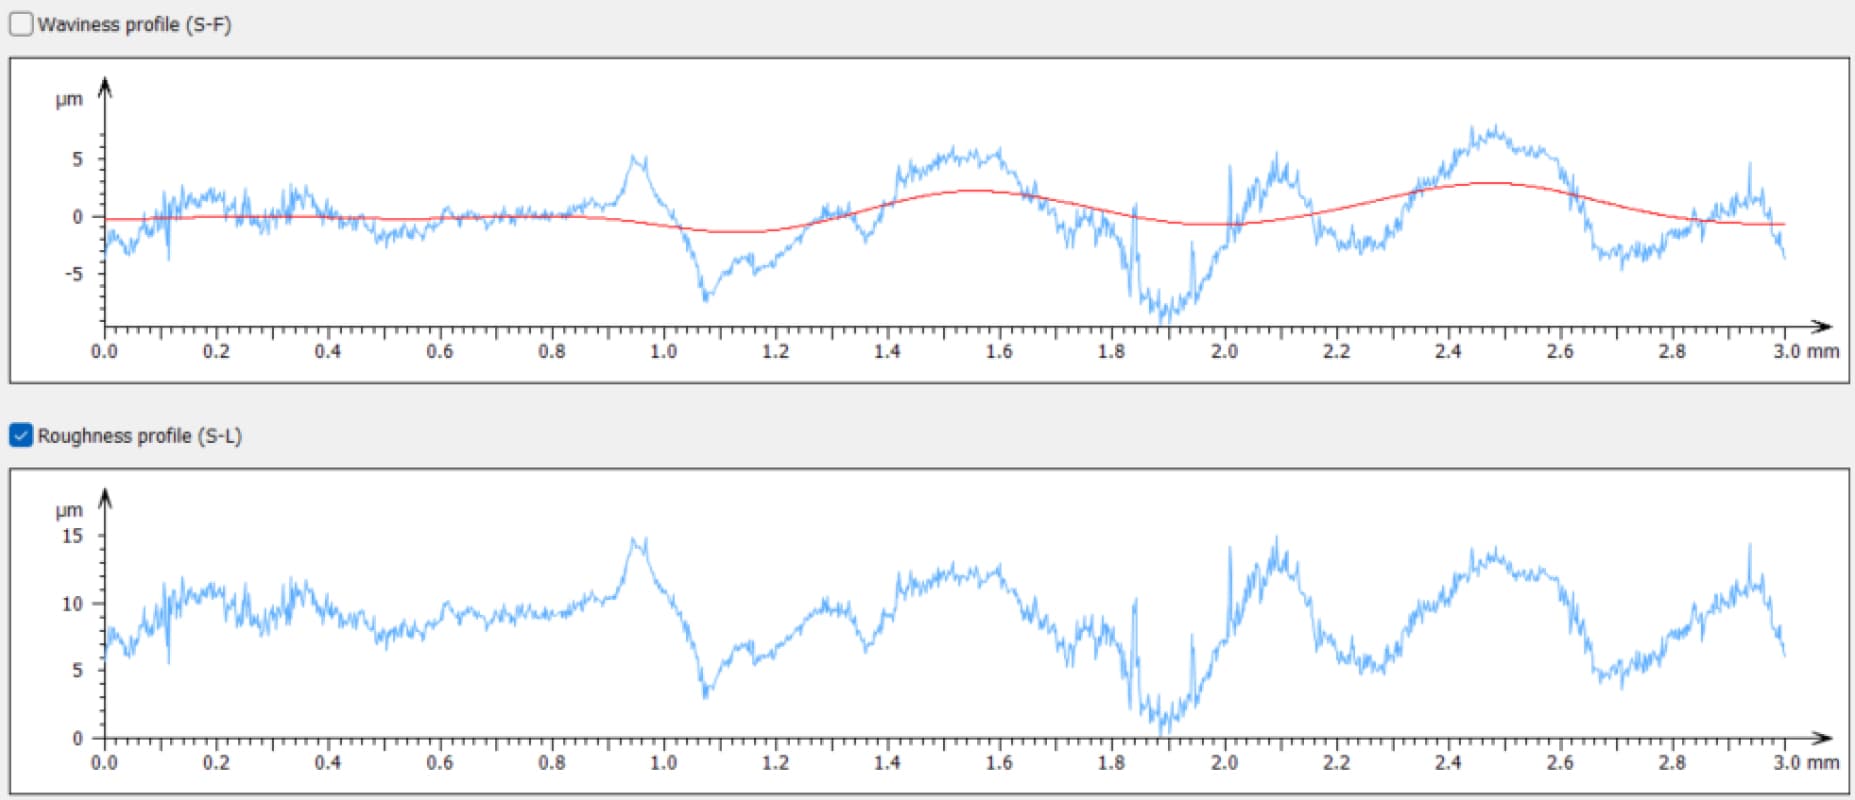
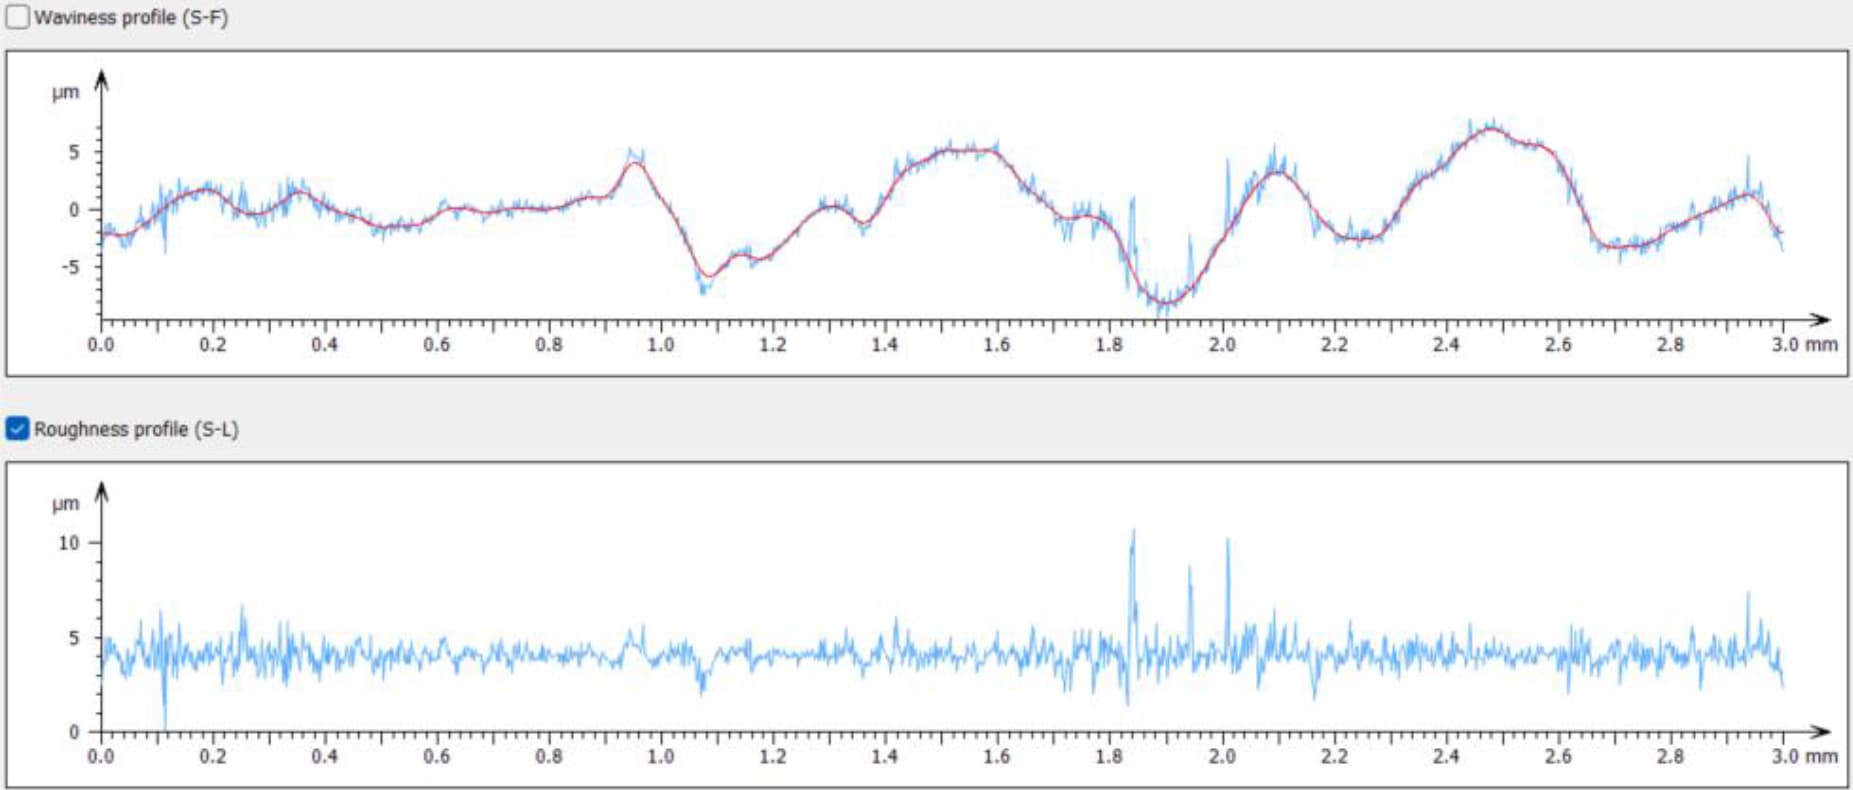
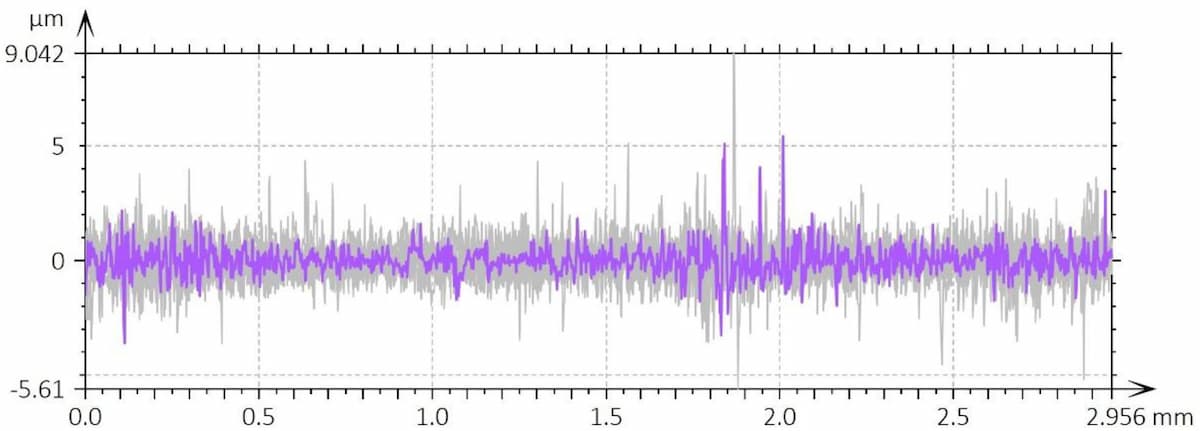
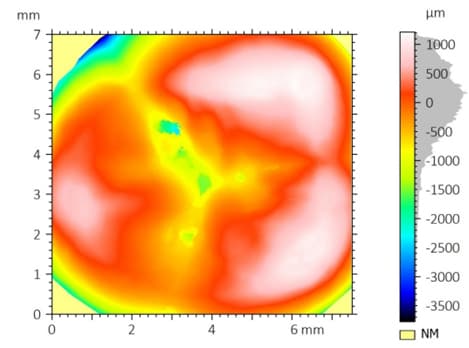
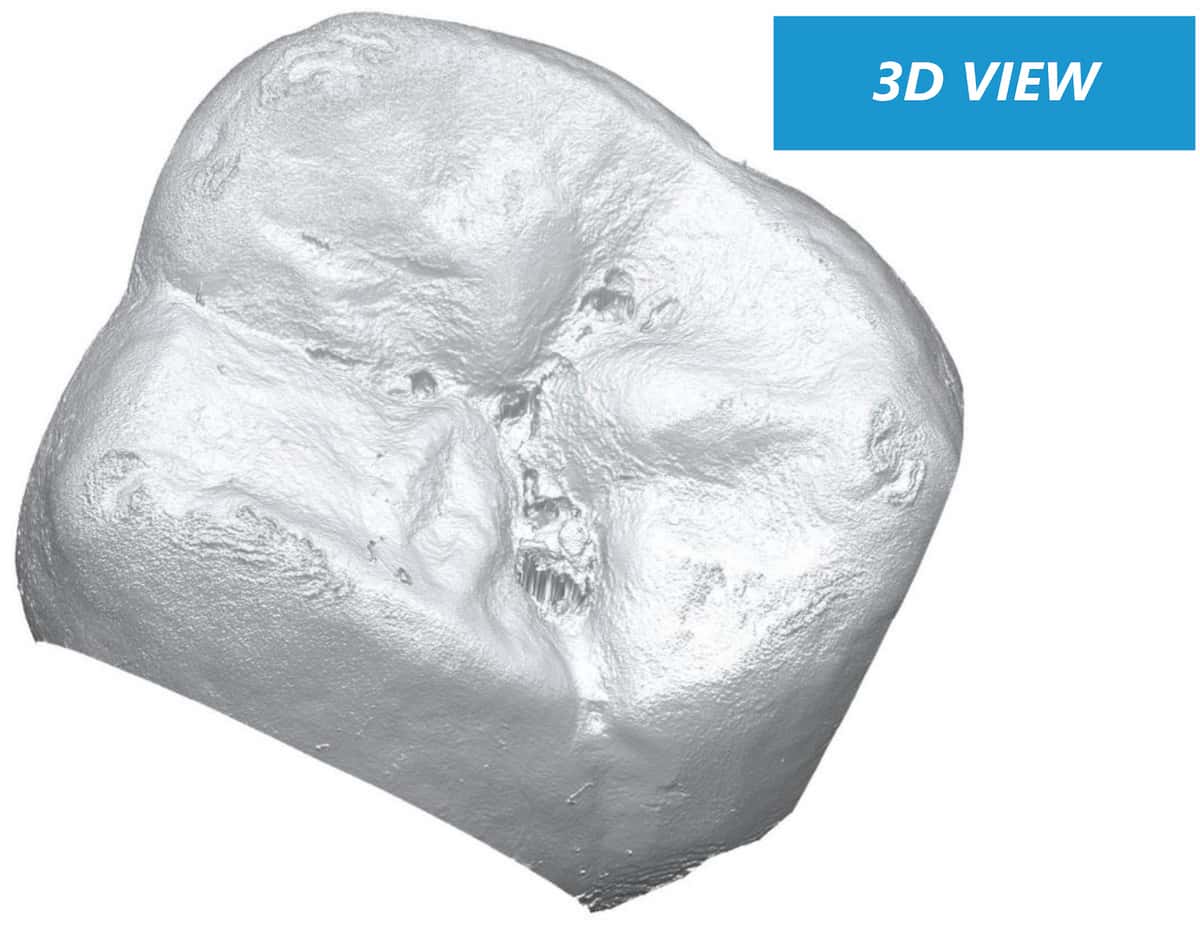
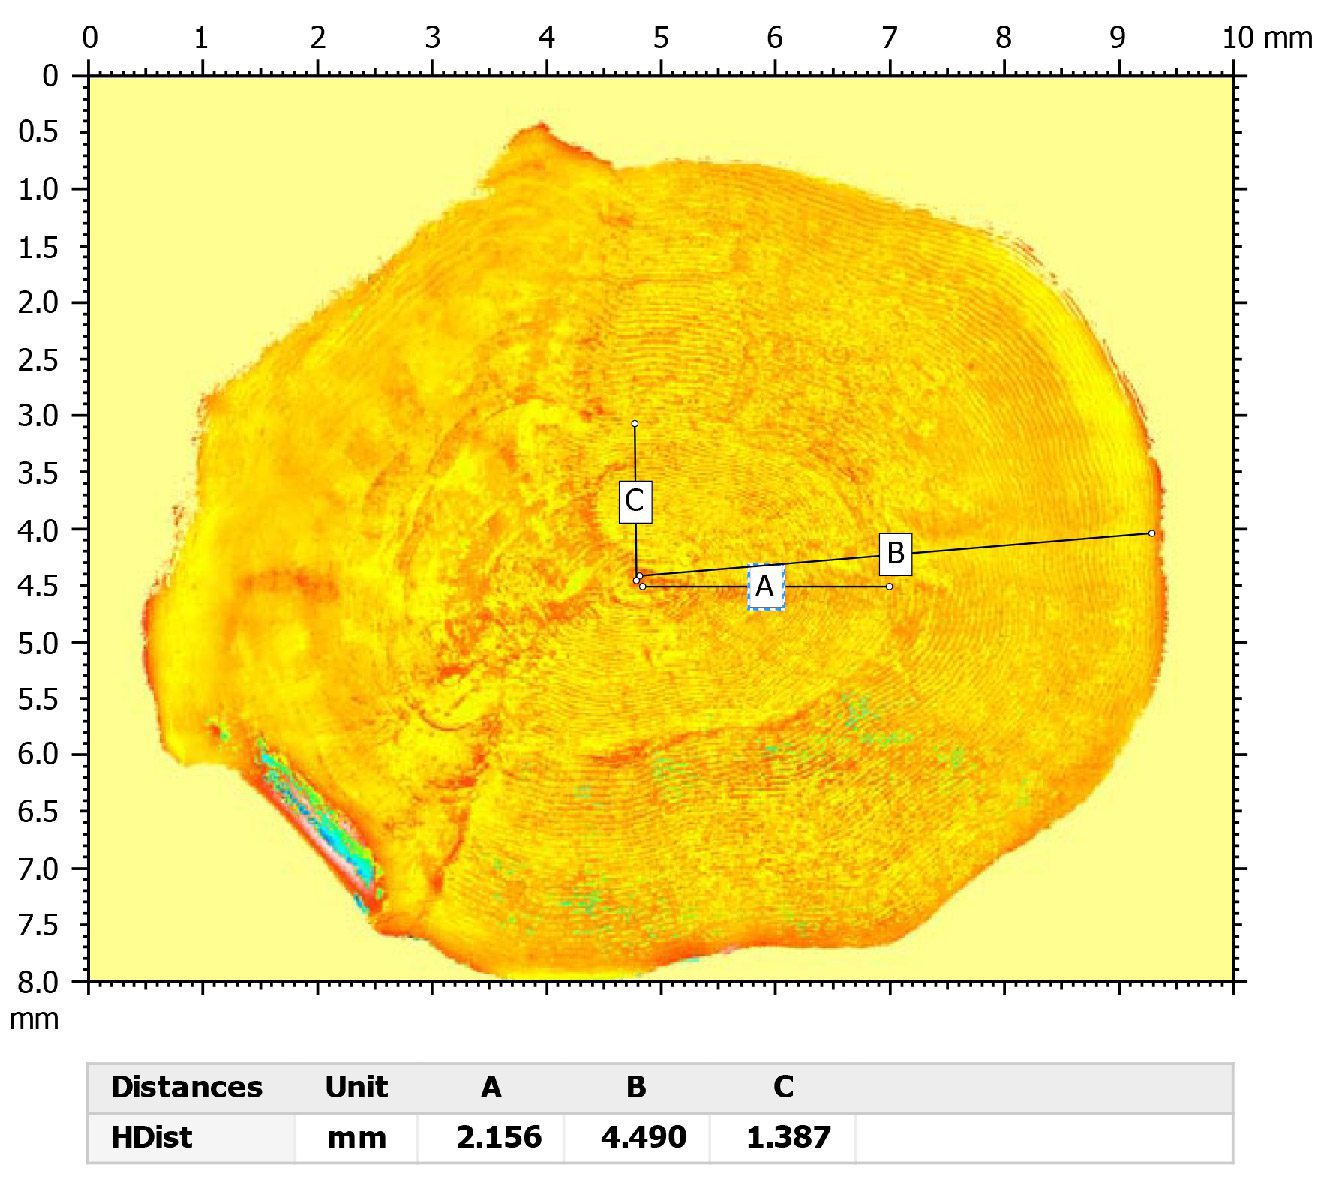
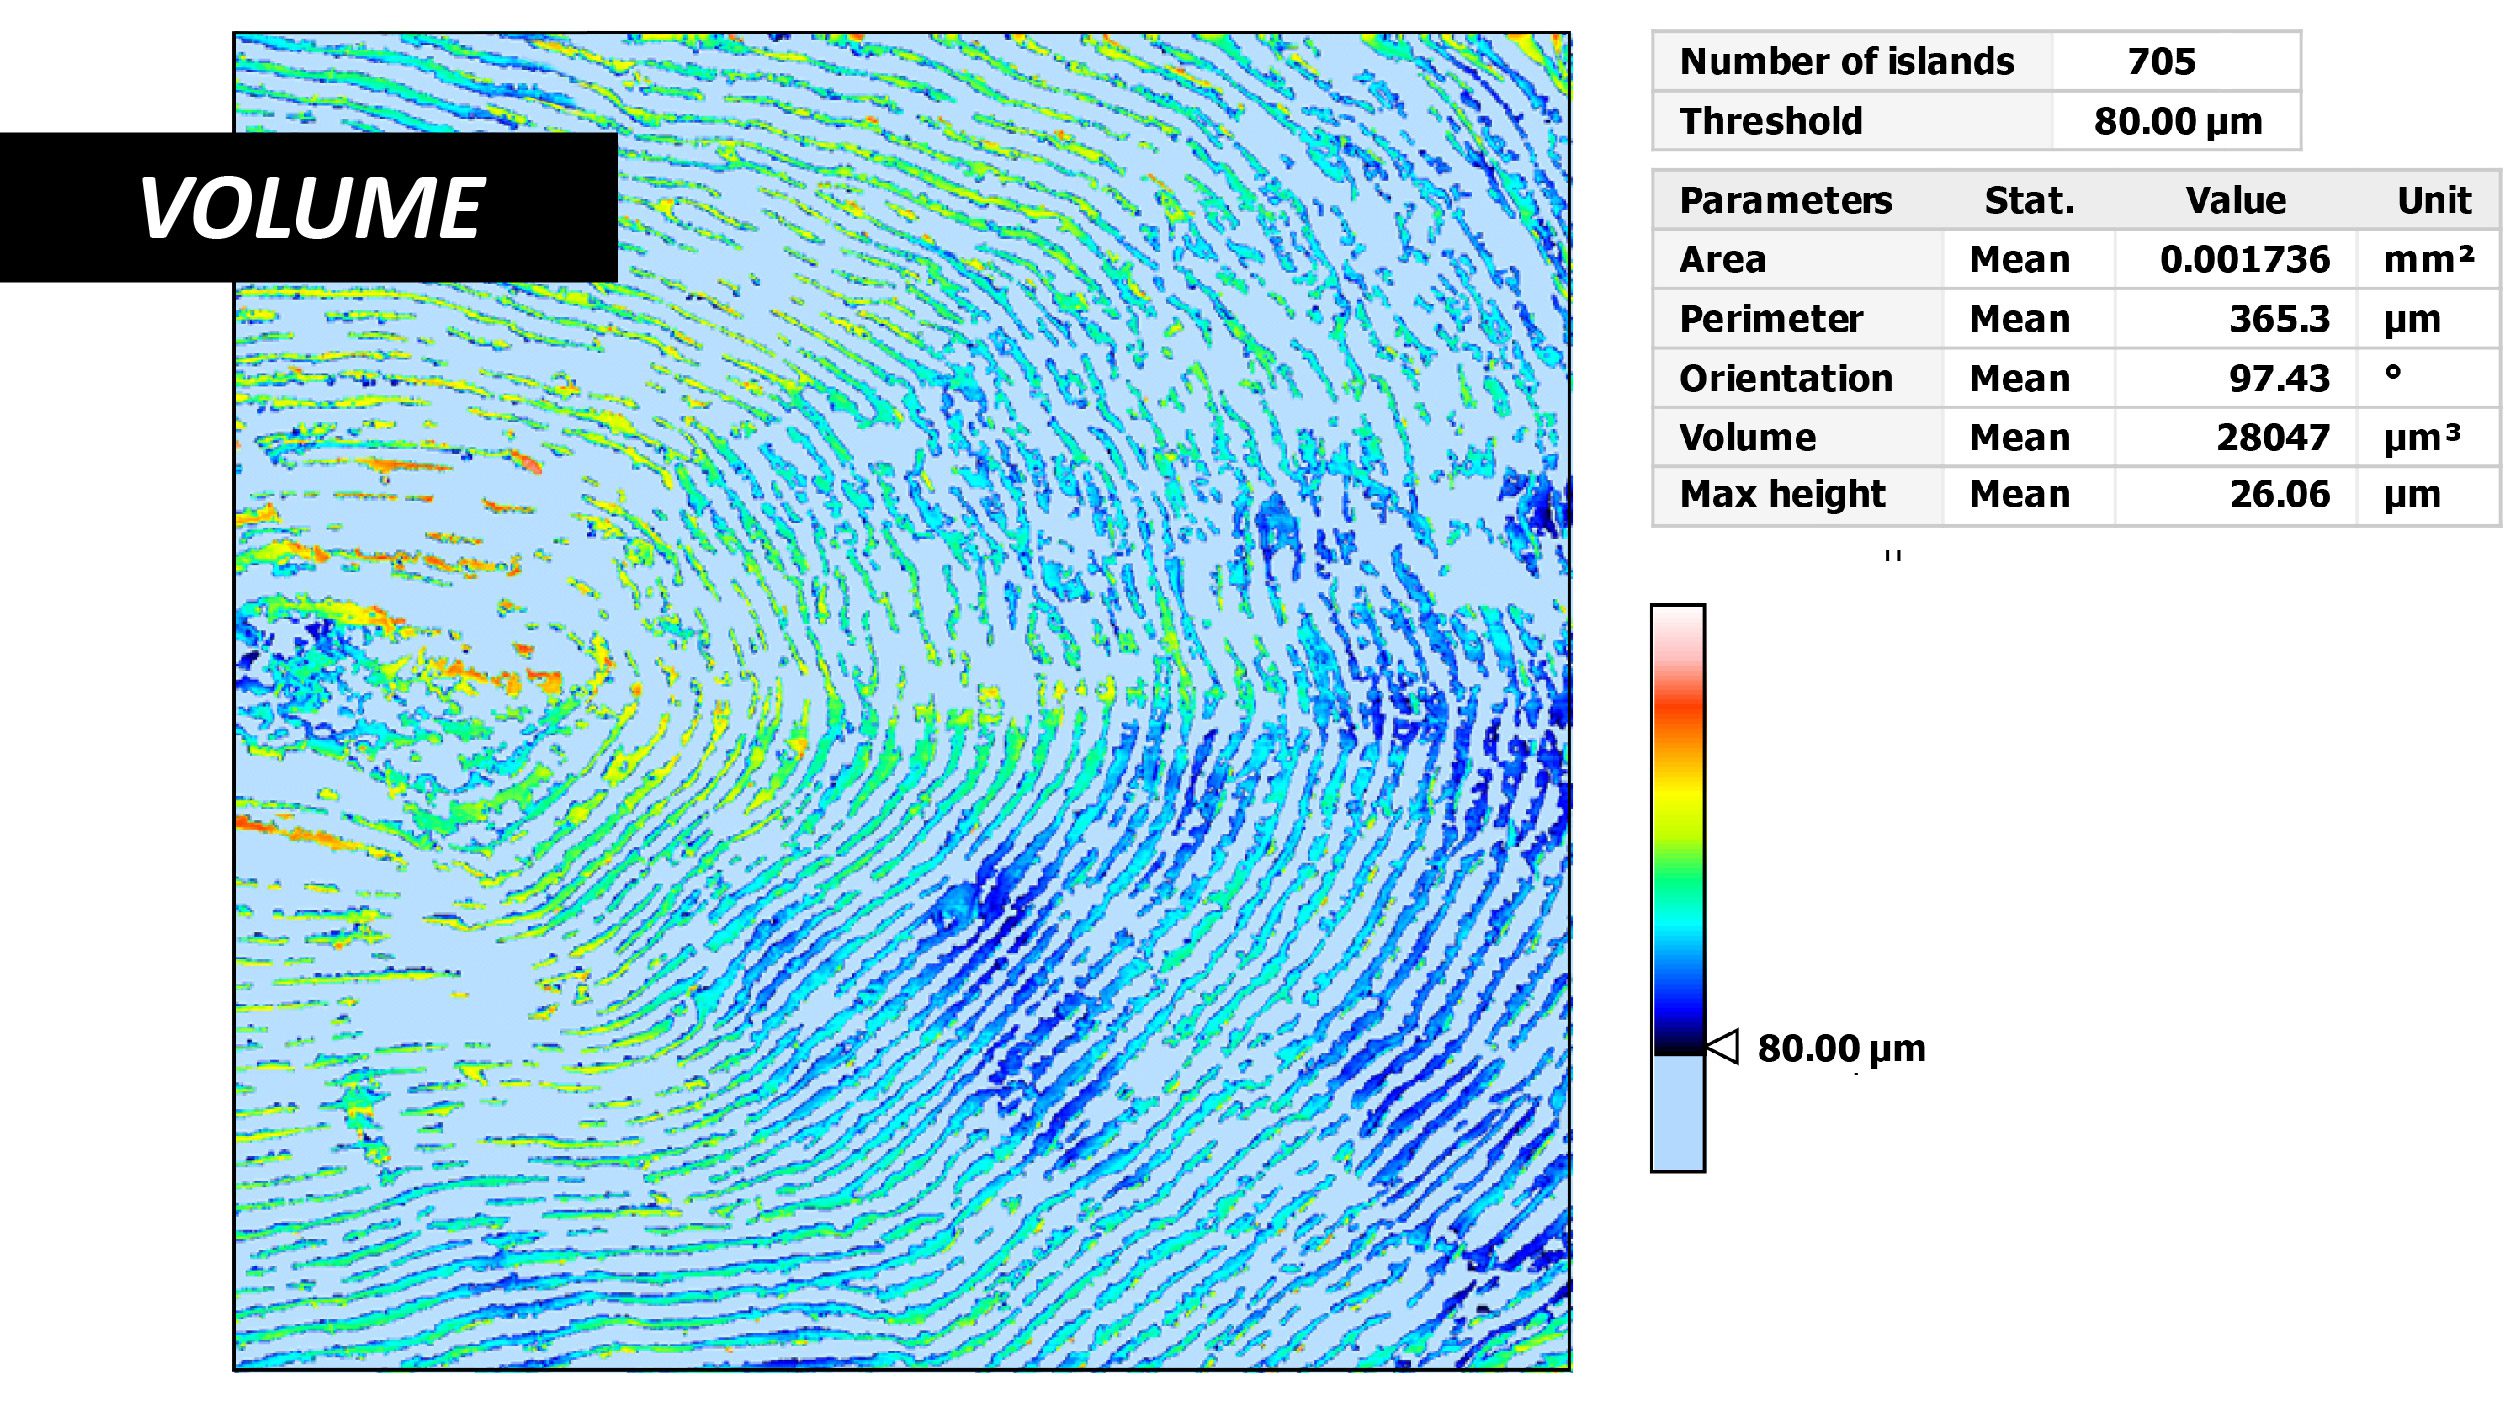
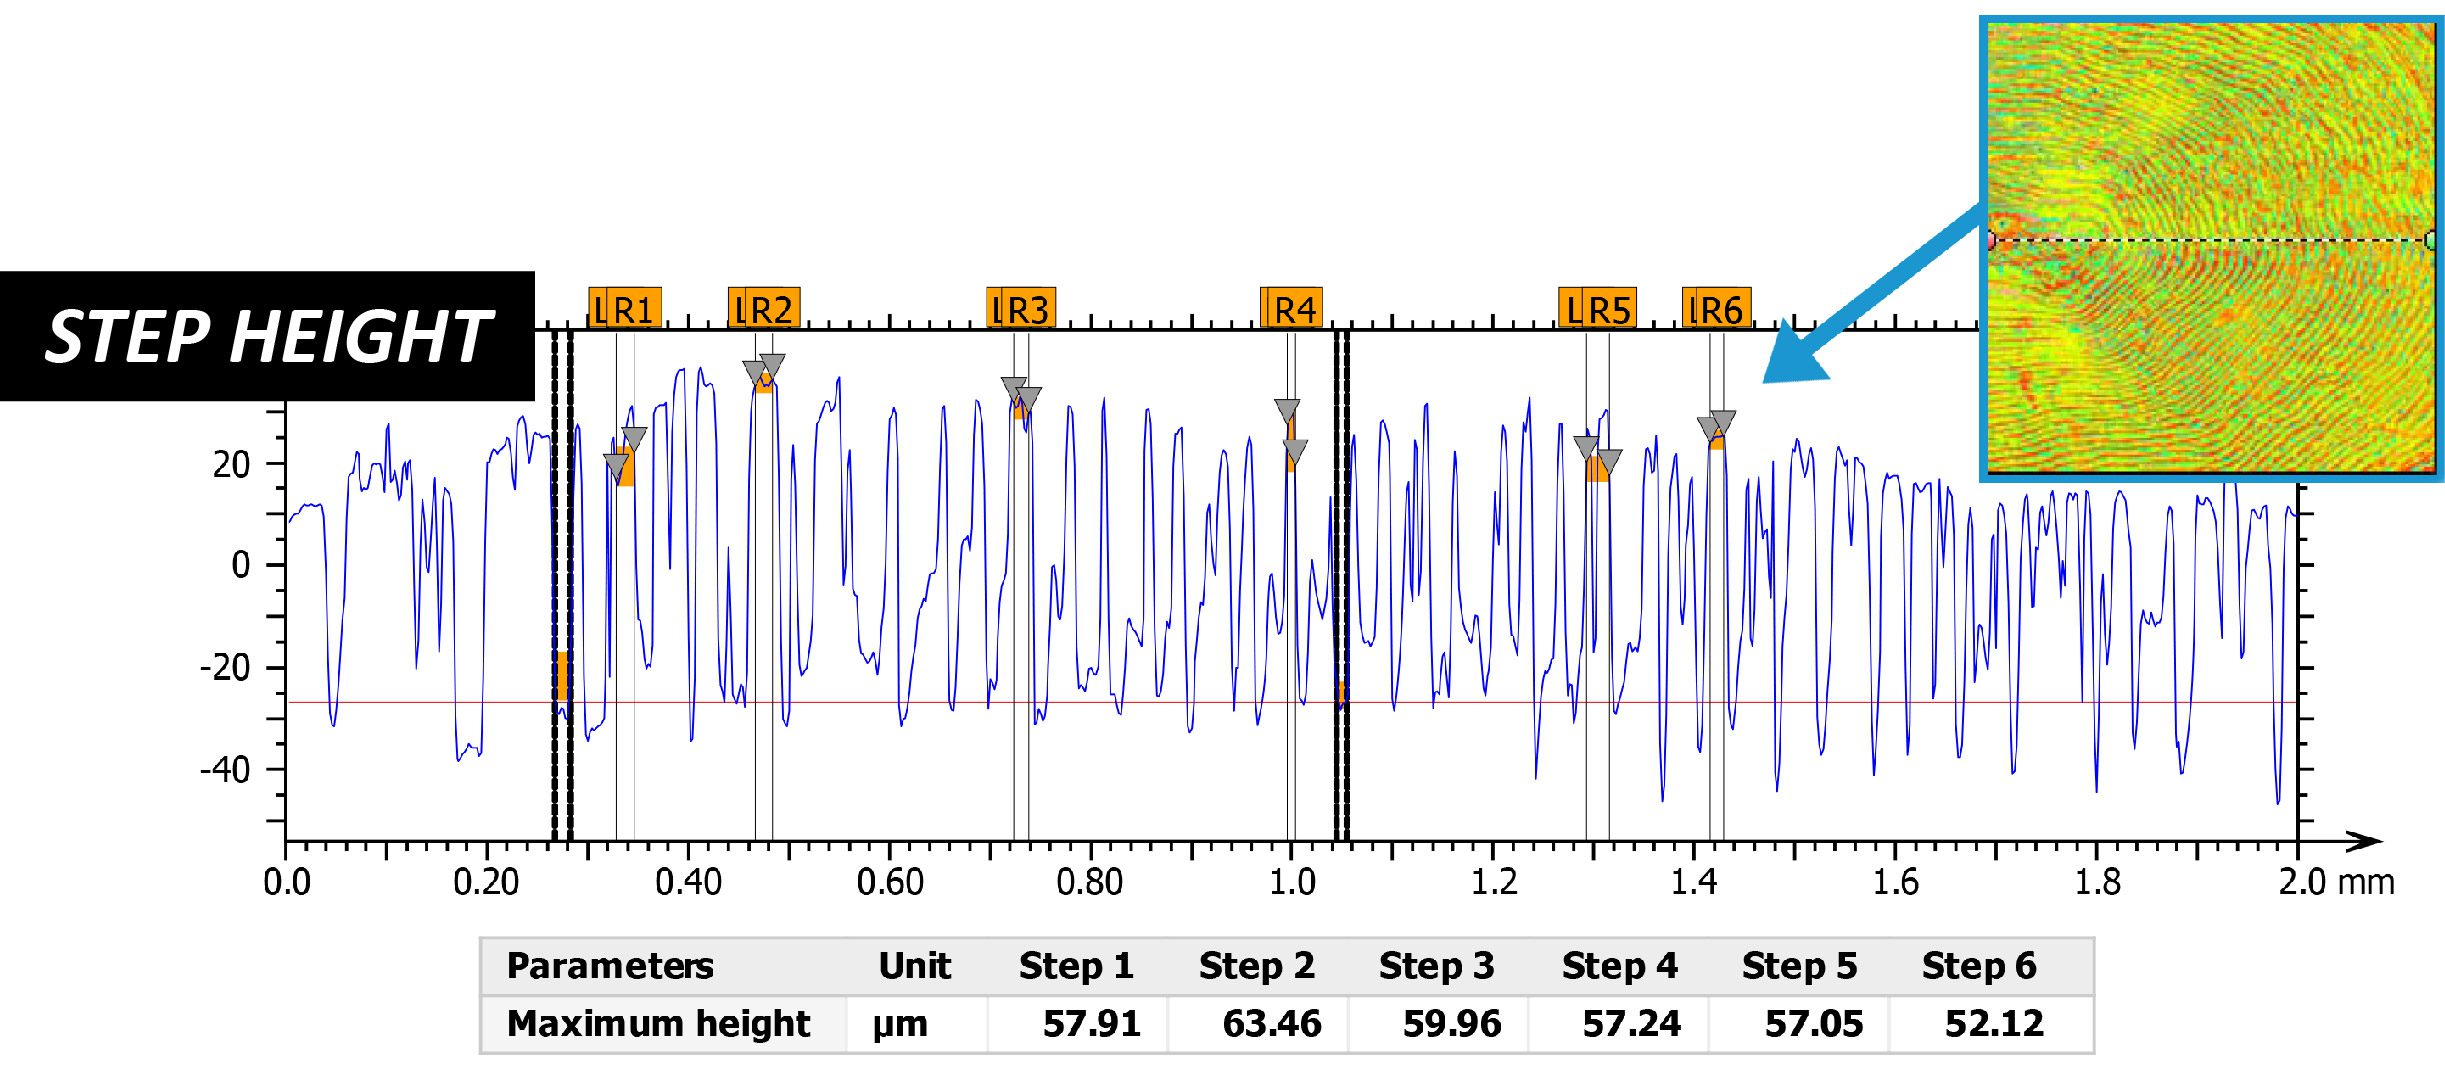
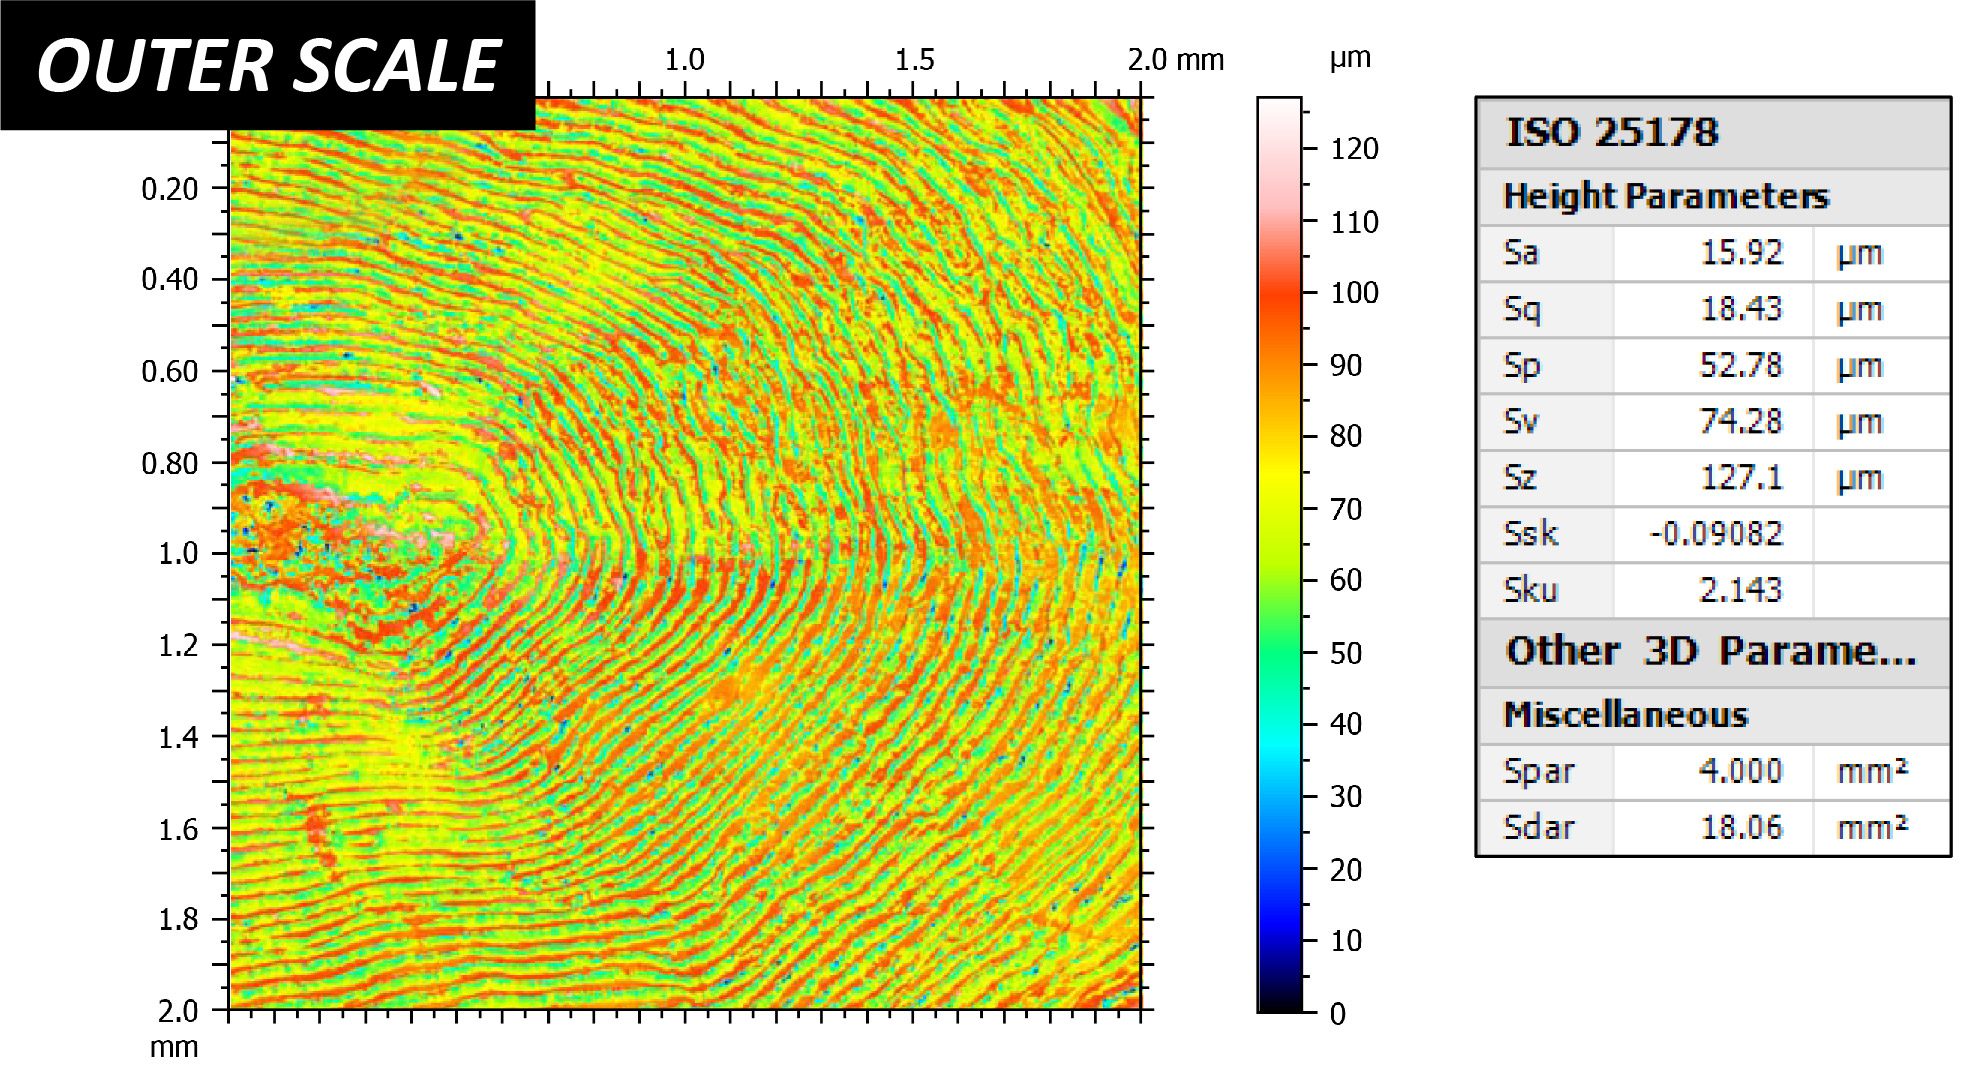
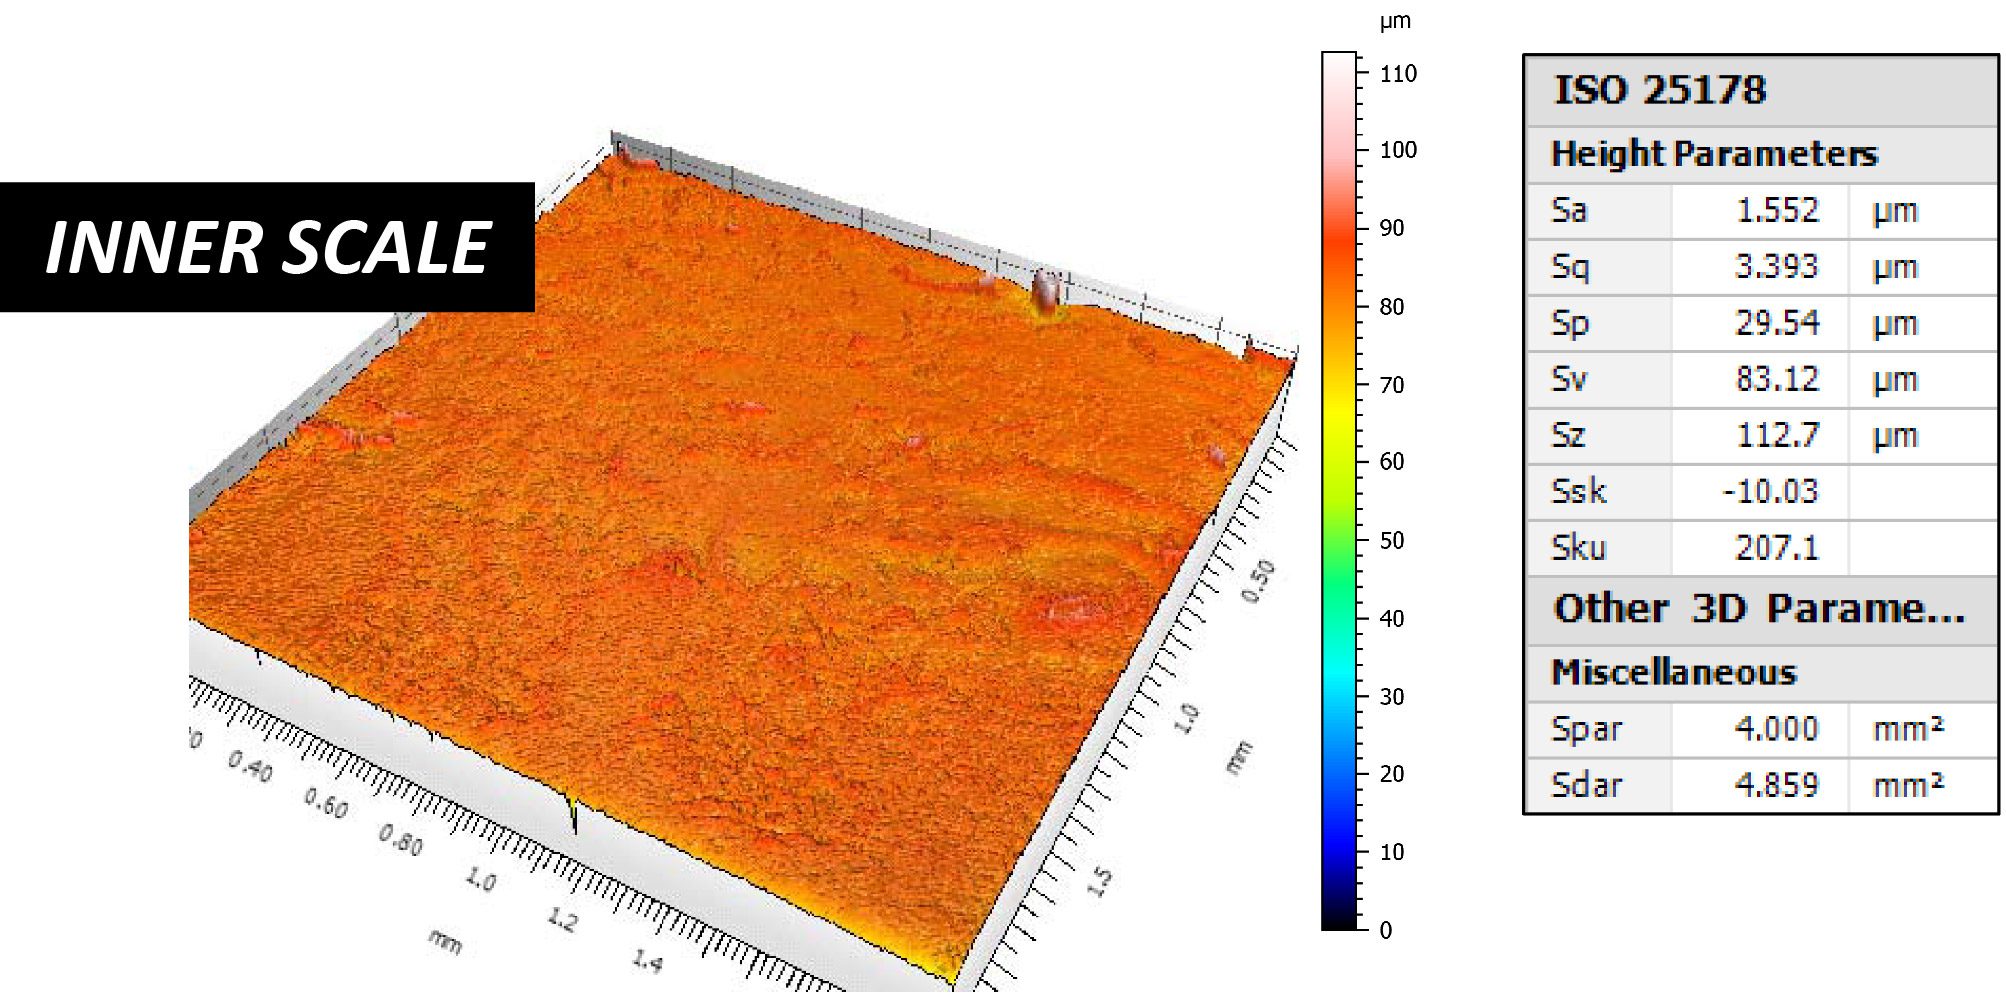
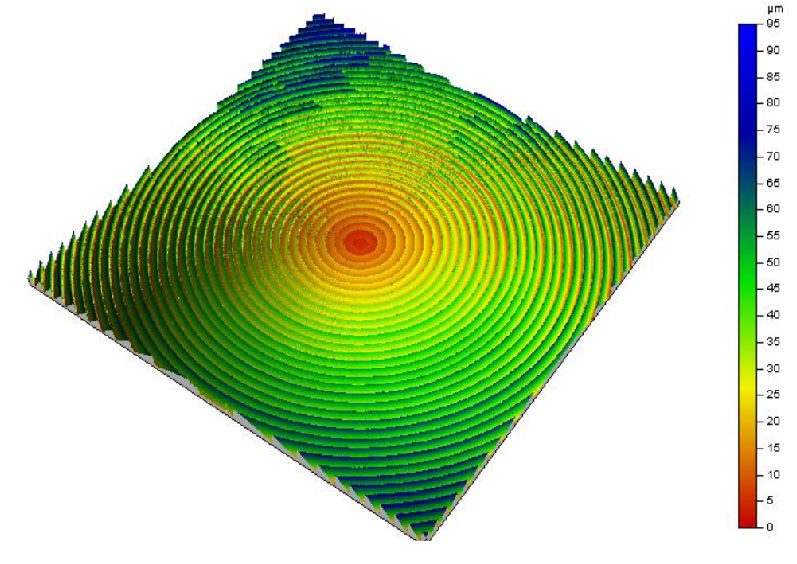
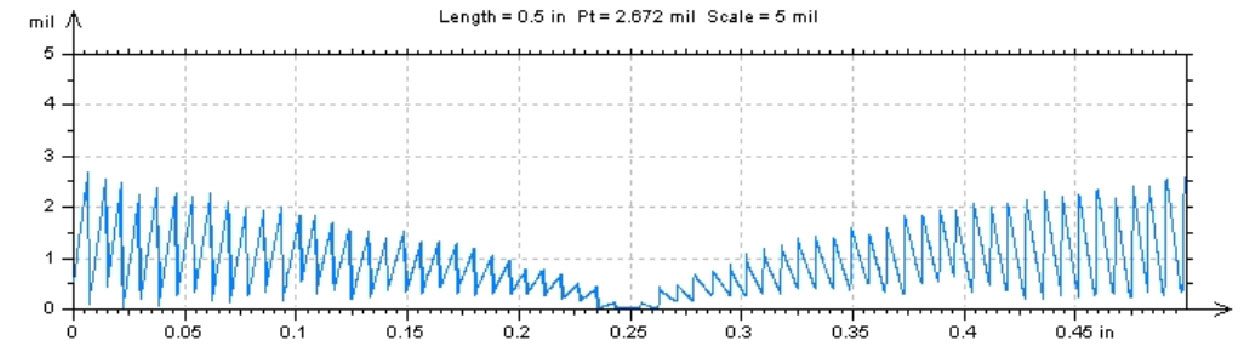
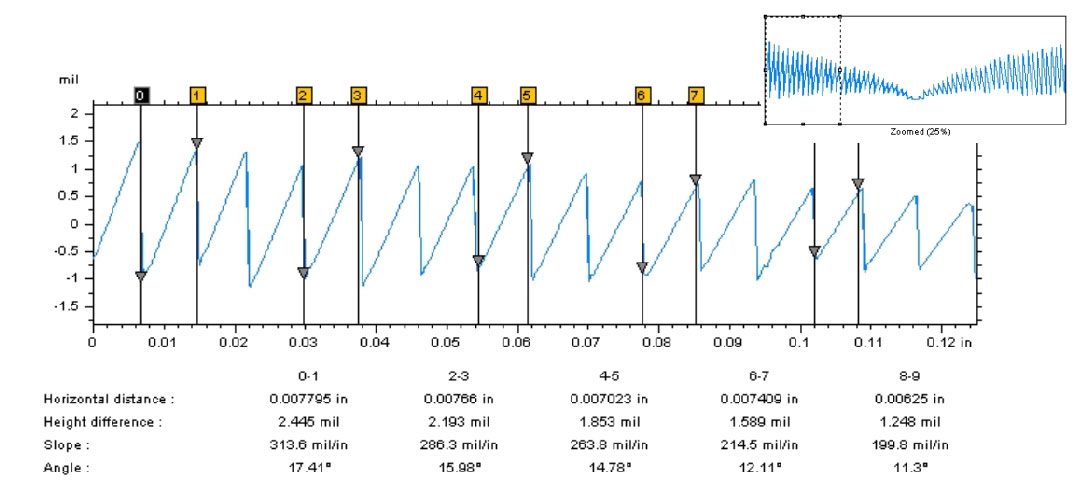
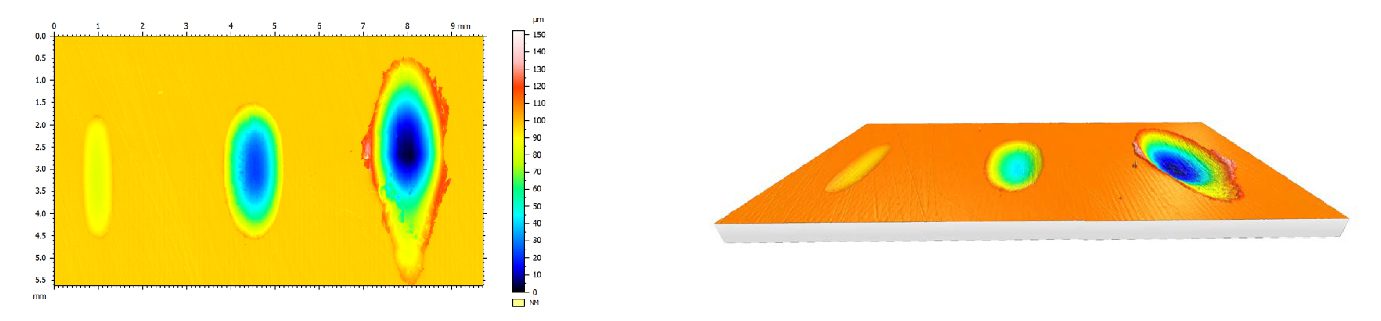
Dental Surface Roughness Measurement & 3D Tooth Topography

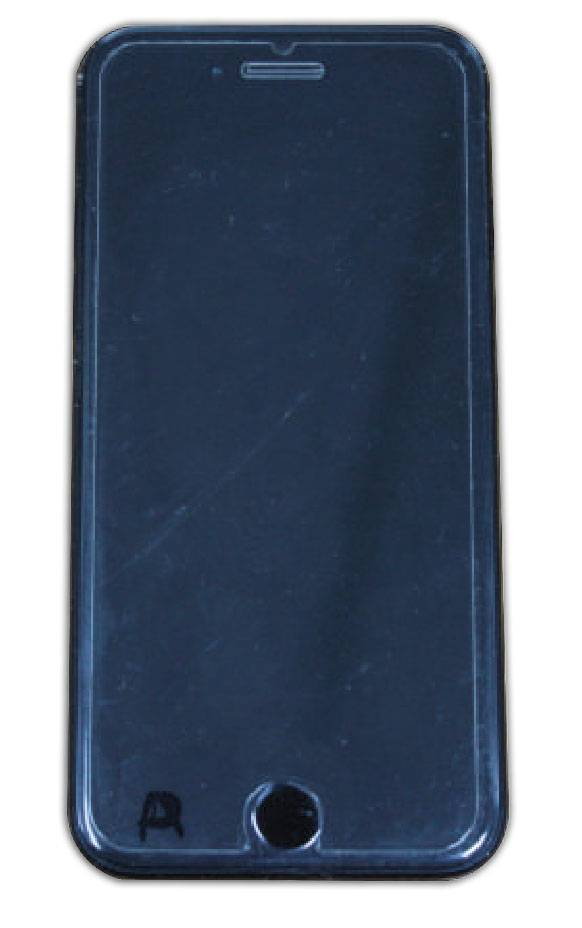
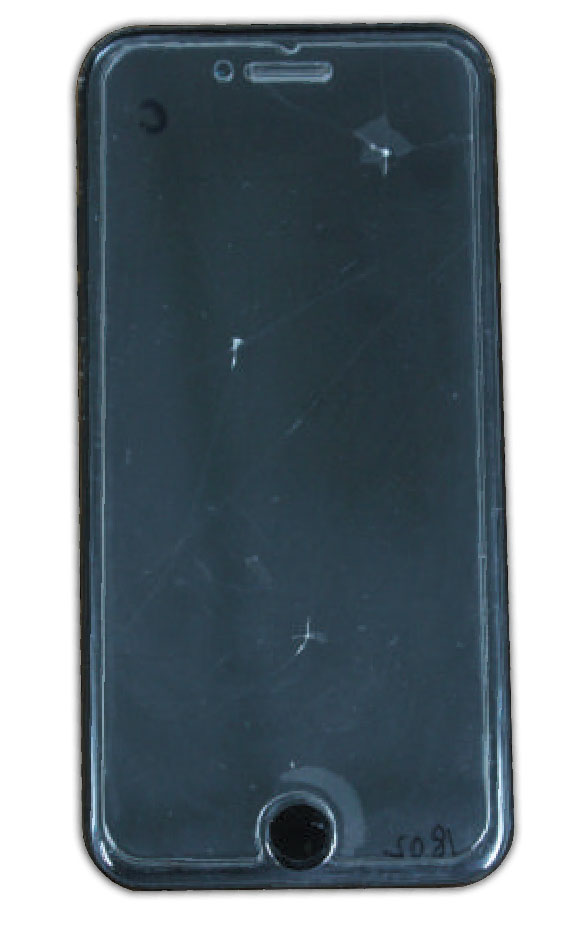
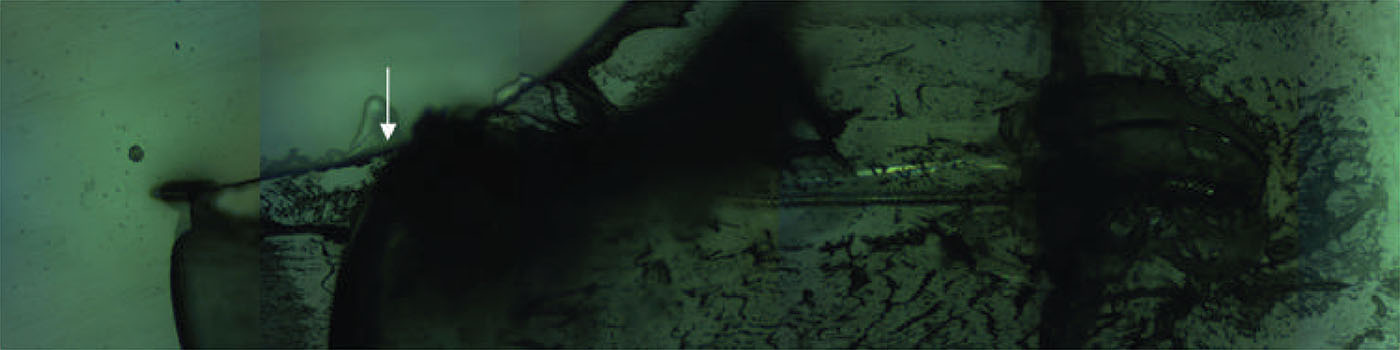
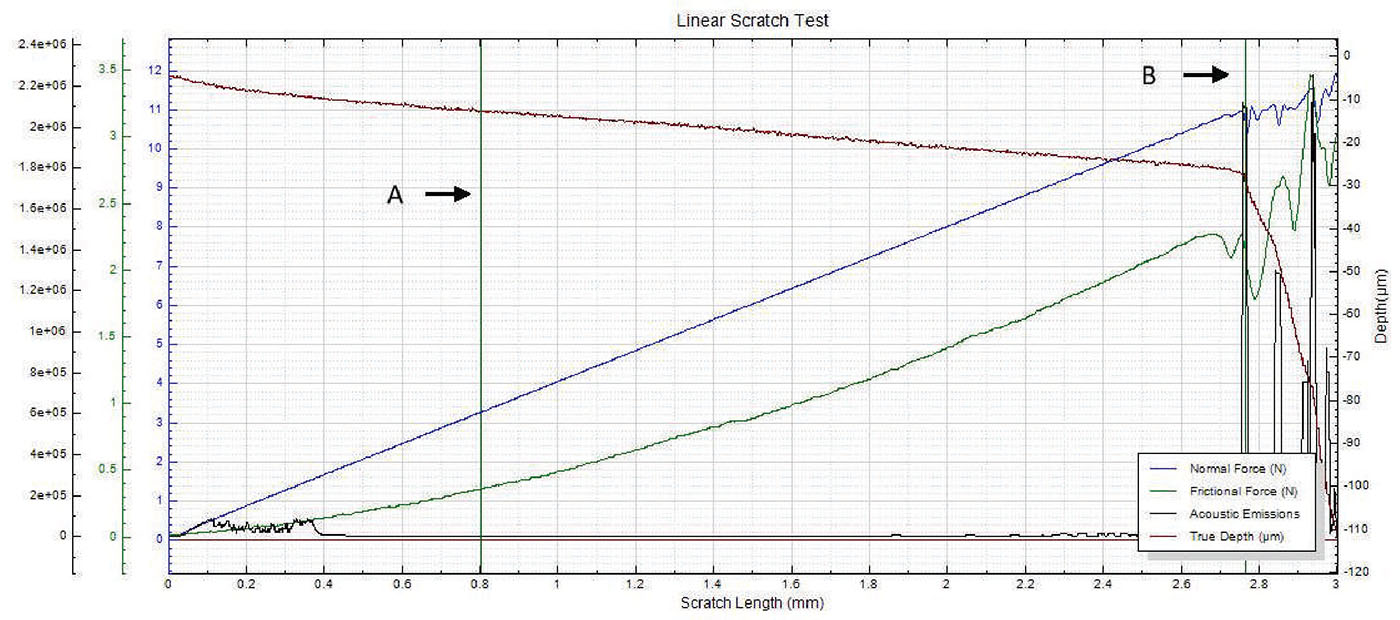
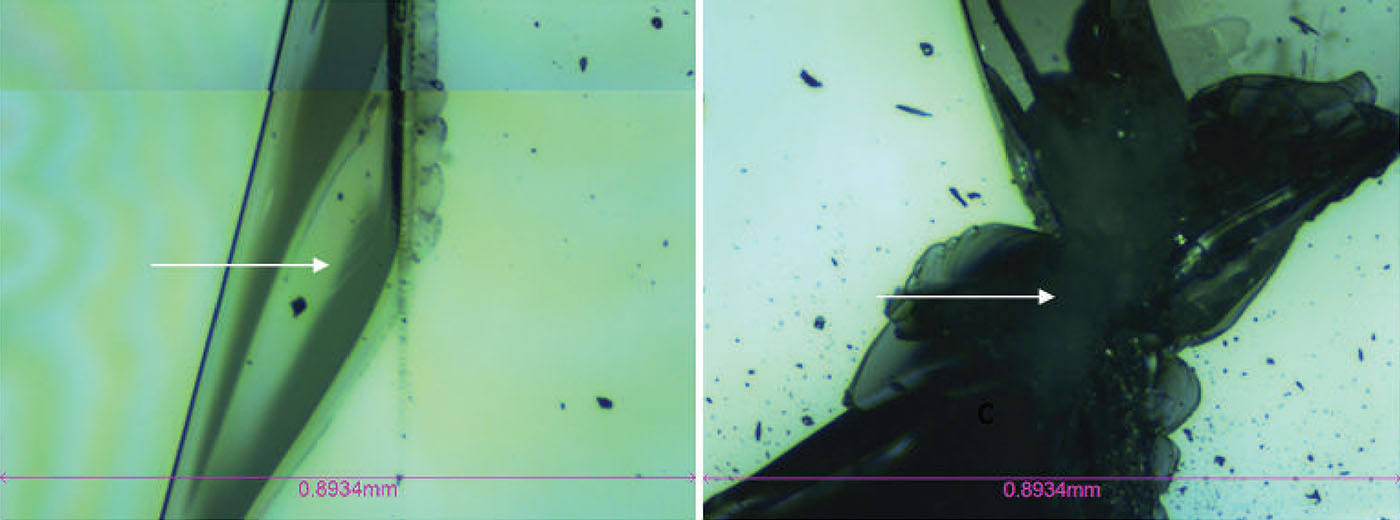
Scratch Resistance Testing of Phone Screen Protectors

In Situ Wear Measurement at High Temperature

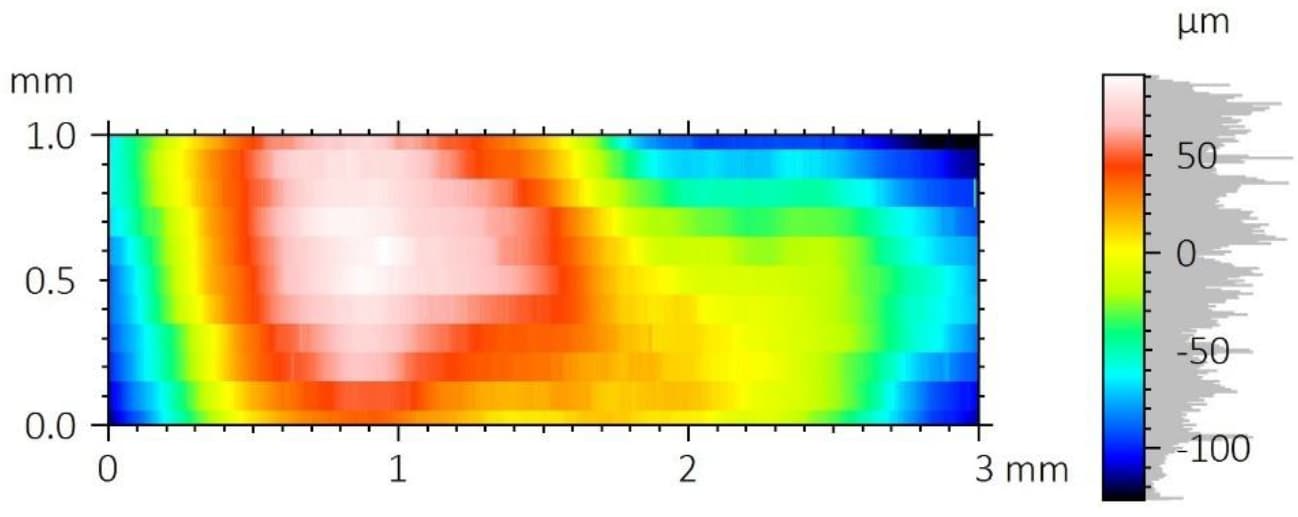
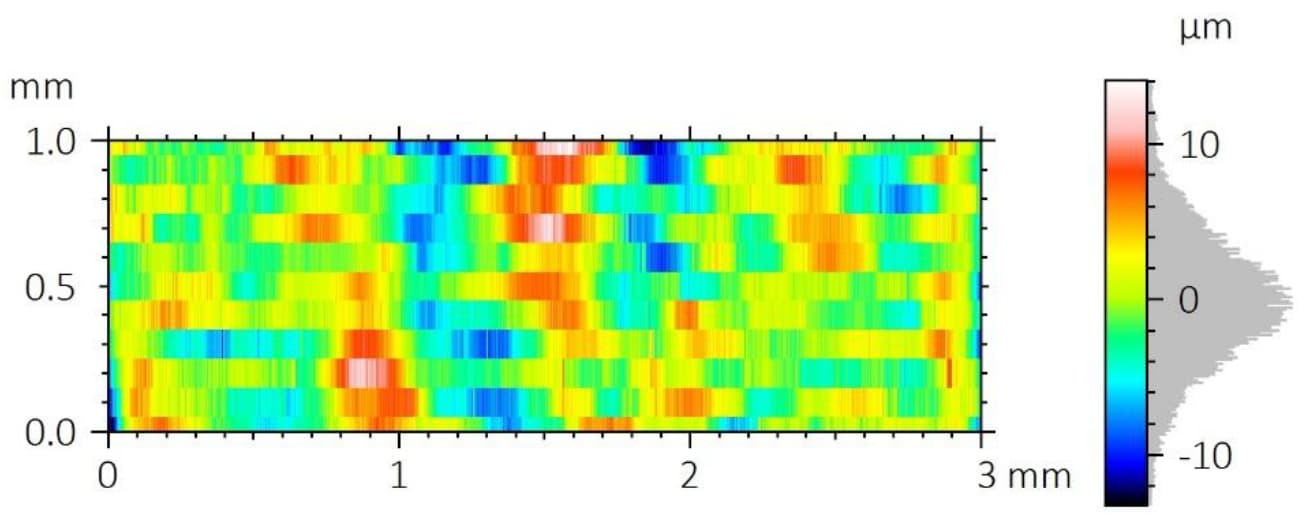
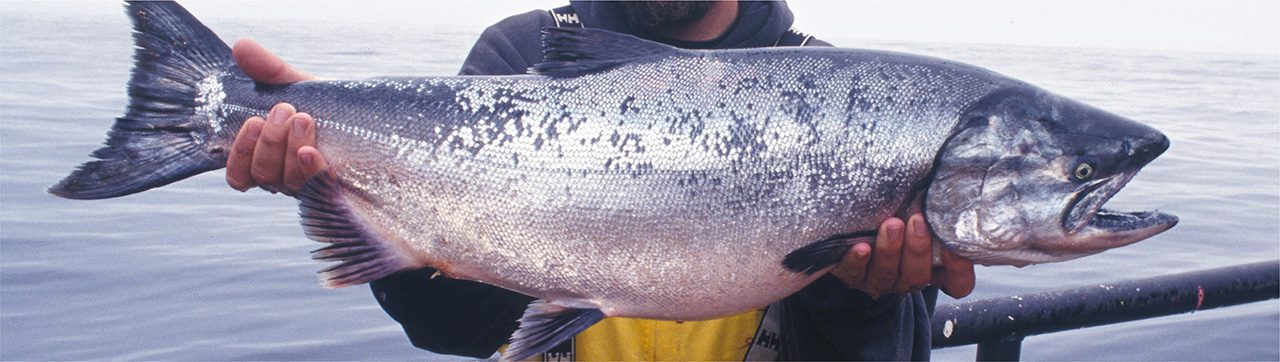
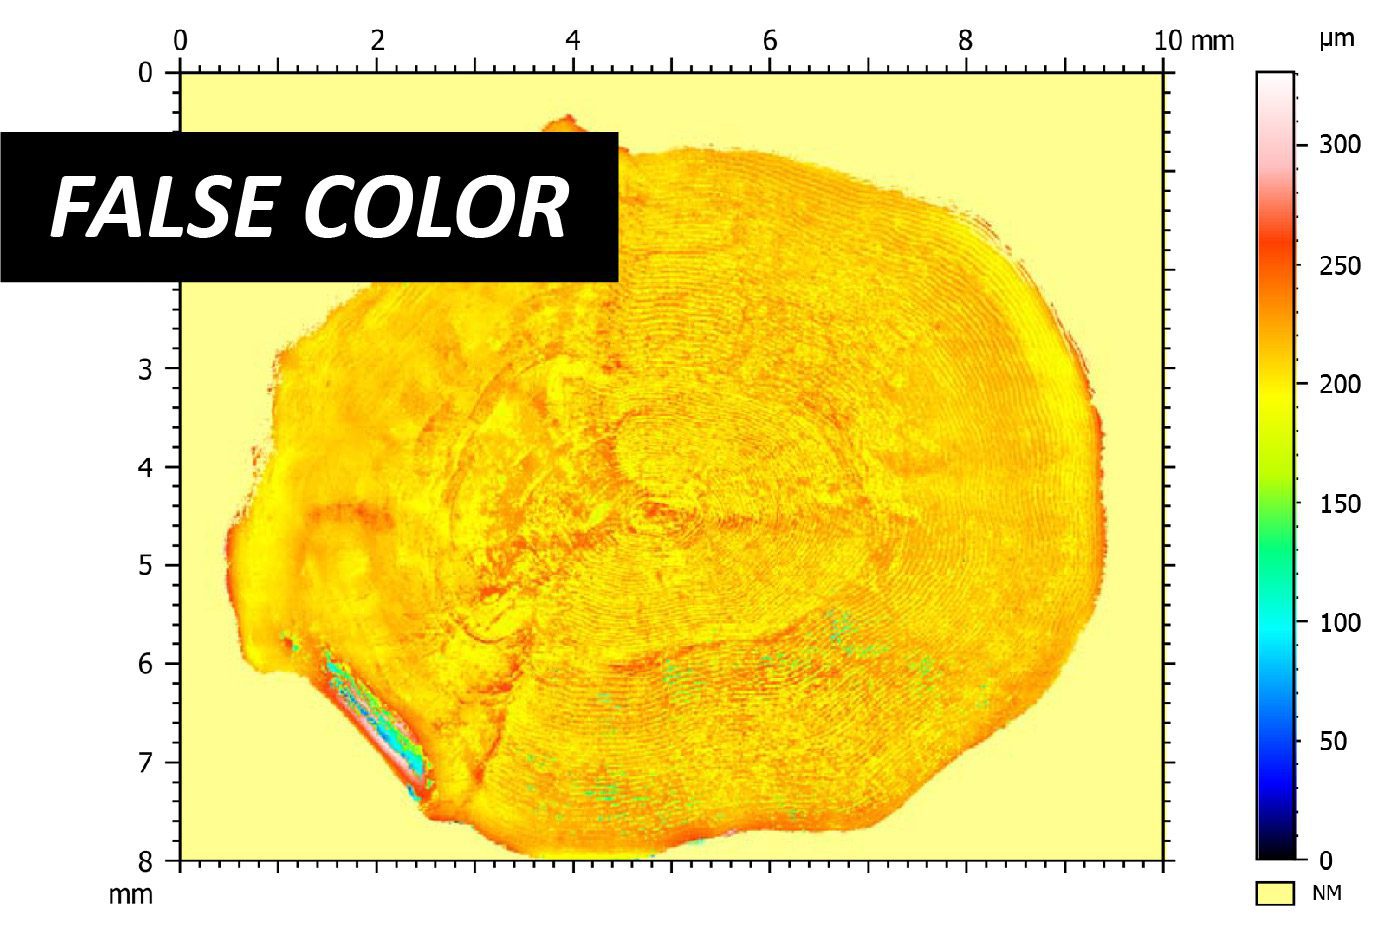
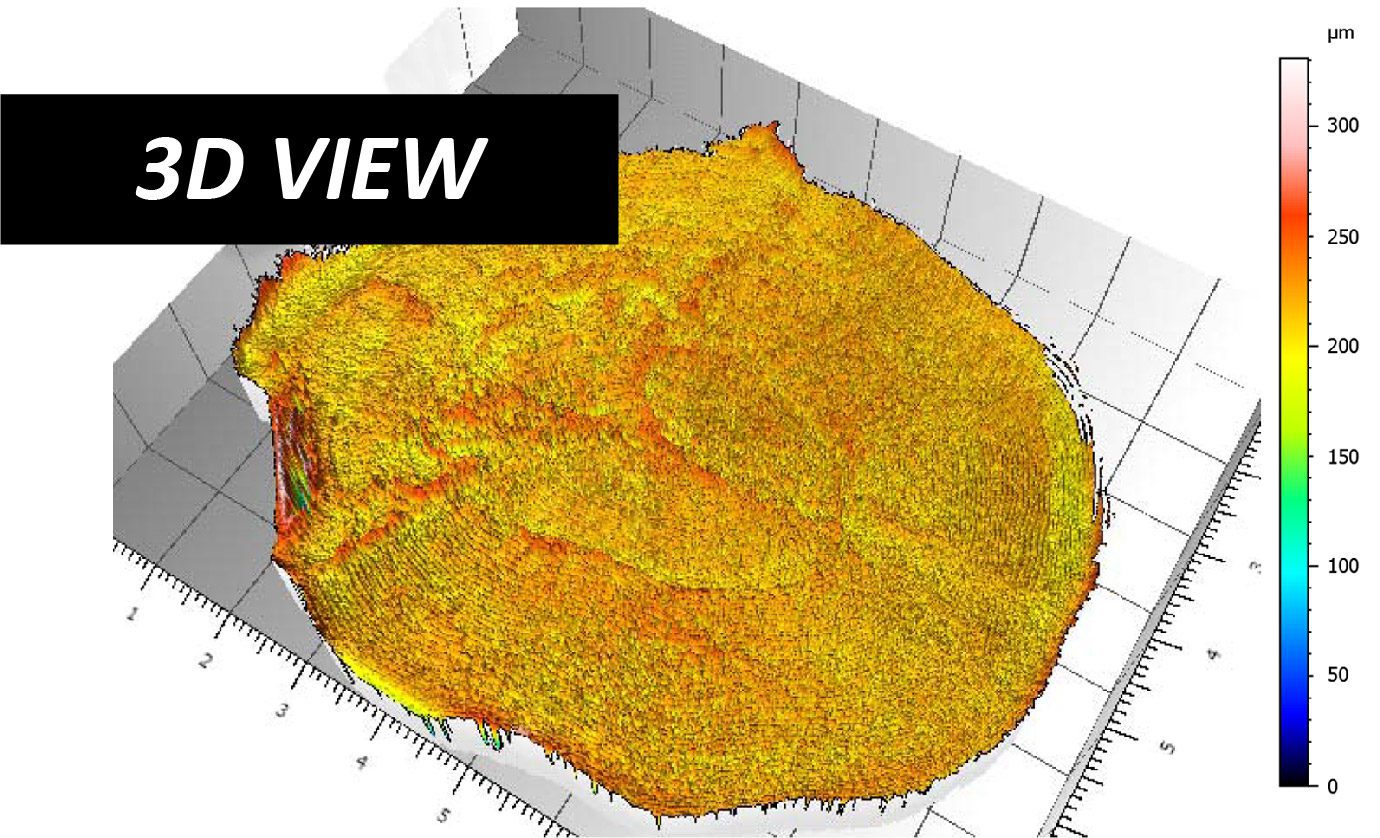
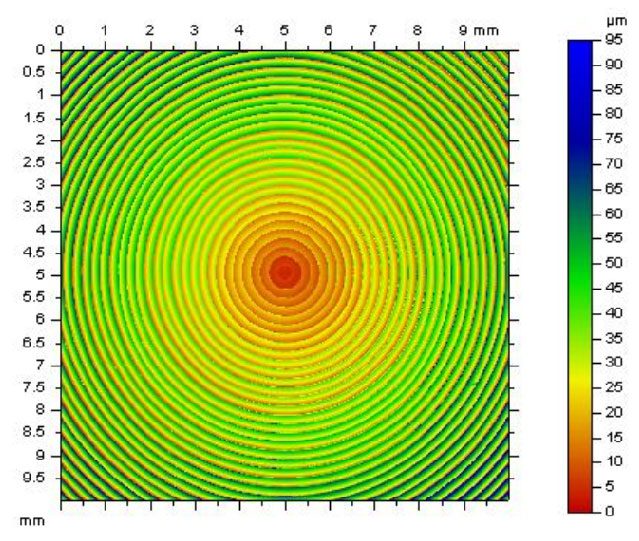
Fish Scale Surface Analysis Using 3D Optical Profiler

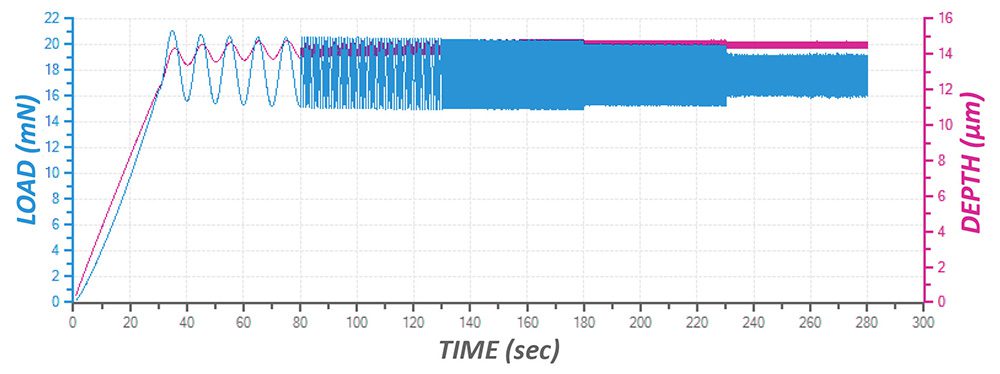
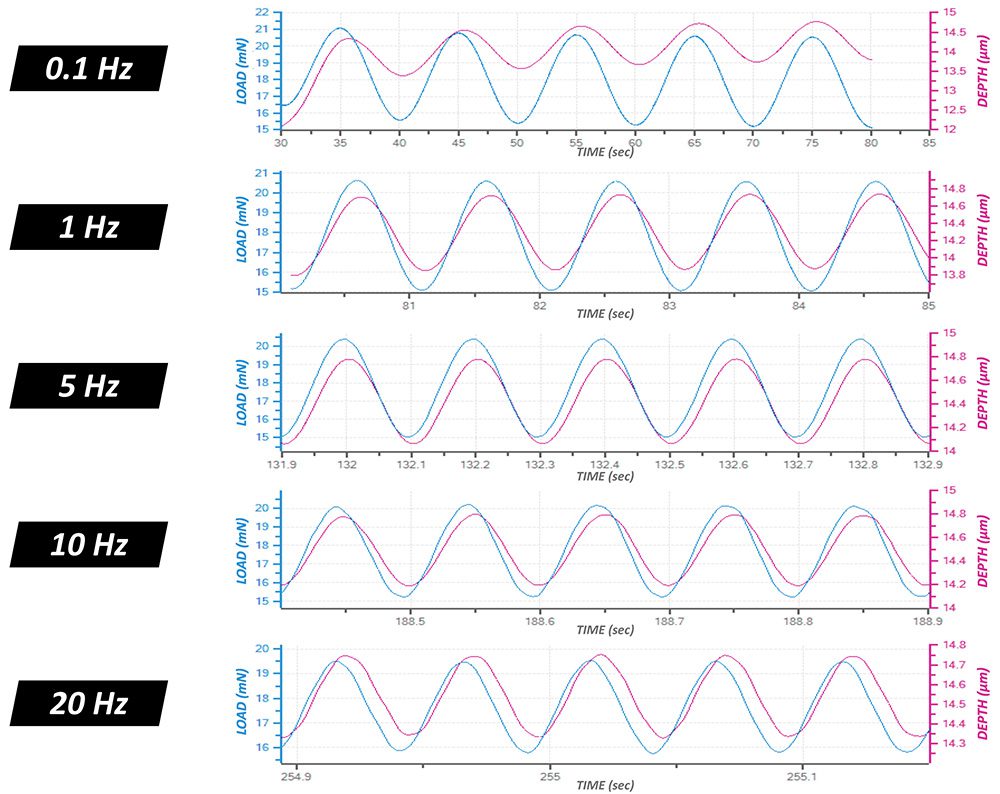
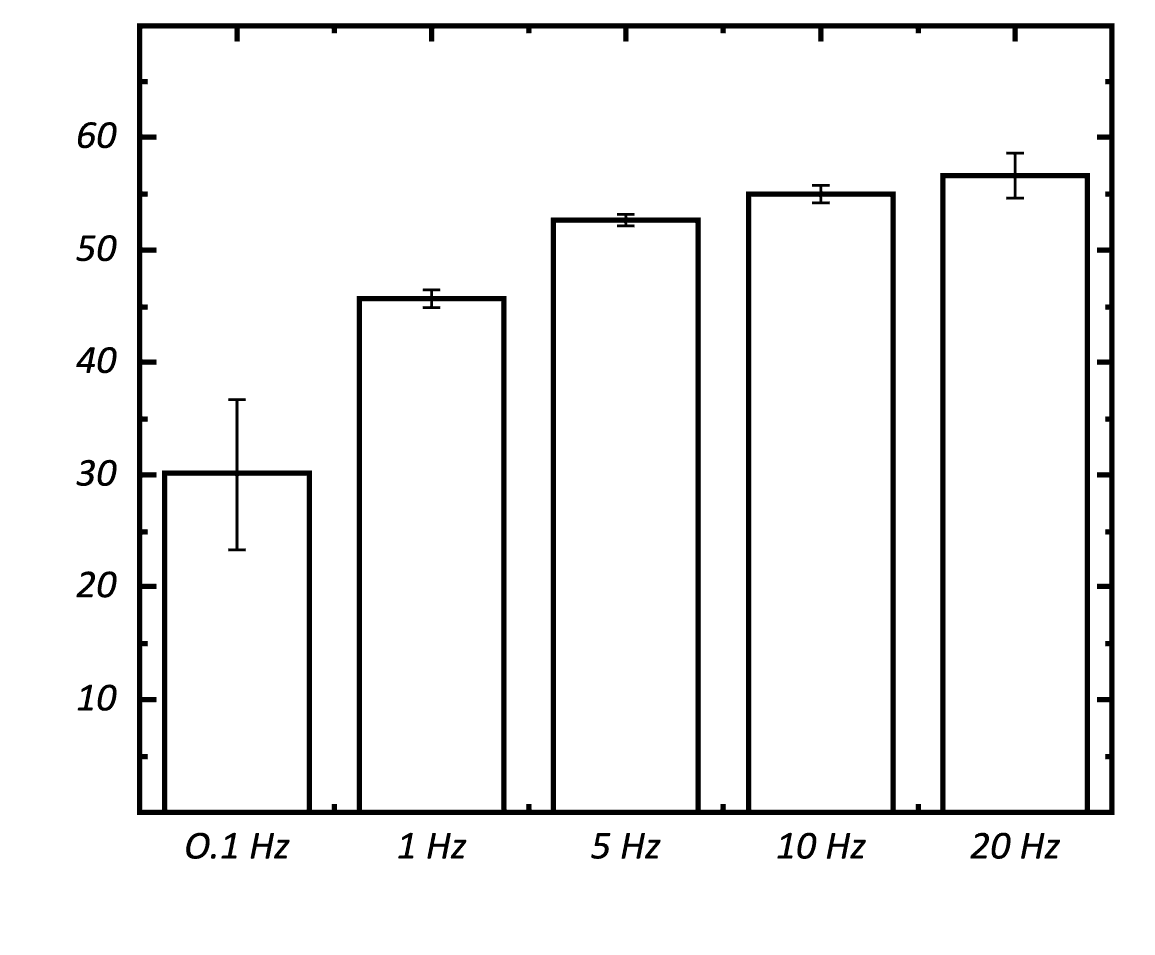
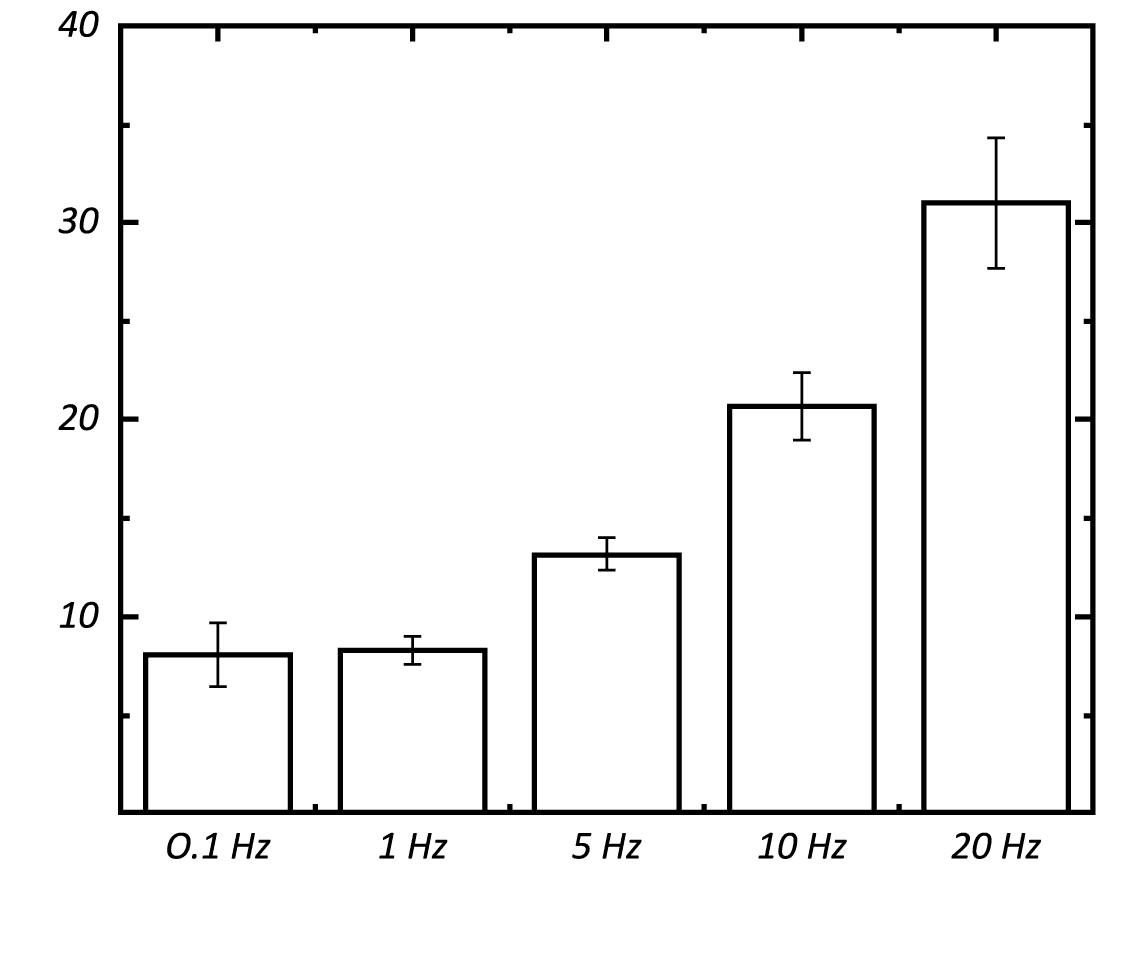
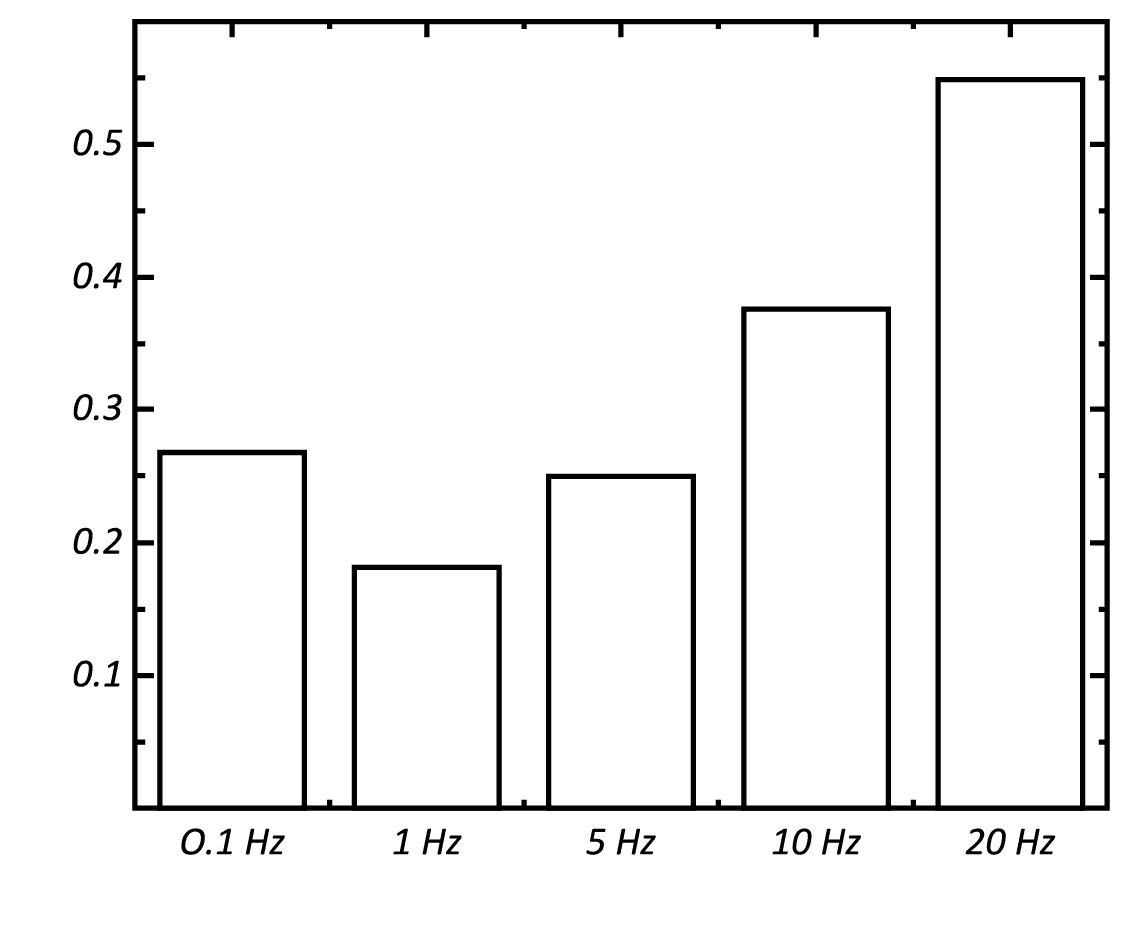
Dynamic Mechanical Analysis (DMA) Frequency Sweep on Polymer

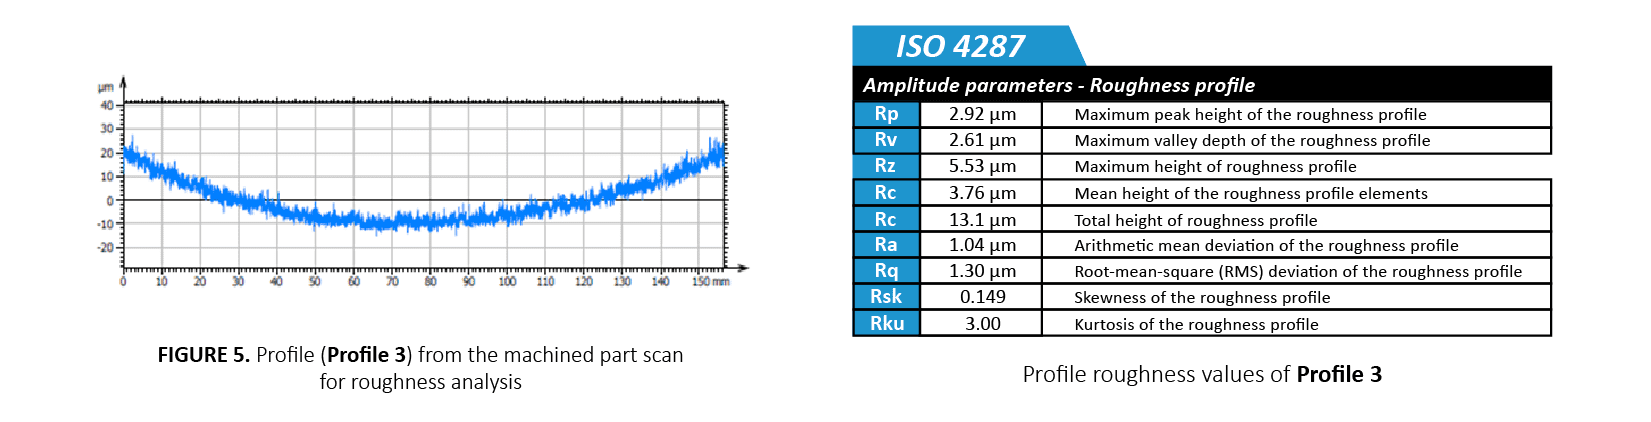
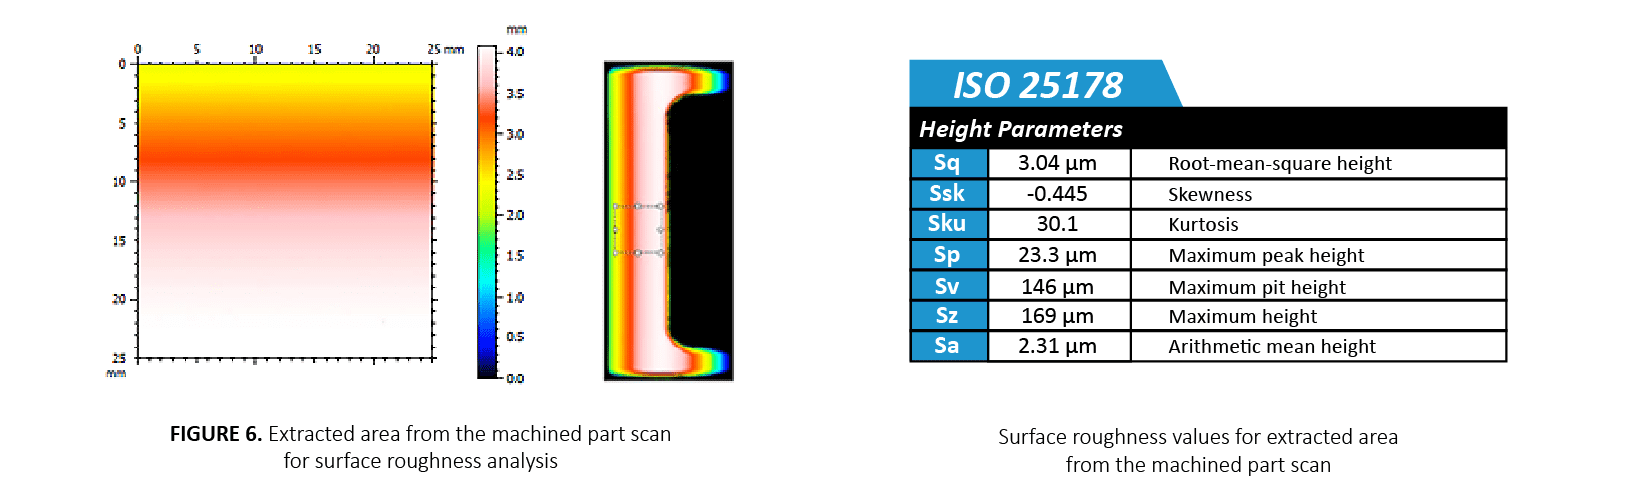
Machined Parts Inspection

Fretting Wear Evaluation
Ball Bearings: High Force Wear Resistance Study

INTRODUCTION
A ball bearing uses balls to reduce rotational friction and support radial and axial loads. The rolling balls between the bearing races produce much lower coefficient of friction (COF) compared to two flat surfaces sliding against each other. Ball bearings are often exposed to high contact stress levels, wear and extreme environmental conditions such as high temperatures. Therefore, wear resistance of the balls under high loads and extreme environmental conditions is critical for extending the lifetime of the ball bearing to cut down cost and time on repairs and replacements.
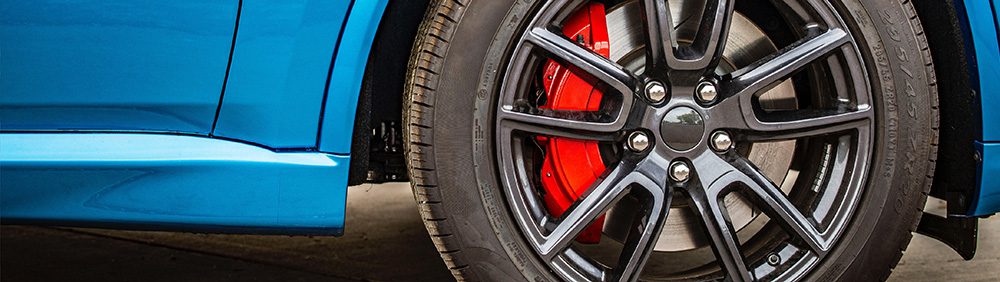
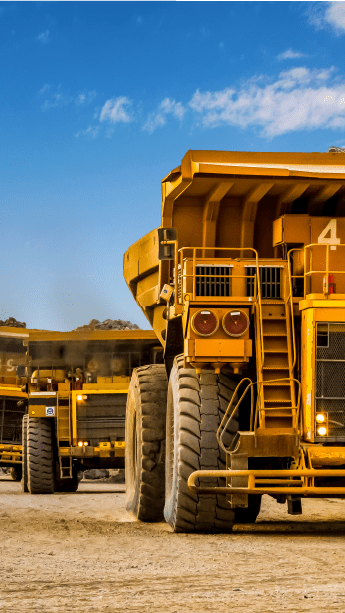
Ball bearings can be found in nearly all applications that involve moving parts. They are commonly used in transportation industries such as aerospace and automobile as well as the toy industry that manufactures items such as fidget spinner and skateboards.
BALL BEARING WEAR EVALUATION AT HIGH LOADS
Ball bearings can be made from an extensive list of materials. Commonly used materials range between metals like stainless steel and chrome steel or ceramics such as tungsten carbide (WC) and silicon nitride (Si3n4). To ensure that the manufactured ball bearings possess the required wear resistance ideal for the given application’s conditions, reliable tribological evaluations under high loads are necessary. Tribological testing aids in quantifying and contrasting the wear behaviors of different ball bearings in a controlled and monitored manner to select the best candidate for the targeted application.
MEASUREMENT OBJECTIVE
In this study, we showcase a Nanovea Tribometer as the ideal tool for comparing the wear resistance of different ball bearings under high loads.

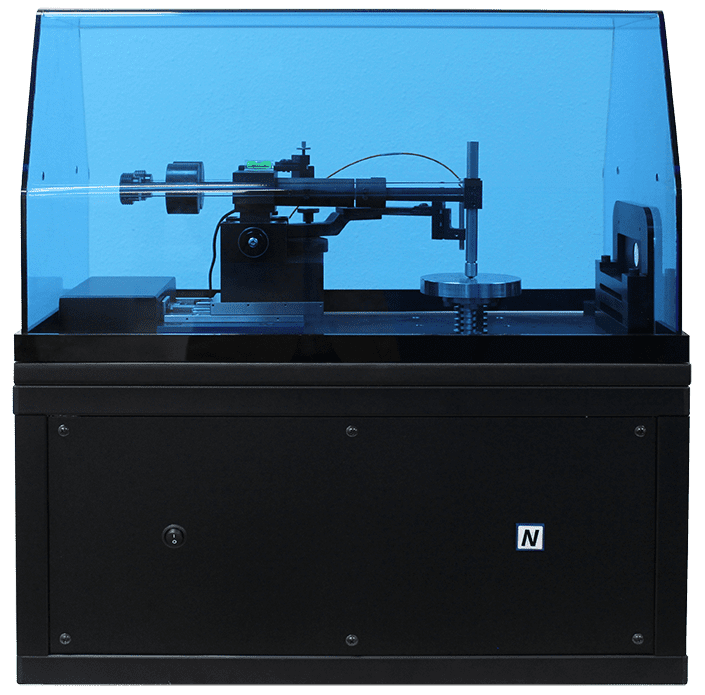
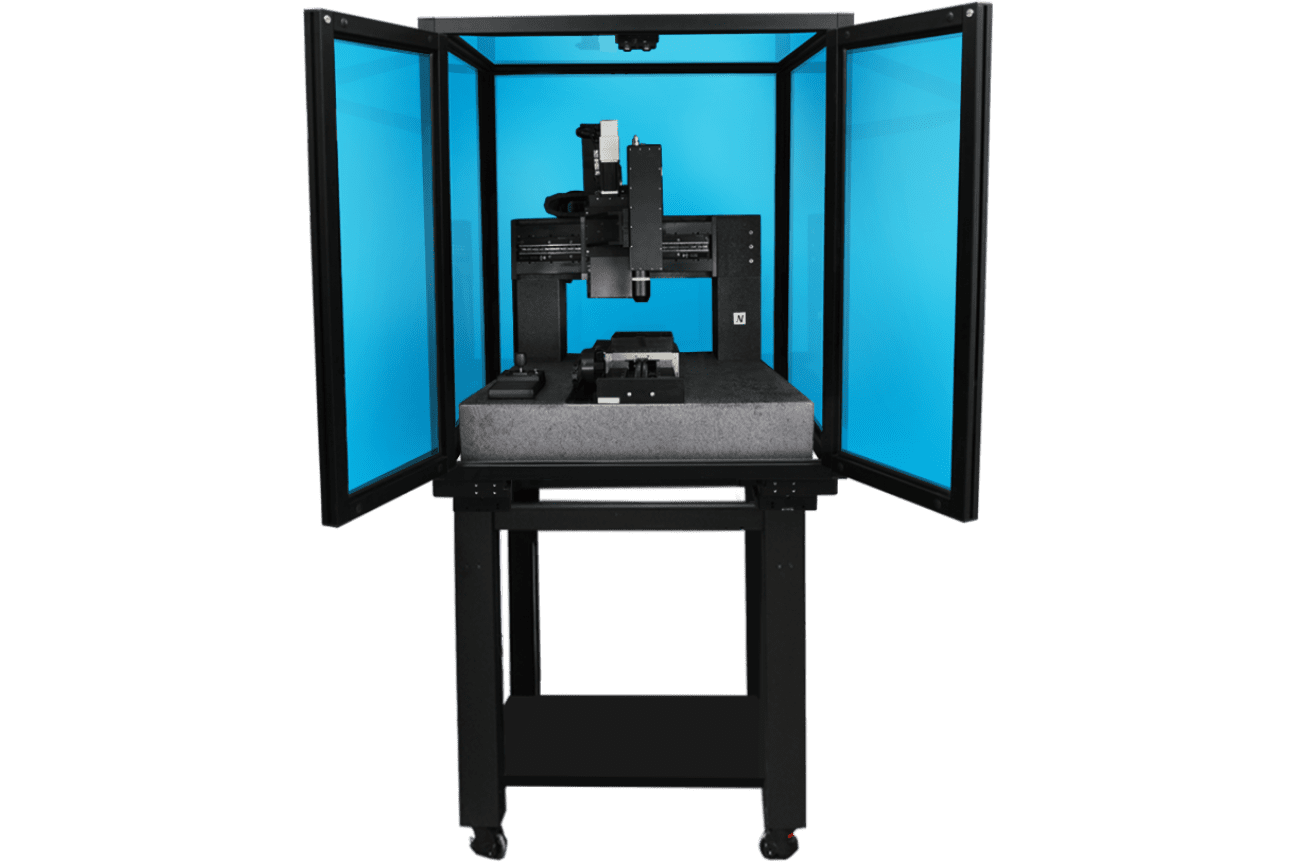
Figure 1: Setup of the bearing test.
TESTING PROCEDURE
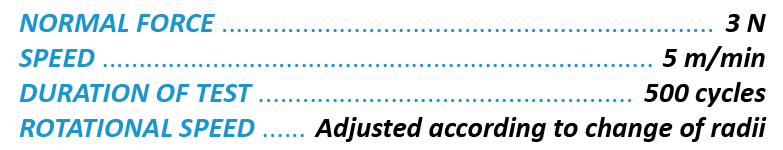
The coefficient of friction, COF, and the wear resistance of the ball bearings made of different materials were evaluated by a Nanovea Tribometer. P100 grit sandpaper was used as the counter material. The wear scars of the ball bearings were examined using a Nanovea 3D Non-Contact Profiler after the wear tests concluded. The test parameters are summarized in Table 1. The wear rate, K, was evaluated using the formula K=V/(F×s), where V is the worn volume, F is the normal load and s is the sliding distance. Ball wear scars were evaluated by a Nanovea 3D Non-Contact Profiler to ensure precise wear volume measurement.
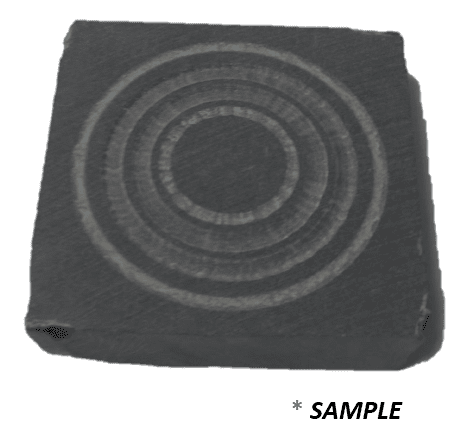
The automated motorized radial positioning feature allows the tribometer to decrease the radius of the wear track for the duration of a test. This test mode is called a spiral test and it ensures that the ball bearing always slides on a new surface of the sandpaper (Figure 2). It significantly improves the repeatability of the wear resistance test on the ball. The advanced 20bit encoder for internal speed control and 16bit encoder for external position control provide precise real-time speed and position information, allowing for a continuous adjustment of rotational speed to achieve constant linear sliding speed at the contact.
Please note that P100 Grit sandpaper was used to simplify the wear behavior between various ball materials in this study and can be substituted with any other material surface. Any solid material can be substituted to simulate the performance of a wide range of material couplings under actual application conditions, such as in liquid or lubricant.
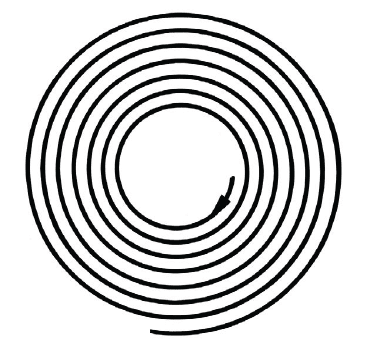
Figure 2: Illustration of the spiral passes for the ball bearing on the sandpaper.
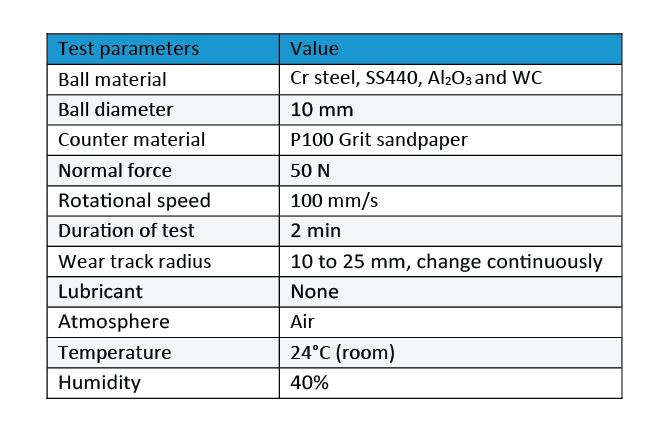
Table 1: Test parameters of the wear measurements.
RESULTS & DISCUSSION
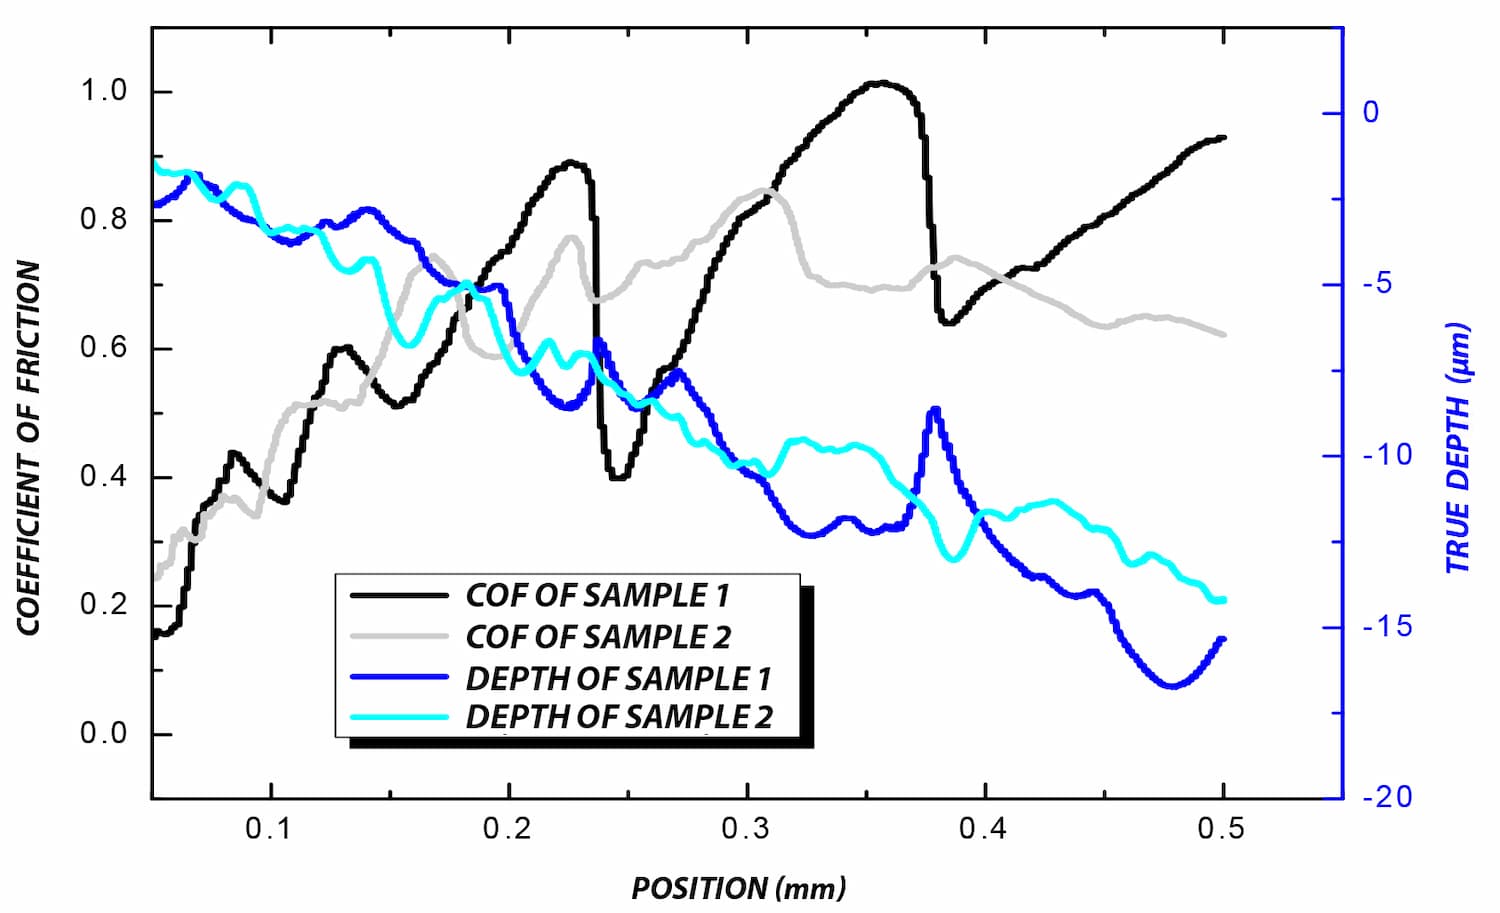
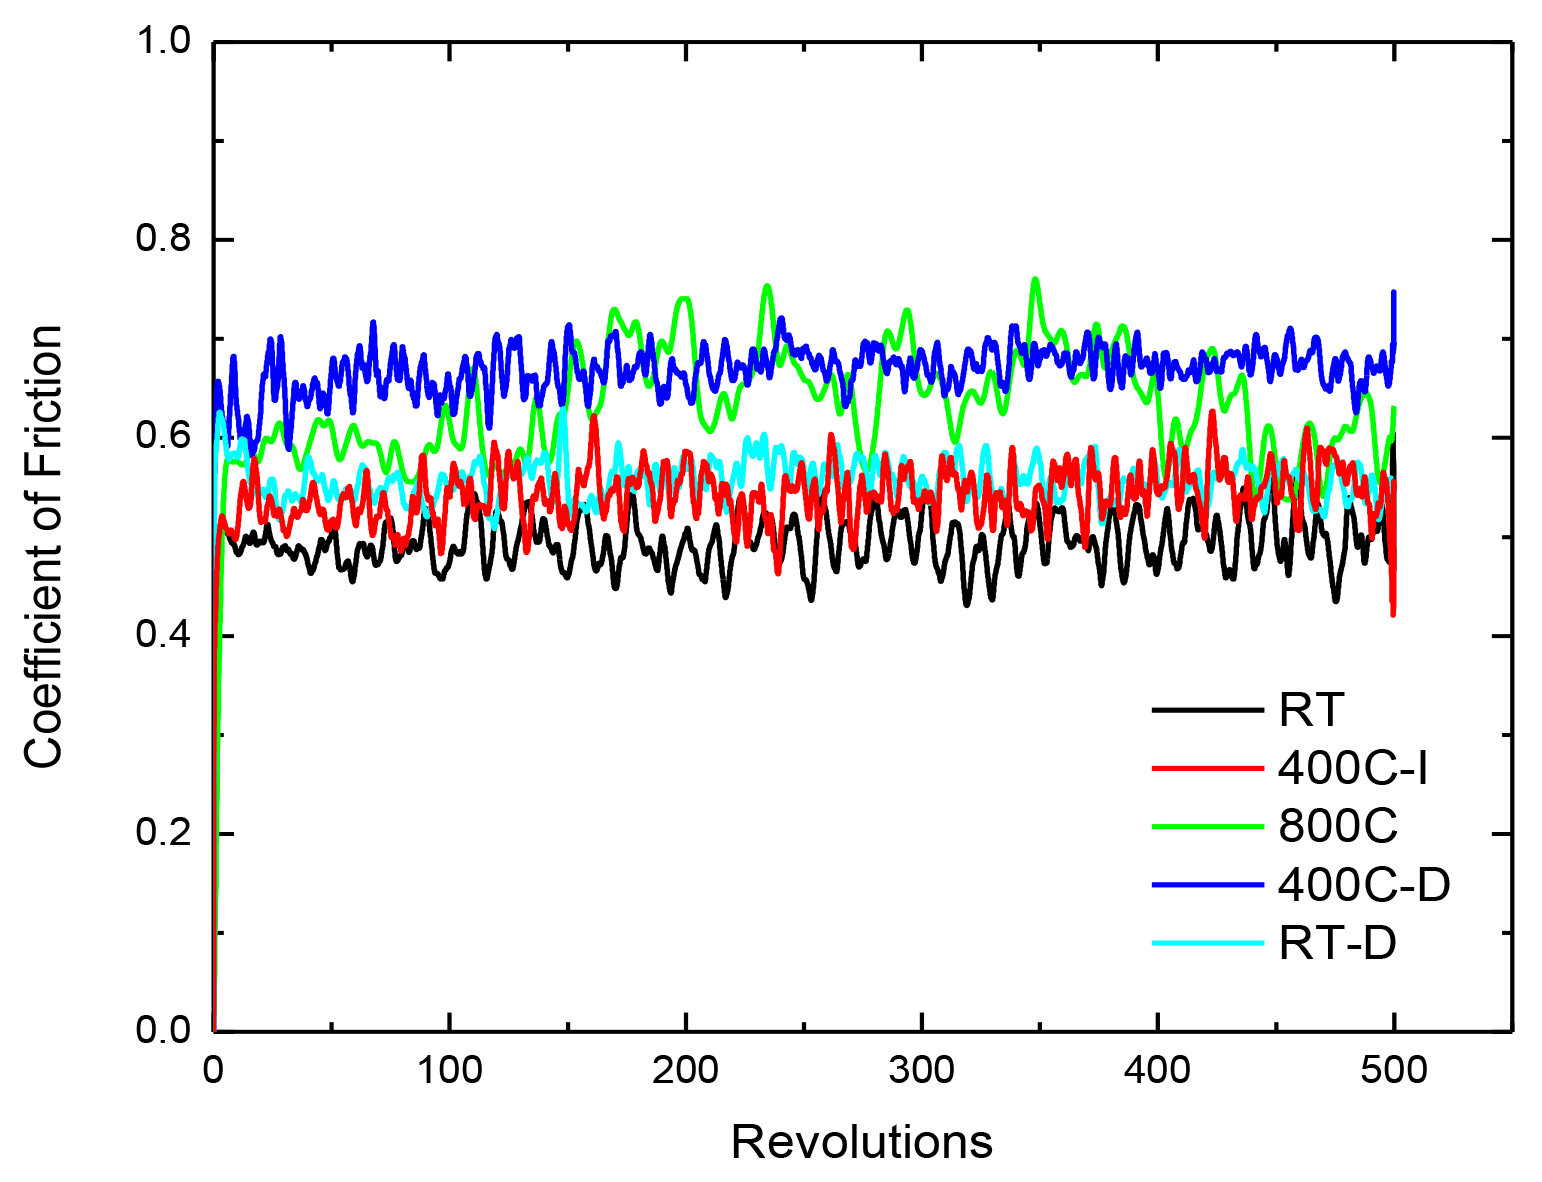
Wear rate is a vital factor for determining the service lifetime of the ball bearing, while a low COF is desirable to improve the bearing performance and efficiency. Figure 3 compares the evolution of COF for different ball bearings against the sandpaper during the tests. The Cr Steel ball shows an increased COF of ~0.4 during the wear test, compared to ~0.32 and ~0.28 for SS440 and Al2O3 ball bearings. On the other hand, the WC ball exhibits a constant COF of ~0.2 throughout the wear test. Observable COF variation can be seen throughout each test which is attributed to vibrations caused by the sliding movement of the ball bearings against the rough sandpaper surface.

Figure 3: Evolution of COF during the wear tests.
Figure 4 and Figure 5 compare the wear scars of the ball bearings after they were measured by an optical microscope and Nanovea Non-Contact optical profiler, respectively, and Table 2 summarizes the results of the wear track analysis. The Nanovea 3D profiler precisely determines the wear volume of the ball bearings, making it possible to calculate and compare the wear rates of different ball bearings. It can be observed that the Cr Steel and SS440 balls exhibit much larger flattened wear scars compared to the ceramic balls, i.e. Al2O3 and WC after the wear tests. The Cr Steel and SS440 balls have comparable wear rates of 3.7×10⁻³ and 3.2×10⁻³ m3/N m, respectively. In comparison, the Al2O3 ball shows an enhanced wear resistance with a wear rate of 7.2×10⁻⁴ m3/N m. The WC ball barely exhibits minor scratches on the shallow wear track area, resulting in a significantly reduced wear rate of 3.3×10⁻⁶ mm3/N m.
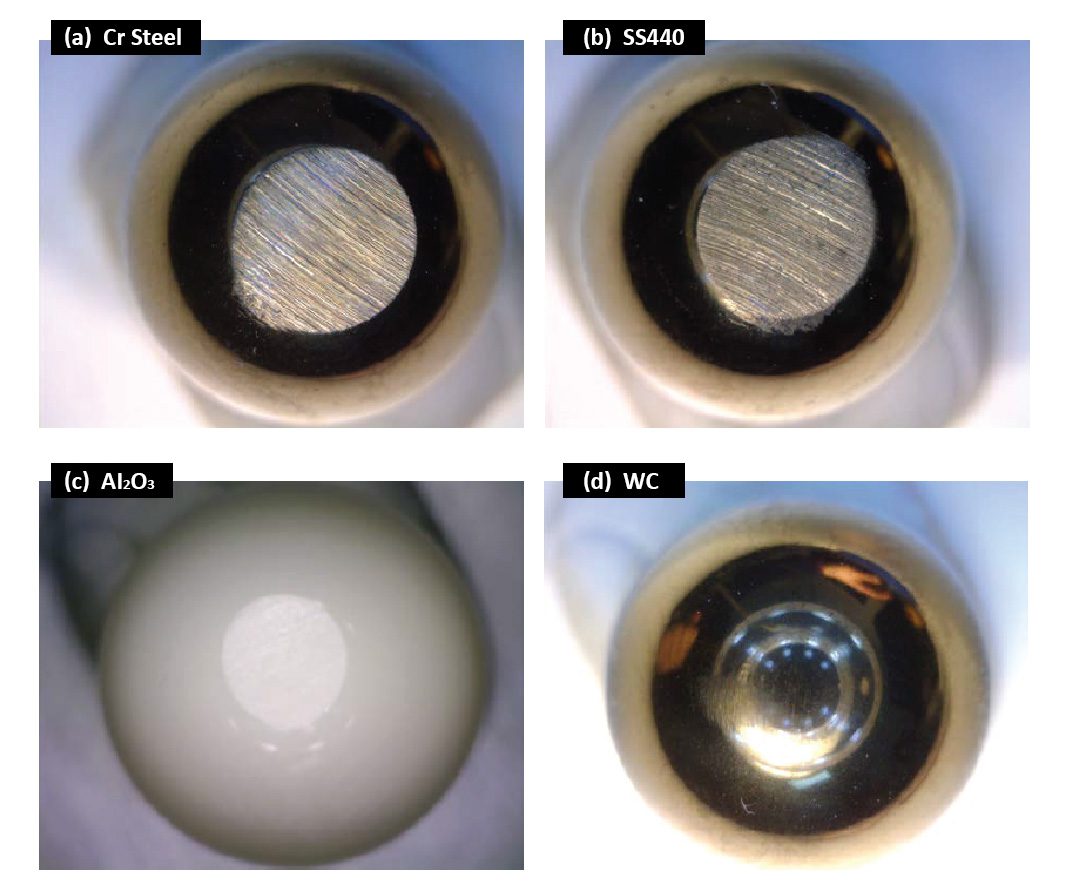
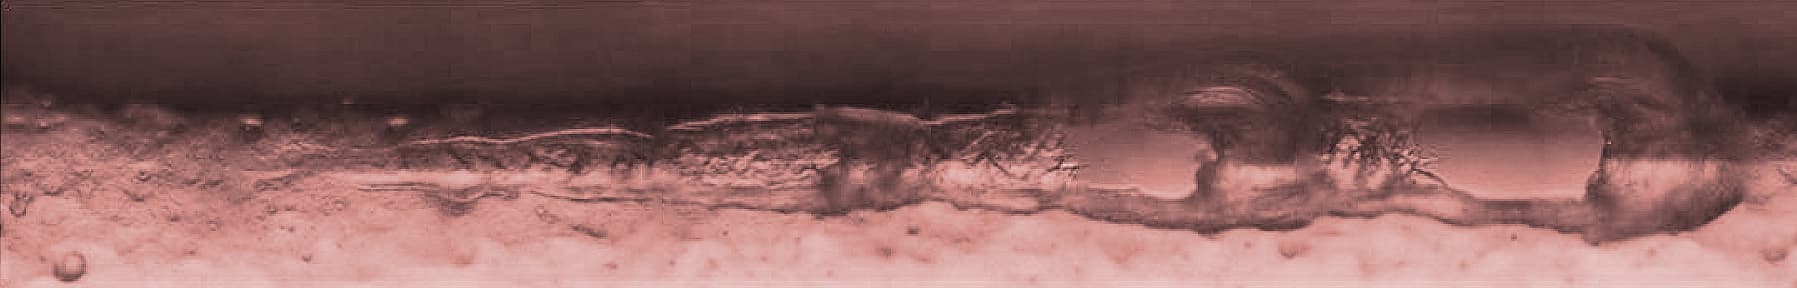
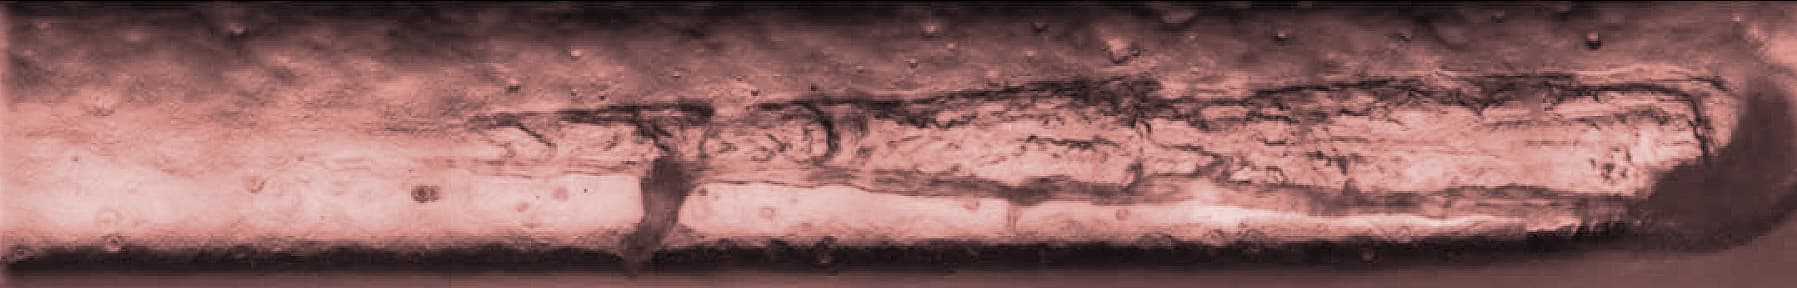
Figure 4: Wear scars of the ball bearings after the tests.
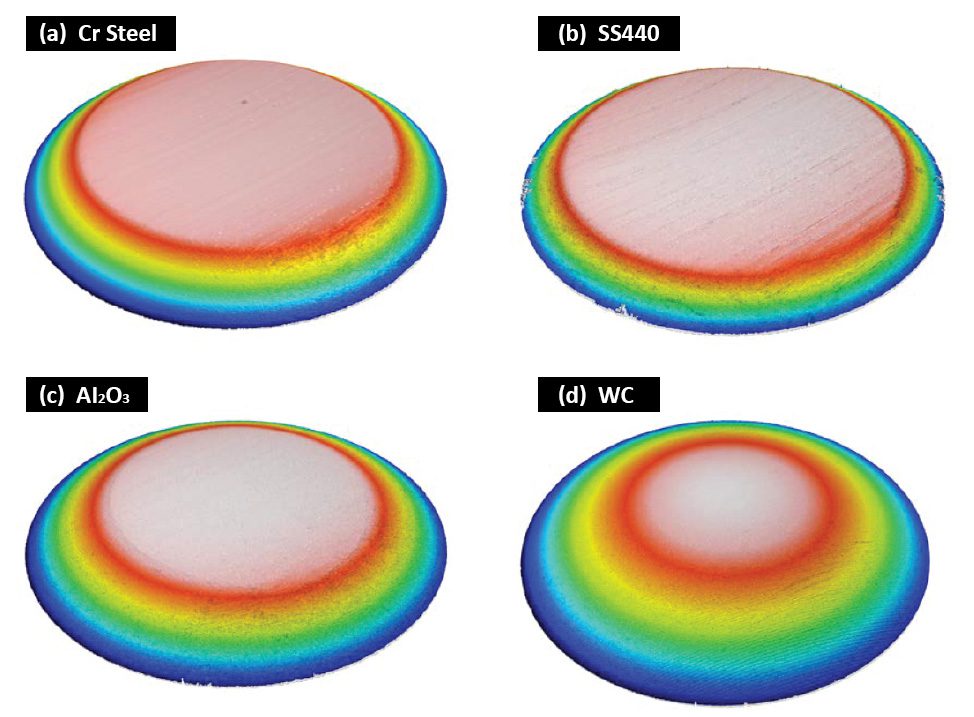
Figure 5: 3D morphology of the wear scars on the ball bearings.
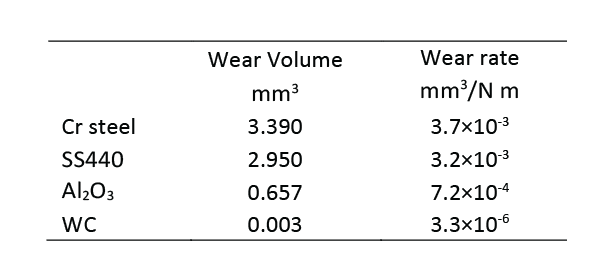
Table 2: Wear scar analysis of the ball bearings.
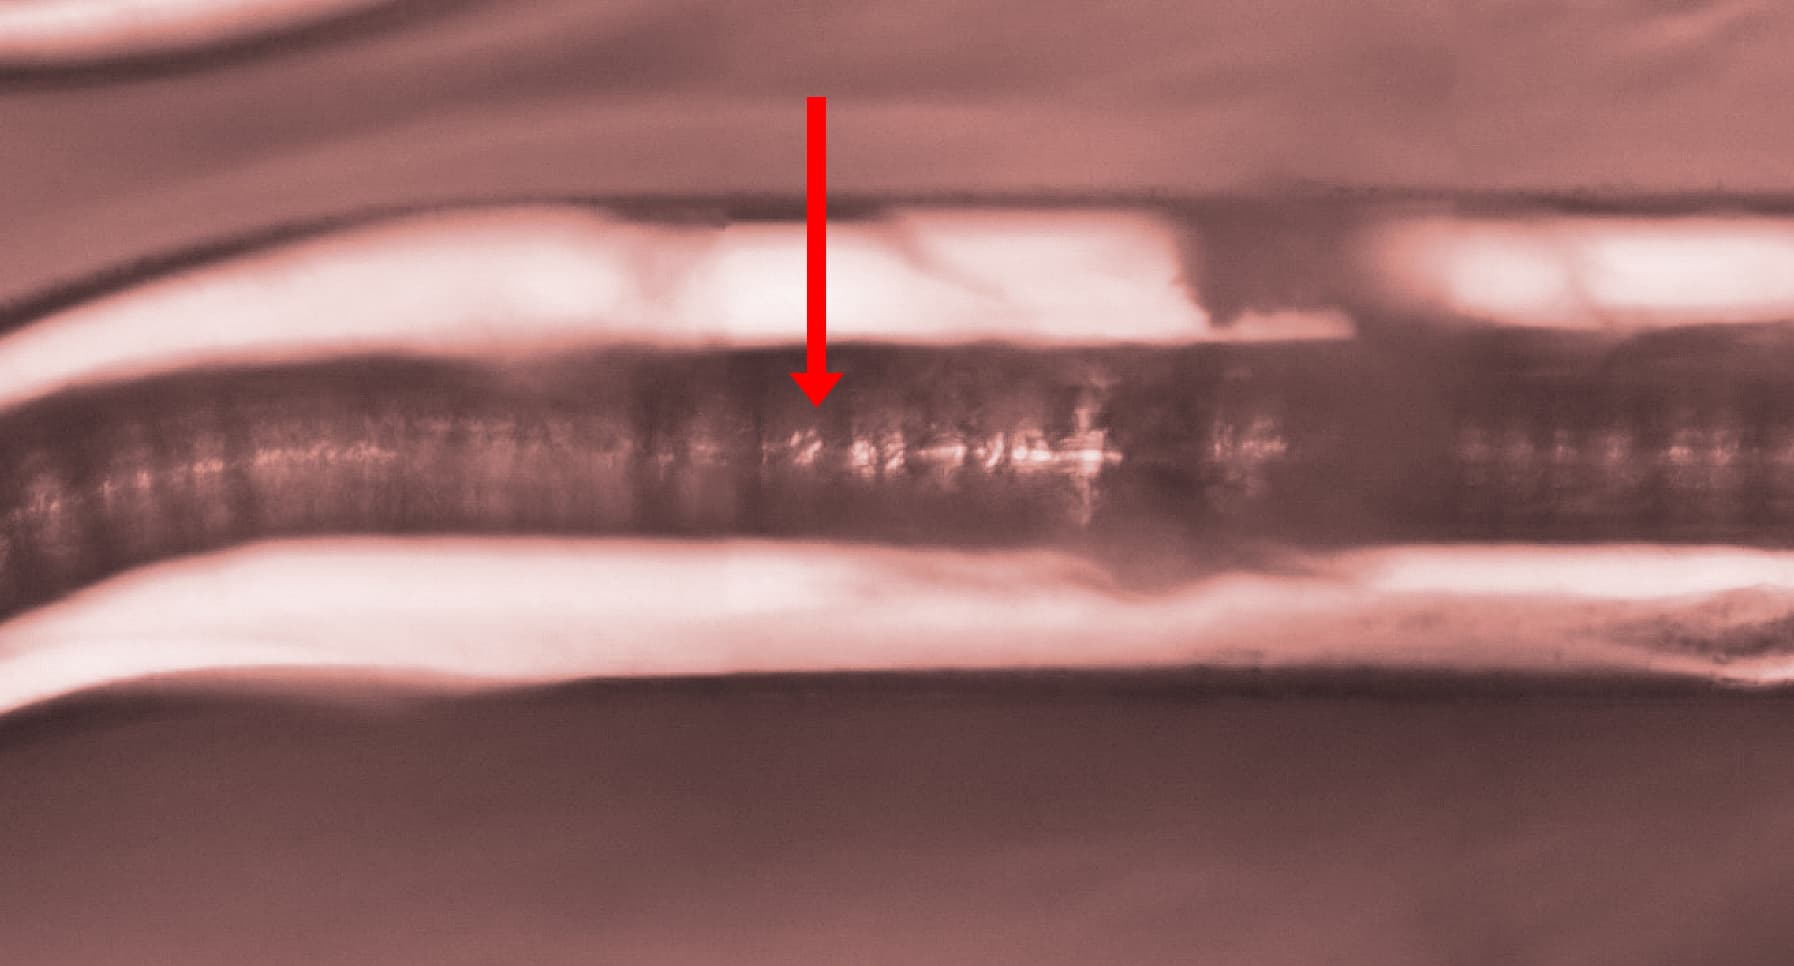
Figure 6 shows microscope images of the wear tracks produced on the sand paper by the four ball bearings. It is evident that the WC ball produced the most severe wear track (removing almost all sand particle in its path) and possesses the best wear resistance. In comparison, the Cr Steel and SS440 balls left a large amount of metal debris on the wear track of the sand paper.
These observations further demonstrate the importance of the benefit of a spiral test. It ensures that the ball bearing always slides on a new surface of the sandpaper, which significantly improves the repeatability of a wear resistance test.

Figure 6: Wear tracks on the sand paper against different ball bearings.

CONCLUSION
The wear resistance of the ball bearings under a high pressure plays a vital role in their service performance. The ceramic ball bearings possess significantly enhanced wear resistance under high stress conditions and reduce the time and cost due to bearing repairing or replacement. In this study, the WC ball bearing exhibits a substantially higher wear resistance compared to the steel bearings, making it an ideal candidate for bearing applications where severe wear takes place.
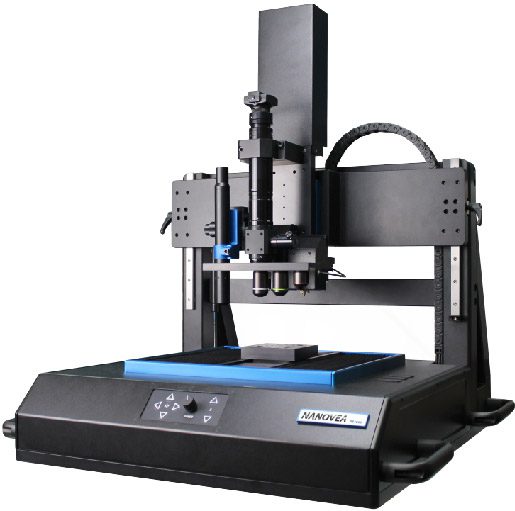
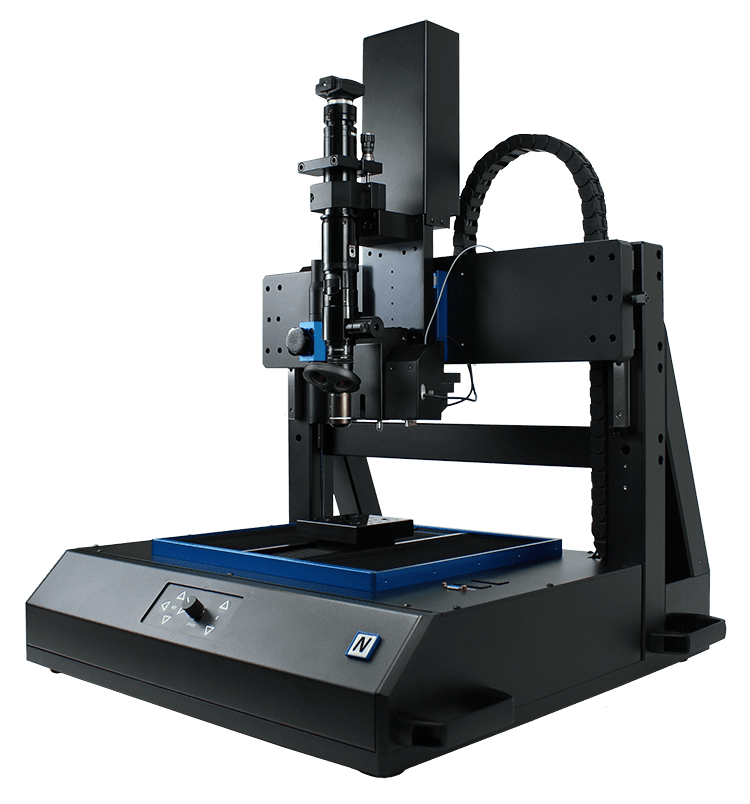
A Nanovea Tribometer is designed with high torque capabilities for loads up to 2000 N and precise and controlled motor for rotational speeds from 0.01 to 15,000 rpm. It offers repeatable wear and friction testing using ISO and ASTM compliant rotative and linear modes, with optional high temperature wear and lubrication modules available in one pre-integrated system. This unmatched range allows users to simulate different severe work environments of the ball bearings including high stress, wear and high temperature, etc. It also acts as an ideal tool to quantitatively assess the tribological behaviors of superior wear resistant materials under high loads.
A Nanovea 3D Non-Contact Profiler provides precise wear volume measurements and acts as a tool to analyze the detailed morphology of the wear tracks, providing additional insights in the fundamental understanding of wear mechanisms.
Prepared by
Duanjie Li, PhD, Jonathan Thomas, and Pierre Leroux