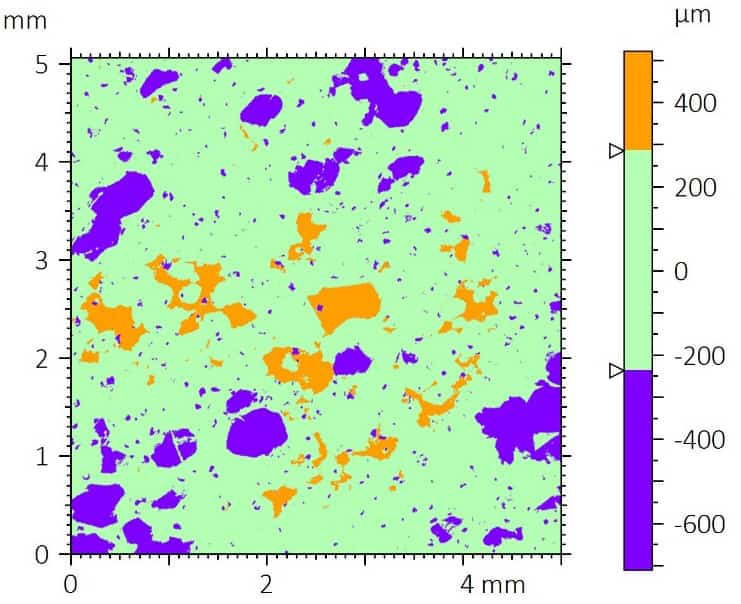
Peak-valley distribution map generated from optical profilometry data of the blue bouldering grip sample. The visualization separates valleys, mean-plane material, and peaks based on functional surface parameters derived from the Abbott-Firestone curve.
Categories
- Application Notes
- Block on Ring Tribology
- Corrosion Tribology
- Friction Testing | Coefficient of Friction
- High Temperature Mechanical Testing
- High Temperature Tribology
- Humidity and Gases Tribology
- Humidity Mechanical Testing
- Indentation | Creep and Relaxation
- Indentation | Fracture Toughness
- Indentation | Hardness and Elastic
- Indentation | Loss and Storage
- Indentation | Stress vs Strain
- Indentation | Yield Strength and Fatigue
- Laboratory Testing
- Linear Tribology
- Liquid Mechanical Testing
- Liquid Tribology
- Low Temperature Tribology
- Mechanical Testing
- Press Release
- Profilometry | Flatness and Warpage
- Profilometry | Geometry and Shape
- Profilometry | Roughness and Finish
- Profilometry | Step Height and Thickness
- Profilometry | Texture and Grain
- Profilometry | Volume and Area
- Profilometry Testing
- Ring on Ring Tribology
- Rotational Tribology
- Scratch Testing | Adhesive Failure
- Scratch Testing | Cohesive Failure
- Scratch Testing | Multi-Pass Wear
- Scratch Testing | Scratch Hardness
- Scratch Testing Tribology
- Tribology Testing
- Uncategorized
Archives
- June 2026
- May 2026
- March 2026
- November 2025
- September 2023
- August 2023
- June 2023
- May 2023
- July 2022
- May 2022
- April 2022
- January 2022
- December 2021
- November 2021
- October 2021
- September 2021
- August 2021
- July 2021
- June 2021
- May 2021
- March 2021
- February 2021
- December 2020
- November 2020
- October 2020
- September 2020
- July 2020
- May 2020
- April 2020
- March 2020
- February 2020
- January 2020
- November 2019
- October 2019
- September 2019
- August 2019
- July 2019
- June 2019
- May 2019
- April 2019
- March 2019
- January 2019
- December 2018
- November 2018
- October 2018
- September 2018
- July 2018
- June 2018
- April 2018
- March 2018
- February 2018
- November 2017
- October 2017
- September 2017
- August 2017
- June 2017
- May 2017
- March 2017
- February 2017
- January 2017
- November 2016
- October 2016
- August 2016
- July 2016
- June 2016
- May 2016
- April 2016
- March 2016
- February 2016
- January 2016
- December 2015
- November 2015
- October 2015
- September 2015
- August 2015
- July 2015
- June 2015
- May 2015
- April 2015
- March 2015
- February 2015
- January 2015
- November 2014
- October 2014
- September 2014
- August 2014
- July 2014
- June 2014
- May 2014
- April 2014
- March 2014
- February 2014
- January 2014
- December 2013
- November 2013
- October 2013
- September 2013
- August 2013
- July 2013
- June 2013
- May 2013
- April 2013
- March 2013
- February 2013
- January 2013
- December 2012
- November 2012
- October 2012
- September 2012
- August 2012
- July 2012
- June 2012
- May 2012
- April 2012
- March 2012
- February 2012
- January 2012
- December 2011
- November 2011
- October 2011
- September 2011
- August 2011
- July 2011
- June 2011
- May 2011
- November 2010
- January 2010
- April 2009
- March 2009
- January 2009
- December 2008
- October 2008
- August 2007
- July 2006
- March 2006
- January 2005
- April 2004


