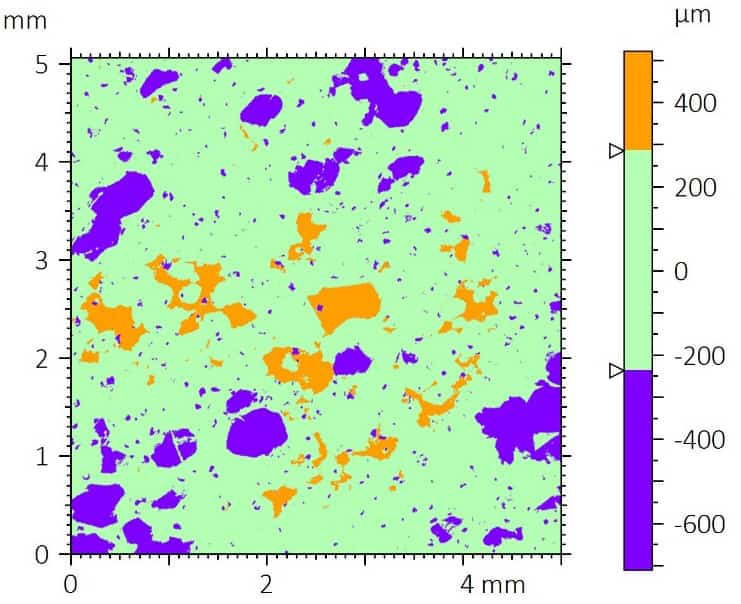
Peak-valley distribution map generated from optical profilometry data of the blue bouldering grip sample. The visualization separates valleys, mean-plane material, and peaks based on functional surface parameters derived from the Abbott-Firestone curve.
分类
- 应用说明
- 环形摩擦学座谈会
- 腐蚀摩擦学
- 摩擦测试|摩擦系数
- 高温机械测试
- 高温摩擦学
- 湿度和气体 摩擦学
- 湿度的机械测试
- 压痕|蠕变和松弛
- 压痕|断裂韧性
- 压痕 | 硬度和弹性
- 压痕|损失和储存
- 压痕 | 应力与应变
- 压痕|屈服强度和疲劳
- 实验室测试
- 线性摩擦学
- 液体机械测试
- 液体摩擦学
- 低温摩擦学
- 机械测试
- 新闻发布
- 轮廓测量 - 平面度和翘曲度
- 轮廓测量法 | 几何和形状
- 轮廓测量 - 粗糙度和光洁度
- 轮廓测量法|台阶高度和厚度
- 轮廓测量法 | 纹理和颗粒
- 轮廓测量法|体积和面积
- 轮廓仪测试
- 环对环摩擦学
- 旋转摩擦学
- 刮擦测试|胶粘剂失效
- 刮擦测试 | 粘着性失效
- 刮擦测试 | 多次磨损
- 划痕测试|划痕硬度
- 划痕测试 摩擦学
- 摩擦学测试
- 未分类
归档
- 2026年6 月
- 2026年5 月
- 2026年3 月
- 2025年11 月
- 2023年9 月
- 2023年8 月
- 2023年6 月
- 2023年5 月
- 2022年7 月
- 2022年5 月
- 2022年4 月
- 2022年1 月
- 2021年12 月
- 2021年11 月
- 2021年10 月
- 2021年9 月
- 2021年8 月
- 2021年7 月
- 2021年6 月
- 2021年5 月
- 2021年3 月
- 2021年2 月
- 2020年12 月
- 2020年11 月
- 2020年10 月
- 2020年9 月
- 2020年7 月
- 2020年5 月
- 2020年4 月
- 2020年3 月
- 2020年2 月
- 2020年1 月
- 2019年11 月
- 2019年10 月
- 2019年9 月
- 2019年8 月
- 2019年7 月
- 2019年6 月
- 2019年5 月
- 2019年4 月
- 2019年3 月
- 2019年1 月
- 2018年12 月
- 2018年11 月
- 2018年10 月
- 2018年9 月
- 2018年7 月
- 2018年6 月
- 2018年4 月
- 2018年3 月
- 2018年2 月
- 2017年11 月
- 2017年10 月
- 2017年9 月
- 2017年8 月
- 2017年6 月
- 2017年5 月
- 2017年3 月
- 2017年2 月
- 2017年1 月
- 2016年11 月
- 2016年10 月
- 2016年8 月
- 2016年7 月
- 2016年6 月
- 2016年5 月
- 2016年4 月
- 2016年3 月
- 2016年2 月
- 2016年1 月
- 2015年12 月
- 2015年11 月
- 2015年10 月
- 2015年9 月
- 2015年8 月
- 2015年7 月
- 2015年6 月
- 2015年5 月
- 2015年4 月
- 2015年3 月
- 2015年2 月
- 2015年1 月
- 2014年11 月
- 2014年10 月
- 2014年9 月
- 2014年8 月
- 2014年7 月
- 2014年6 月
- 2014年5 月
- 2014年4 月
- 2014年3 月
- 2014年2 月
- 2014年1 月
- 2013年12 月
- 2013年11 月
- 2013年10 月
- 2013年9 月
- 2013年8 月
- 2013年7 月
- 2013年6 月
- 2013年5 月
- 2013年4 月
- 2013年3 月
- 2013年2 月
- 2013年1 月
- 2012年12 月
- 2012年11 月
- 2012年10 月
- 2012年9 月
- 2012年8 月
- 2012年7 月
- 2012年6 月
- 2012年5 月
- 2012年4 月
- 2012年3 月
- 2012年2 月
- 2012年1 月
- 2011年12 月
- 2011年11 月
- 2011年10 月
- 2011年9 月
- 2011年8 月
- 2011年7 月
- 2011年6 月
- 2011年5 月
- 2010年11 月
- 2010年1 月
- 2009年4 月
- 2009年3 月
- 2009年1 月
- 2008年12 月
- 2008年10 月
- 2007年8 月
- 2006年7 月
- 2006年3 月
- 2005年1 月
- 2004年4 月


