USA/GLOBAL: +1-949-461-9292
EUROPE: +39-011-3052-794
CONTACT US

Sandpaper Abrasion Performance Using a Tribometer

SANDPAPER ABRASION PERFORMANCE

USING A TRIBOMETER

Prepared by

DUANJIE LI, PhD

INTRODUCTION

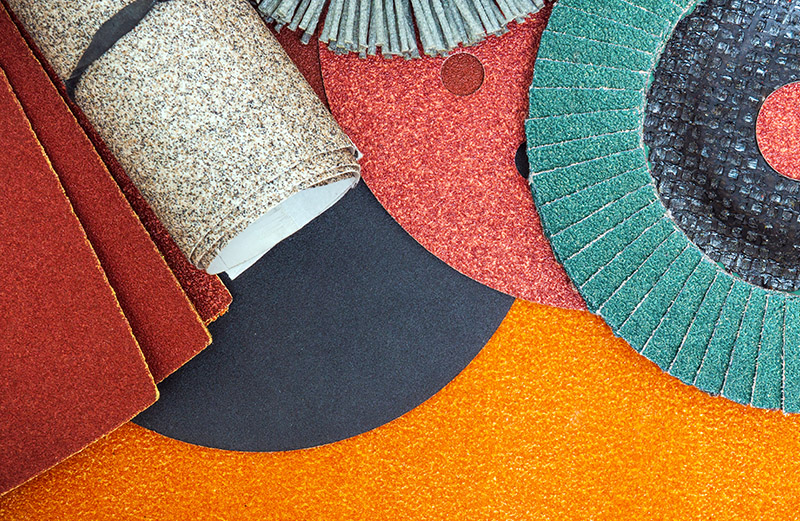
Sandpaper consists of abrasive particles glued to one face of a paper or cloth. Various abrasive materials can be used for the particles, such as garnet, silicon carbide, aluminum oxide and diamond. Sandpaper is widely applied in a variety of industrial sectors to create specific surface finishes on wood, metal and drywall. They often work under high pressure contact applied by hand or power tools.

IMPORTANCE OF EVALUATING SANDPAPER ABRASION PERFORMANCE

The effectiveness of sandpaper is often determined by its abrasion performance under different conditions. The grit size, i.e. the size of the abrasive particles embedded in the sandpaper, determines the wear rate and the scratch size of the material being sanded. Sandpapers of higher grit numbers have smaller particles, resulting in lower sanding speeds and finer surface finishes. Sandpapers with the same grit number but made of different materials can have unalike behaviors under dry or wet conditions. Reliable tribological evaluations are needed to ensure that manufactured sandpaper possesses the desired abrasive behavior intended. These evaluations allow users to quantitatively compare the wear behaviors of different types of sandpapers in a controlled and monitored manner in order to select the best candidate for the target application.
MEASUREMENT OBJECTIVE

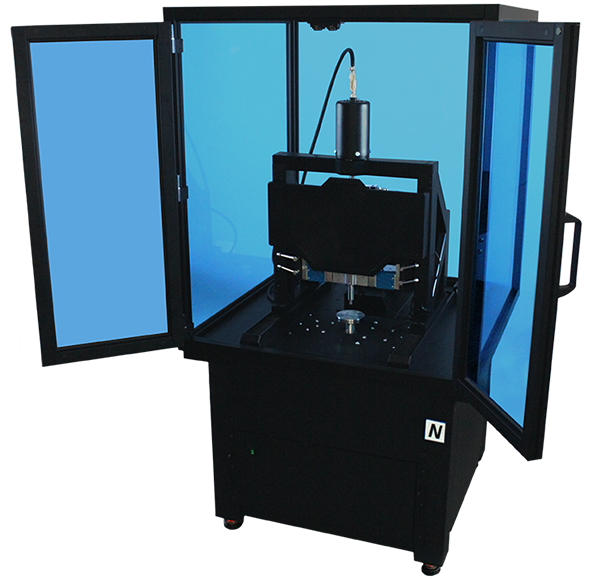
In this study, we showcase the NANOVEA Tribometer’s ability to quantitatively evaluate the abrasion performance of various sandpaper samples under dry and wet conditions.

NANOVEA

T2000

TEST PROCEDURES

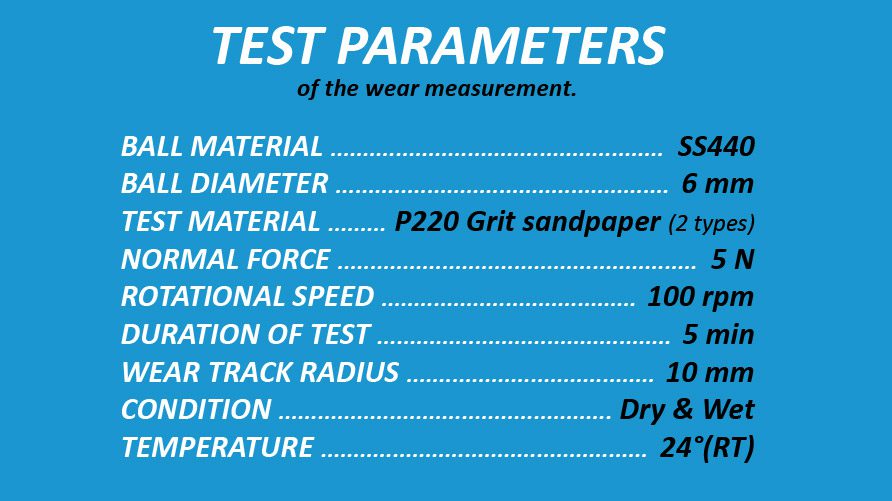
The coefficient of friction (COF) and the abrasion performance of two types of sandpapers were evaluated by the NANOVEA T100 Tribometer. A 440 stainless steel ball was used as the counter material. The ball wear scars were examined after each wear test using the NANOVEA 3D Non-Contact Optical Profiler to ensure precise volume loss measurements.

Please note that a 440 stainless steel ball was chosen as the counter material to create a comparative study but any solid material could be substituted to simulate a different application condition.

TEST RESULTS & DISCUSSION

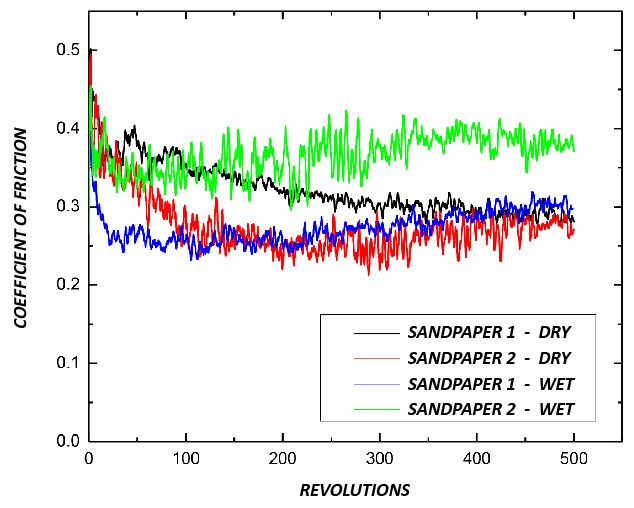
FIGURE 1 shows a COF comparison of Sandpaper 1 and 2 under dry and wet environmental conditions. Sandpaper 1, under dry conditions, shows a COF of 0.4 at the beginning of the test which progressively decreases and stabilizes to 0.3. Under wet conditions, this sample exhibits a lower average COF of 0.27. In contrast, Sample 2’s COF results show a dry COF of 0.27 and wet COF of ~ 0.37. 

Please note the oscillation in the data for all COF plots was caused by the vibrations generated by the sliding movement of the ball against the rough sandpaper surfaces.

FIGURE 1: Evolution of COF during the wear tests.

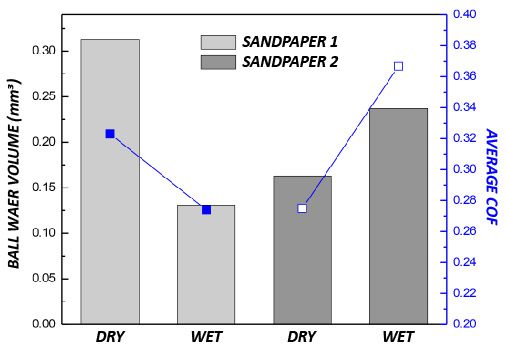
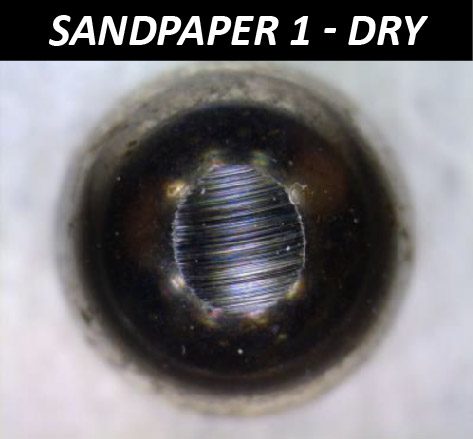
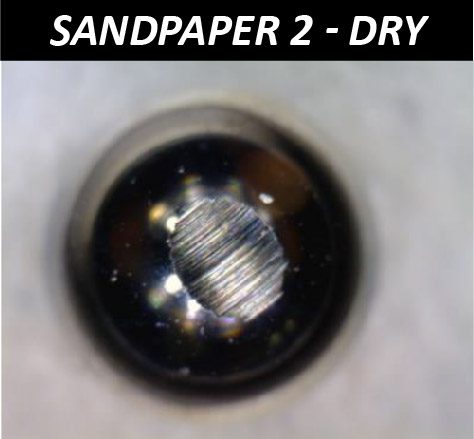
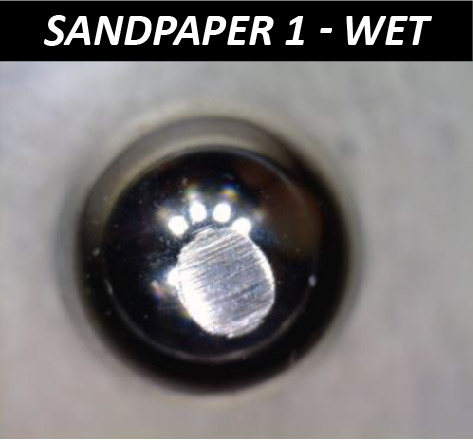
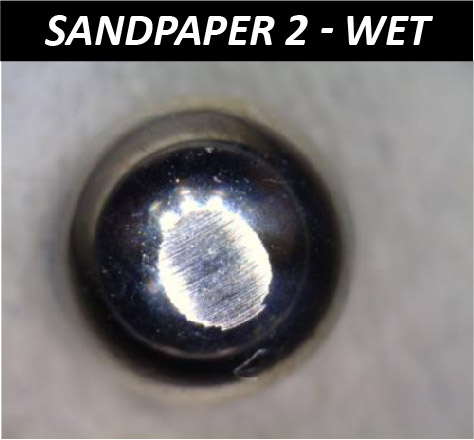
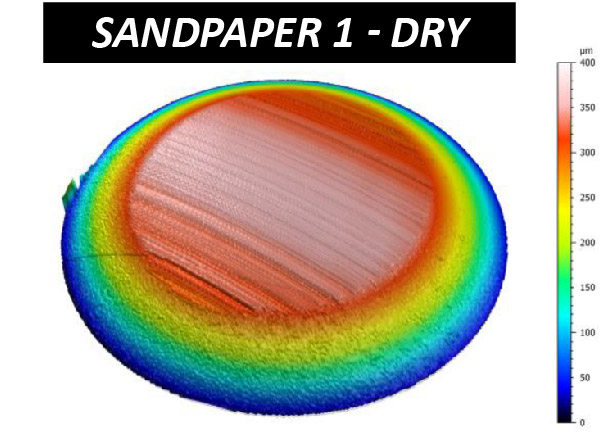
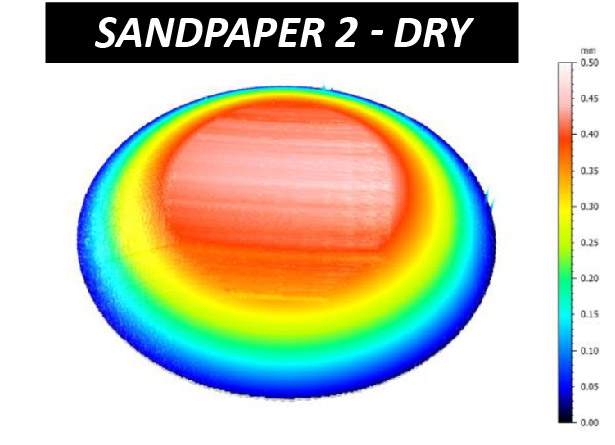
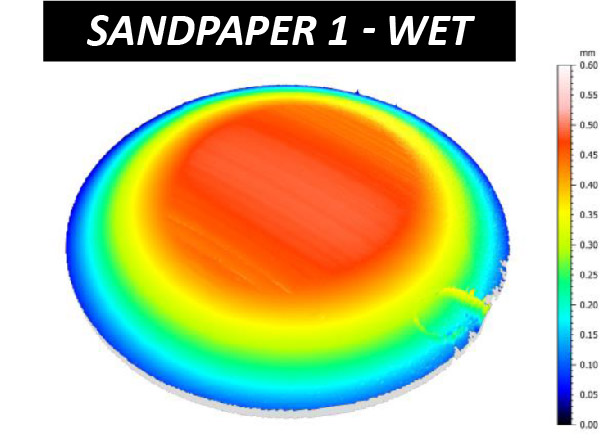
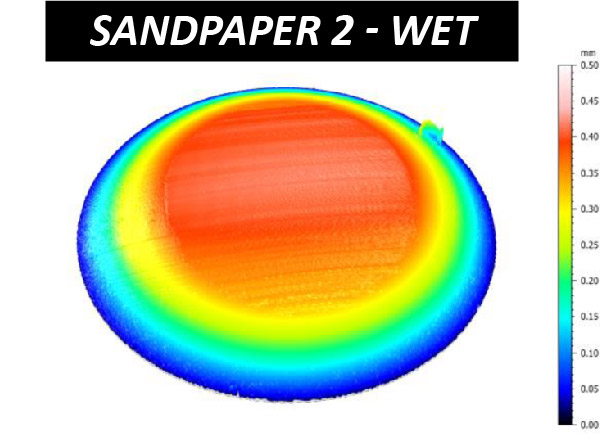
FIGURE 2 summarizes the results of the wear scar analysis. The wear scars were measured using an optical microscope and a NANOVEA 3D Non-Contact Optical Profiler. FIGURE 3 and FIGURE 4 compare the wear scars of the worn SS440 balls post wear tests on Sandpaper 1 and 2 (wet and dry conditions). As shown in FIGURE 4 the NANOVEA Optical Profiler precisely captures the surface topography of the four balls and their respective wear tracks which were then processed with the NANOVEA Mountains Advanced Analysis software to calculate volume loss and wear rate. On the microscope and profile image of the ball it can be observed that the ball used for Sandpaper 1 (dry) testing exhibited a larger flattened wear scar compared to the others with a volume loss of 0.313 mm3. In contrast, the volume loss for Sandpaper 1 (wet) was 0.131 mm3. For Sandpaper 2 (dry) the volume loss was 0.163 mm3 and for Sandpaper 2 (wet) the volume loss increased to 0.237 mm3.

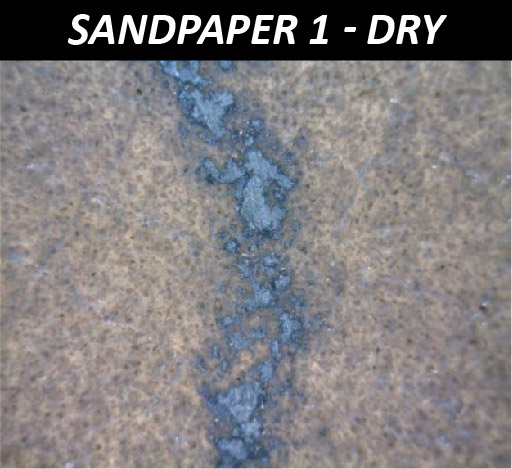
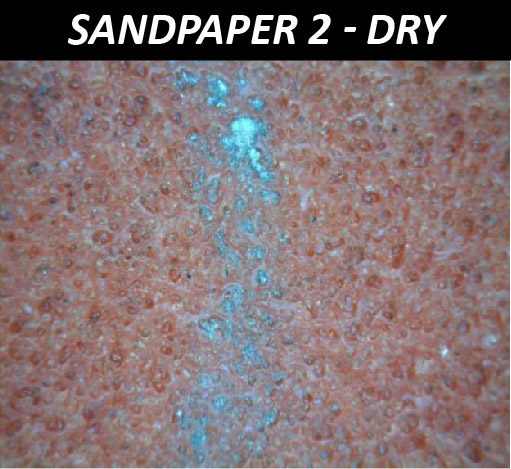
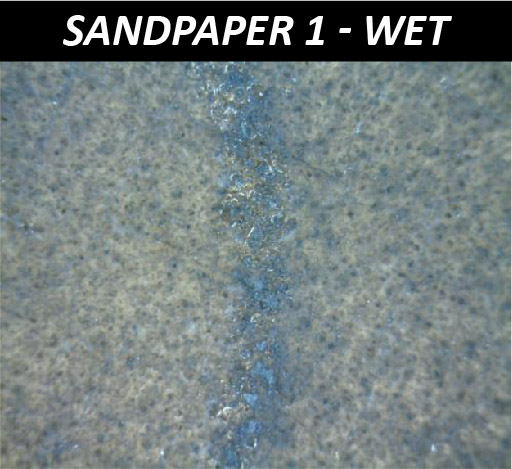
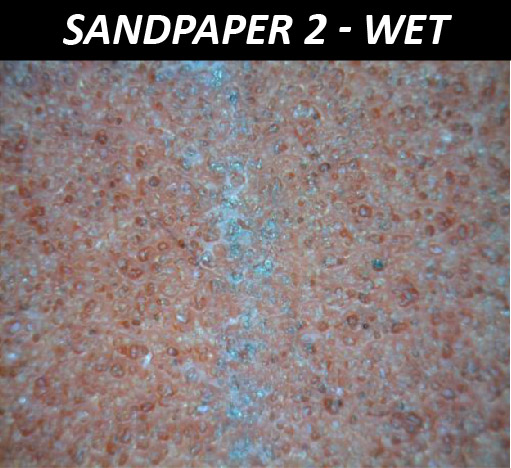
Moreover, it is interesting to observe that the COF played an important role in the abrasion performance of the sandpapers. Sandpaper 1 exhibited higher COF in the dry condition, leading to a higher abrasion rate for the SS440 ball used in the test. In comparison, the higher COF of Sandpaper 2 in the wet condition resulted in a higher abrasion rate. The wear tracks of the sandpapers after the measurements are displayed in FIGURE 5.

Both Sandpapers 1 and 2 claim to work in either dry and wet environments. However, they exhibited significantly different abrasion performance in the dry and wet conditions. NANOVEA tribometers provide well-controlled quantifiable and reliable wear assessment capabilities that ensure reproducible wear evaluations. Moreover, the capacity of in situ COF measurement allows users to correlate different stages of a wear process with the evolution of COF, which is critical in improving fundamental understanding of the wear mechanism and tribological characteristics of sandpaper

FIGURE 2: Wear scar volume of the balls and average COF under different conditions.

FIGURE 3: Wear scars of the balls after the tests.

FIGURE 4: 3D morphology of the wear scars on the balls.

FIGURE 5: Wear tracks on the sandpapers under different conditions.

CONCLUSION

The abrasion performance of two types of sandpapers of the same grit number were evaluated under dry and wet conditions in this study. The service conditions of the sandpaper play a critical role in the effectiveness of the work performance. Sandpaper 1 possessed significantly better abrasion behavior under dry conditions, while Sandpaper 2 performed better under wet conditions. The friction during the sanding process is an important factor to consider when evaluating abrasion performance. The NANOVEA Optical Profiler precisely measures the 3D morphology of any surface, such as wear scars on a ball, ensuring reliable evaluation on the abrasion performance of the sandpaper in this study. The NANOVEA Tribometer measures the coefficient of friction in situ during a wear test, providing an insight on the different stages of a wear process. It also offers repeatable wear and friction testing using ISO and ASTM compliant rotative and linear modes, with optional high temperature wear and lubrication modules available in one pre-integrated system. This unmatched range allows users to simulate different severe work environment of the ball bearings including high stress, wear and high temperature, etc. It also provides an ideal tool to quantitatively assess the tribological behaviors of superior wear resistant materials under high loads.

NOW, LET'S TALK ABOUT YOUR APPLICATION

Comment