Monthly Archives: September 2019
Surface Roughness and Features of a Solar Cell
Importance of Solar Panel Testing
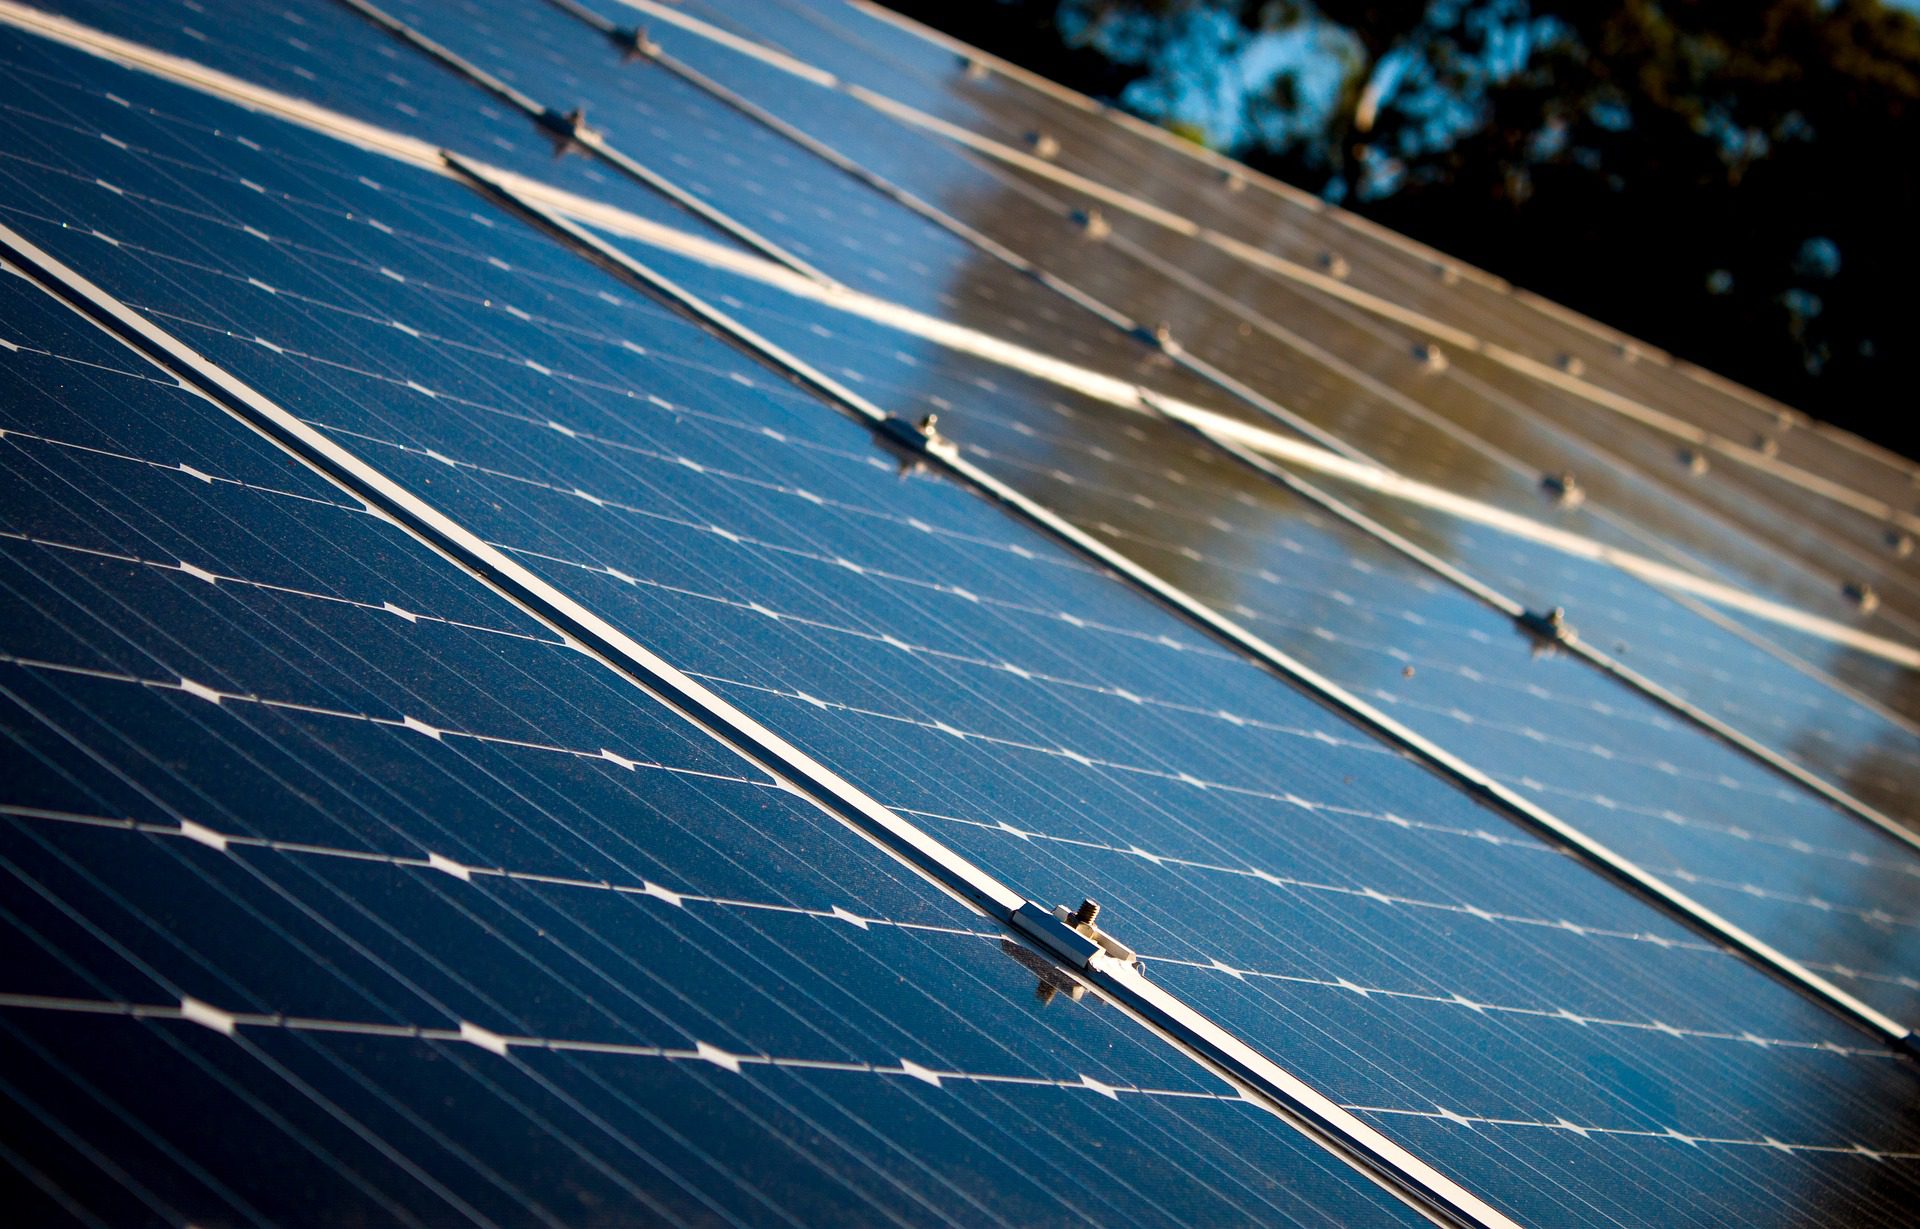
Maximizing a solar cell’s energy absorption is key for the technology’s survival as a renewable resource. The multiple layers of coating and glass protection allow for the absorption, transmittance, and reflection of light that is necessary for the photovoltaic cells to function. Given that most consumer solar cells operate at 15-18% efficiency, optimizing their energy output is an ongoing battle.
Studies have shown that surface roughness plays a pivotal role in the reflectance of light. The initial layer of glass must be as smooth as possible to mitigate the reflectance of light, but the subsequent layers do not follow this guideline. A degree of roughness is necessary at each coatings interface to another to increase the possibility of light scattering within their respective depletion zones and increase the absorption of light within the cell1. Optimizing the surface roughness in these regions allows the solar cell to operate to the best of its ability and with the Nanovea HS2000 High Speed Sensor, measuring surface roughness can be done quickly and accurately.
Measurement Objective
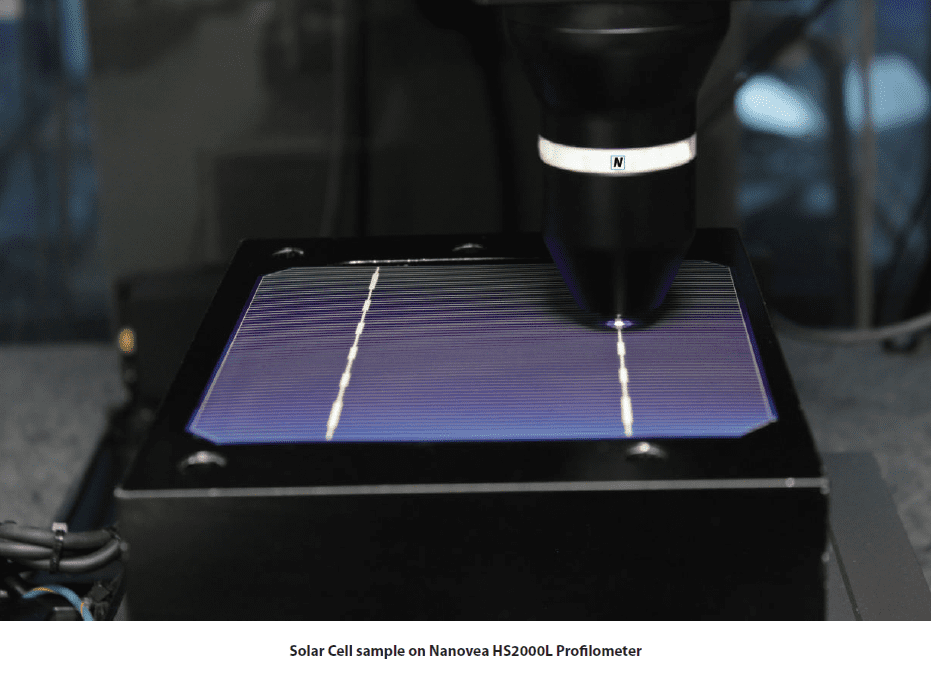
In this study we will display the capabilities of the Nanovea Profilometer HS2000 with High Speed Sensor by measuring the surface roughness and geometric features of a photovoltaic cell. For this demonstration a monocrystalline solar cell with no glass protection will be measured but the methodology can be used for various other applications.
Test Procedure and Procedures
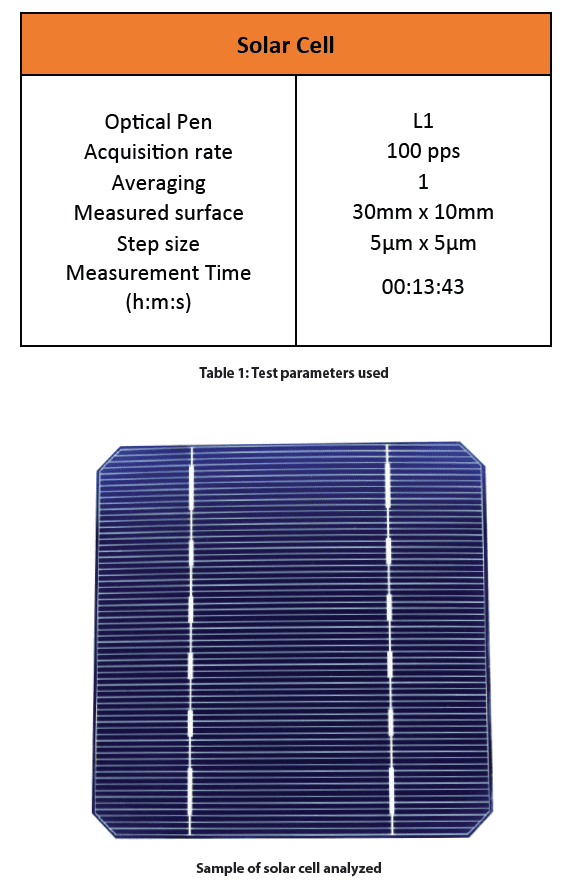
The following test parameters were used to measure the surface of the solar cell.
Results and Discussion
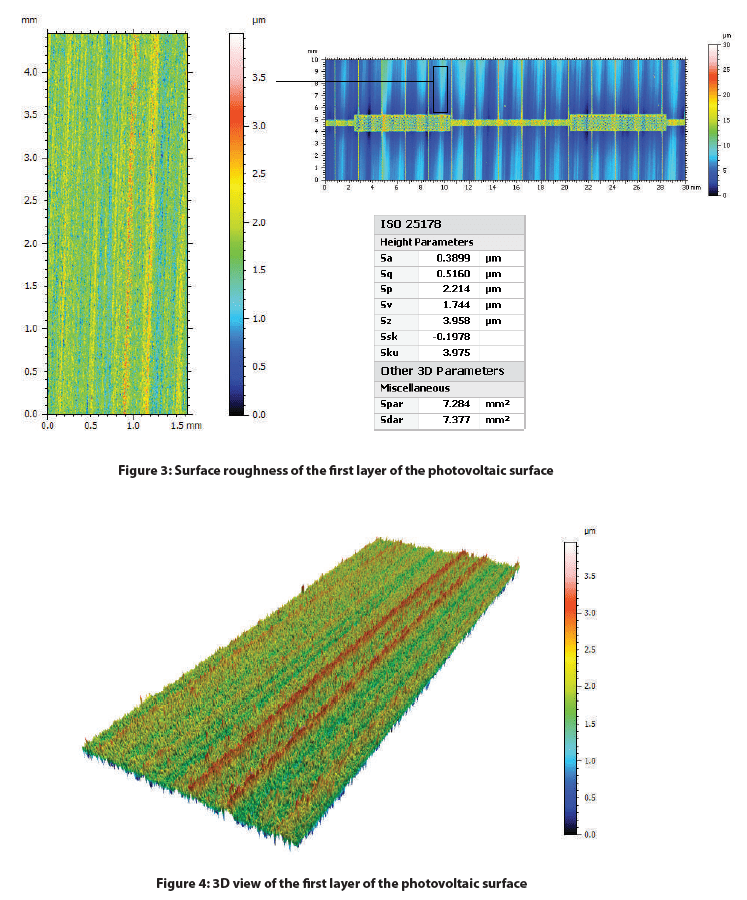
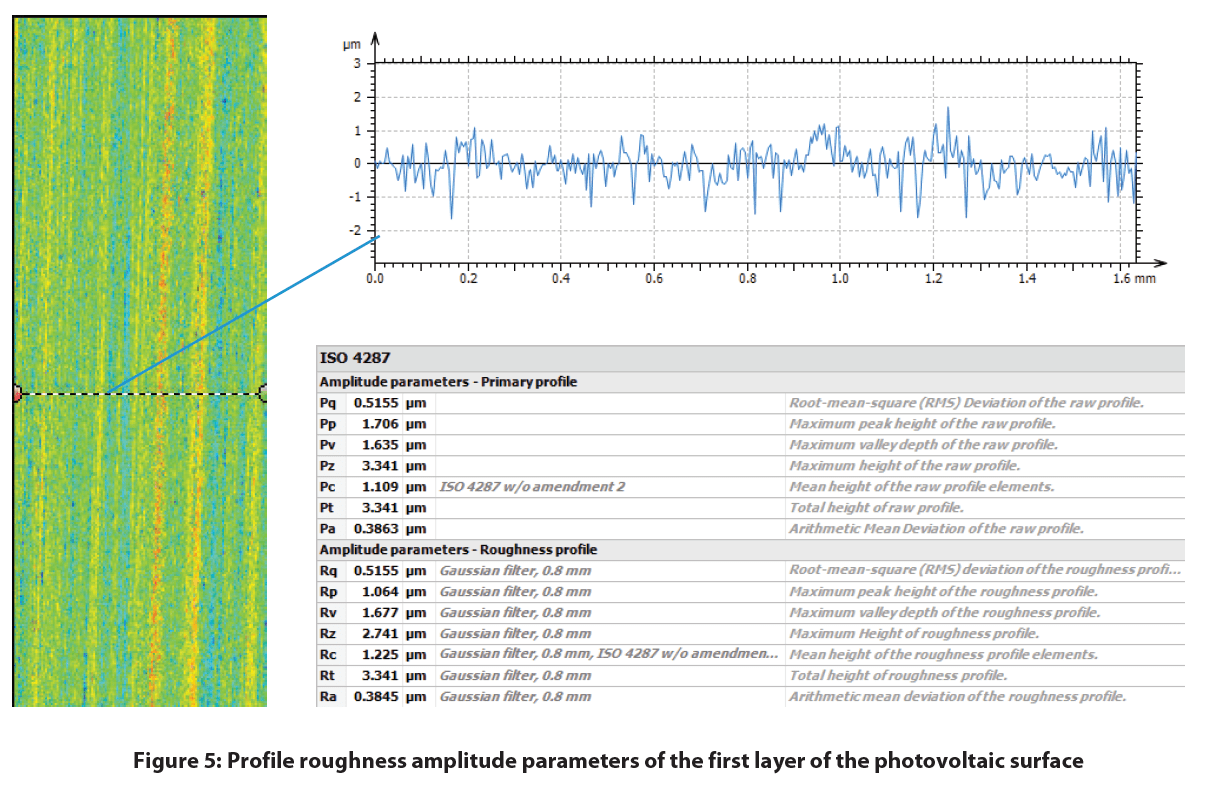
Depicted below is the 2D false-color view of the solar cell and an area extraction of the surface with its respective height parameters. A Gaussian filter was applied to both surfaces and a more aggressive index was used to flatten the extracted area. This excludes form (or waviness) larger than the cut-off index, leaving behind features that represent the solar cell’s roughness.
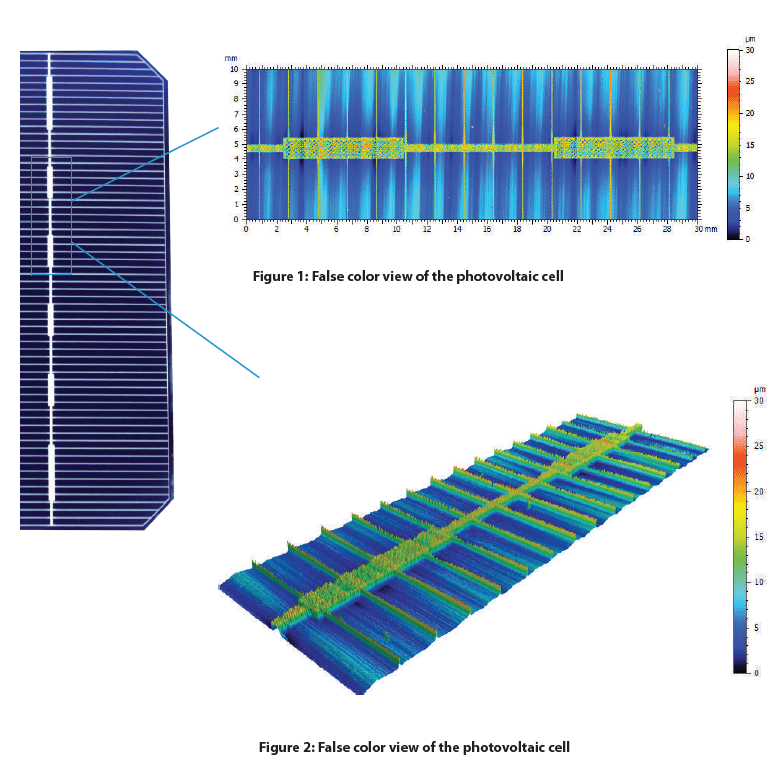
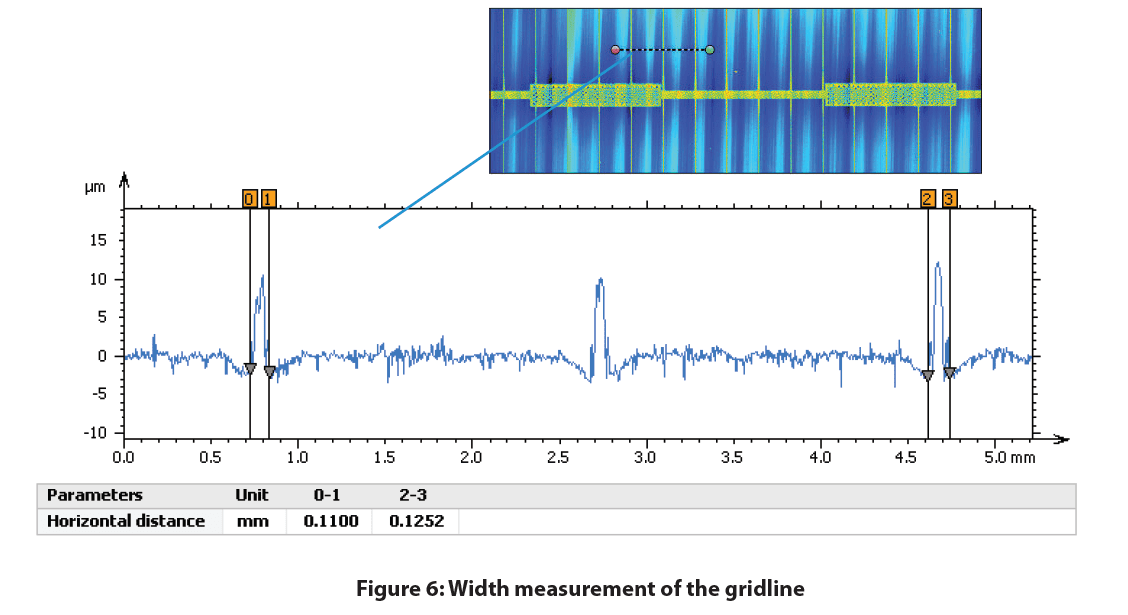
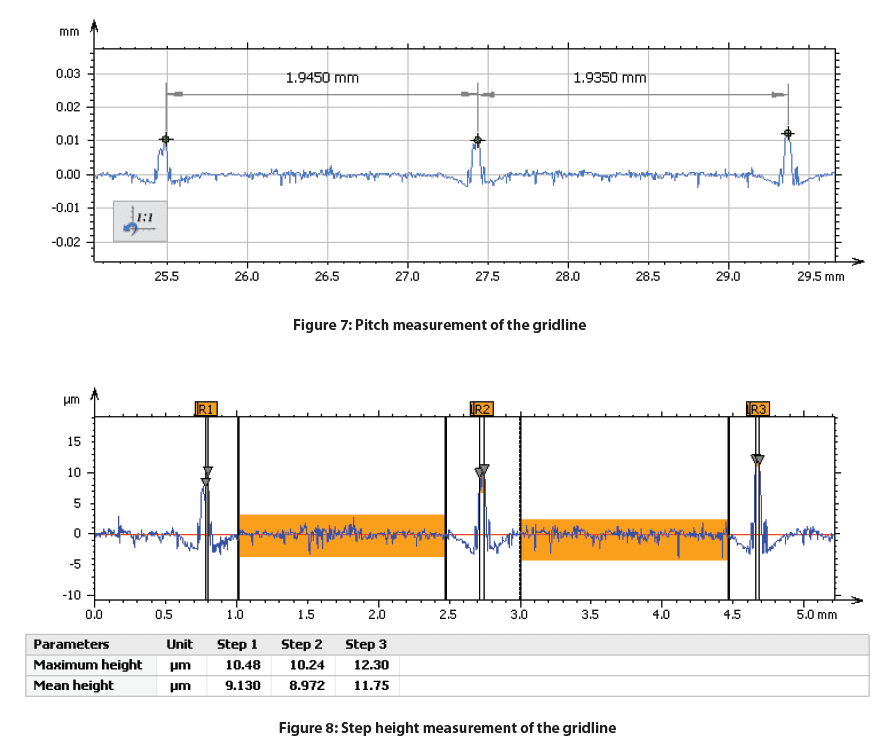
A profile was taken perpendicular to the orientation of the gridlines to measure their geometric characteristics which is shown below. The gridline width, step height, and pitch can be measured for any specific location on the solar cell.
Conclusion

In this study we were able to display the Nanovea HS2000 Line Sensor’s ability to measure a monocrystalline photovoltaic cell’s surface roughness and features. With the ability to automate accurate measurements of multiple samples and set pass fail limits, the Nanovea HS2000 Line Sensor is a perfect choice for quality control inspections.
Reference
1 Scholtz, Lubomir. Ladanyi, Libor. Mullerova, Jarmila. “Influence of Surface Roughness on Optical Characteristics of Multilayer Solar Cells “ Advances in Electrical and Electronic Engineering, vol. 12, no. 6, 2014, pp. 631-638.
Lubricating Eye Drop Comparison using the Nanovea T50 Tribometer
Importance of Testing Eye Drop Solutions
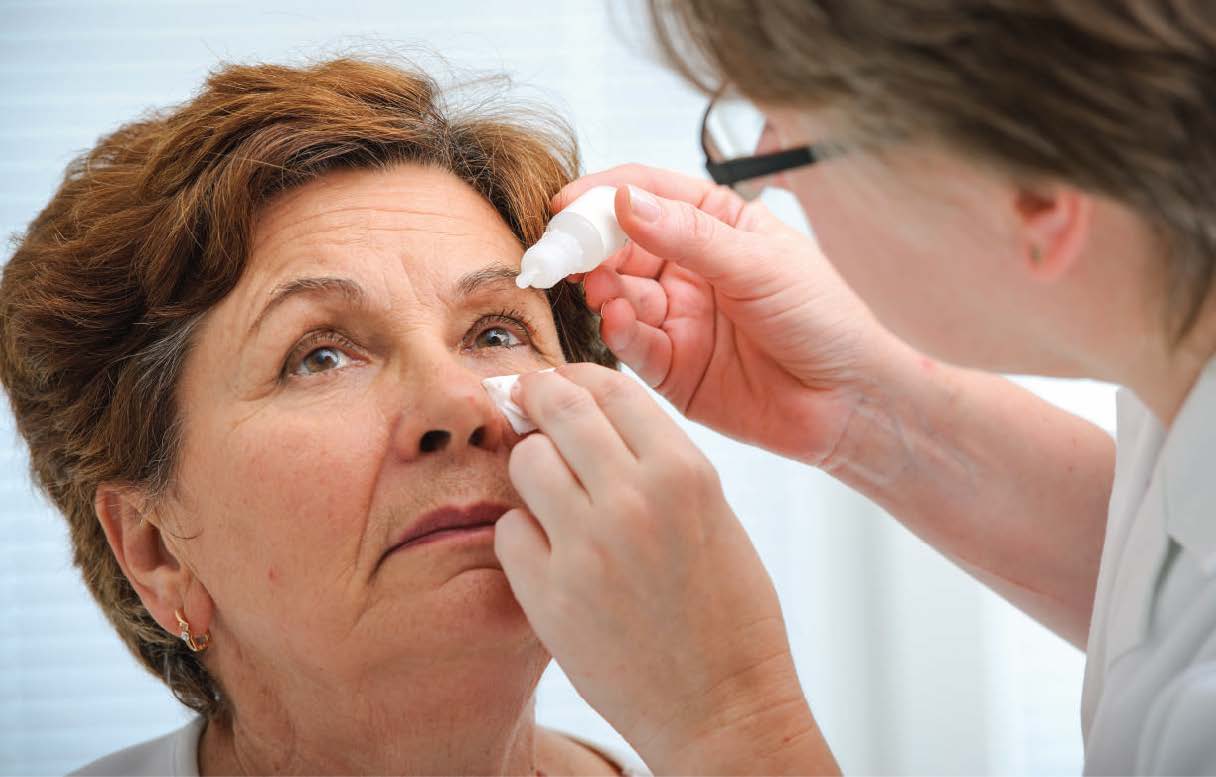
Eye drop solutions are used to alleviate symptoms caused by a range of eye problems. For example, they can be used to treat minor eye irritation (e.g. dryness and redness), delay the onset of glaucoma or treat infections. Eye drop solutions sold over-the-counter are mainly used to treat dryness. Their effectiveness in lubricating the eye can be compared and measured with a coefficient of friction test.
Dry eyes can be caused by a wide range of factors, for example, computer eye strain or being outdoors in extreme weather conditions. Good lubricating eye drops help maintain and supplement the moisture on the outer surface of the eyes. This works to alleviate the discomfort, burning or irritation and redness associated with dry eyes. By measuring the coefficient of friction (COF) of an eye drop solution, its lubricating efficiency and how it compares to other solutions can be determined.
Measurement Objective
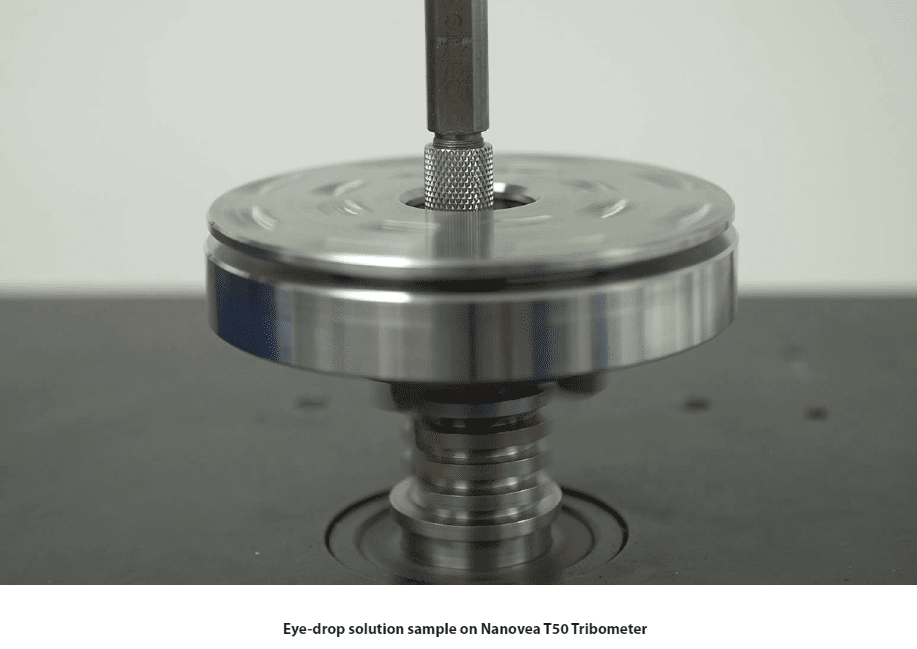
In this study, the coefficient of friction (COF) of three different lubricating eye drop solutions was measured using the pin-on-disk setup on the Nanovea T50 Tribometer.
Test Procedure and Procedures
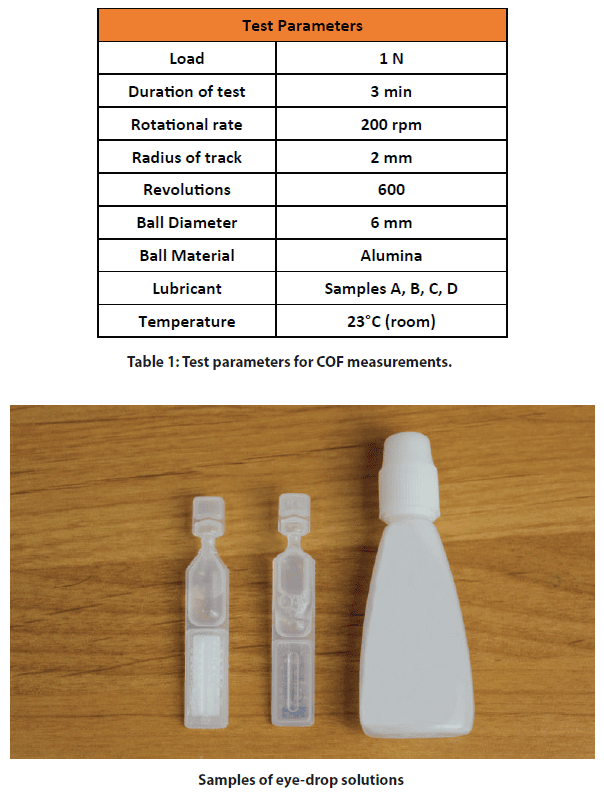
A 6mm diameter spherical pin made of alumina was applied to a glass slide with each eye drop solution acting as the lubricant between the two surfaces. The test parameters used for all experiments are summarized in Table 1 below.
Results and Discussion
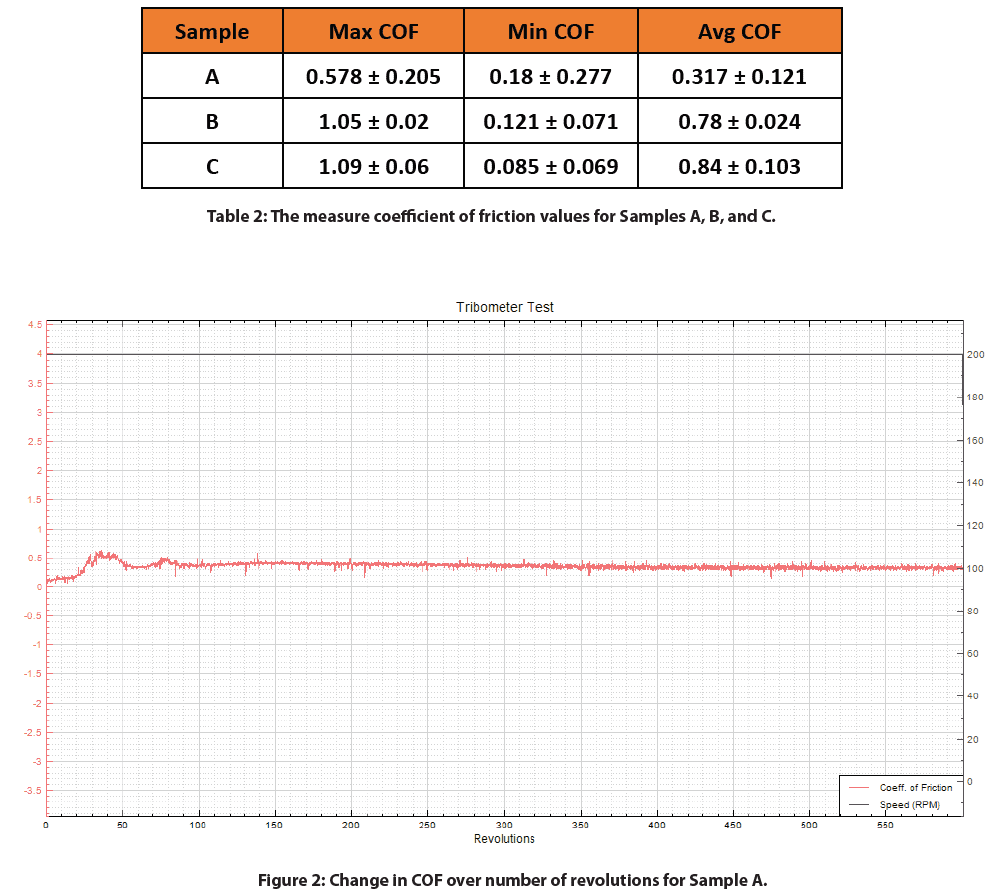
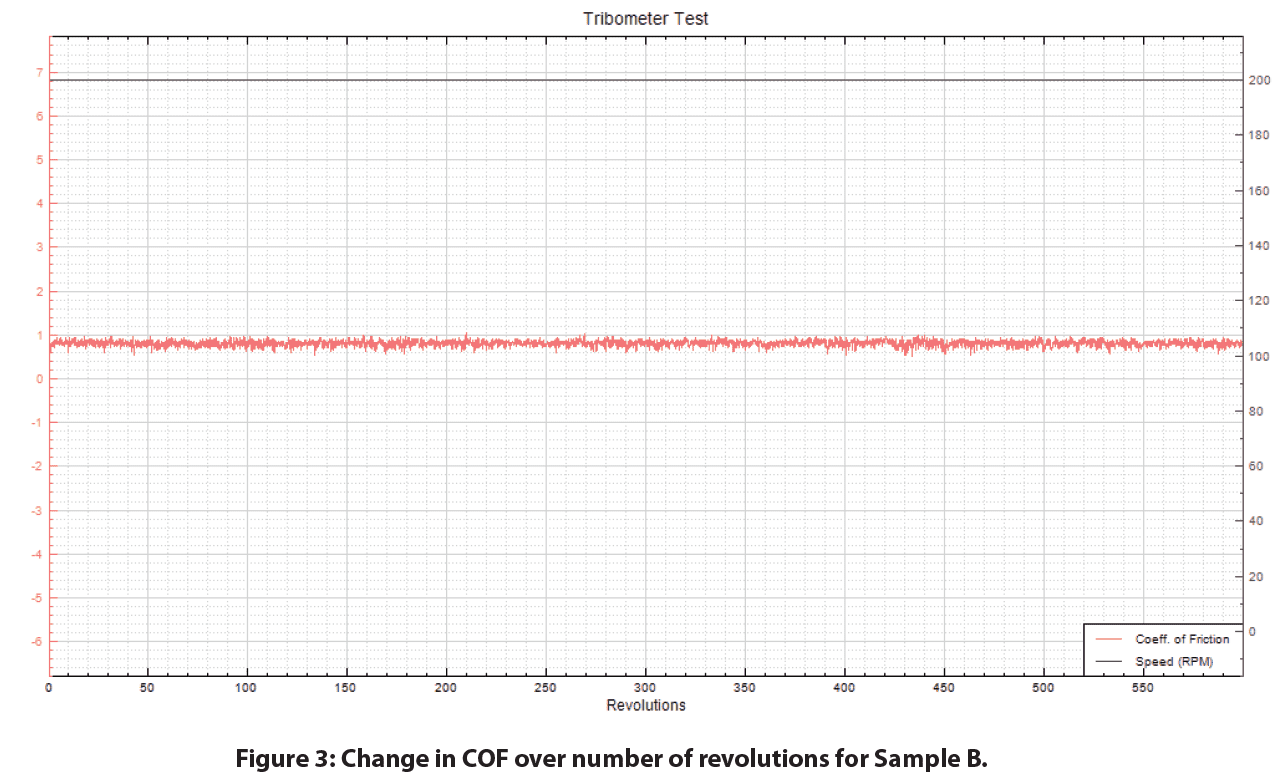
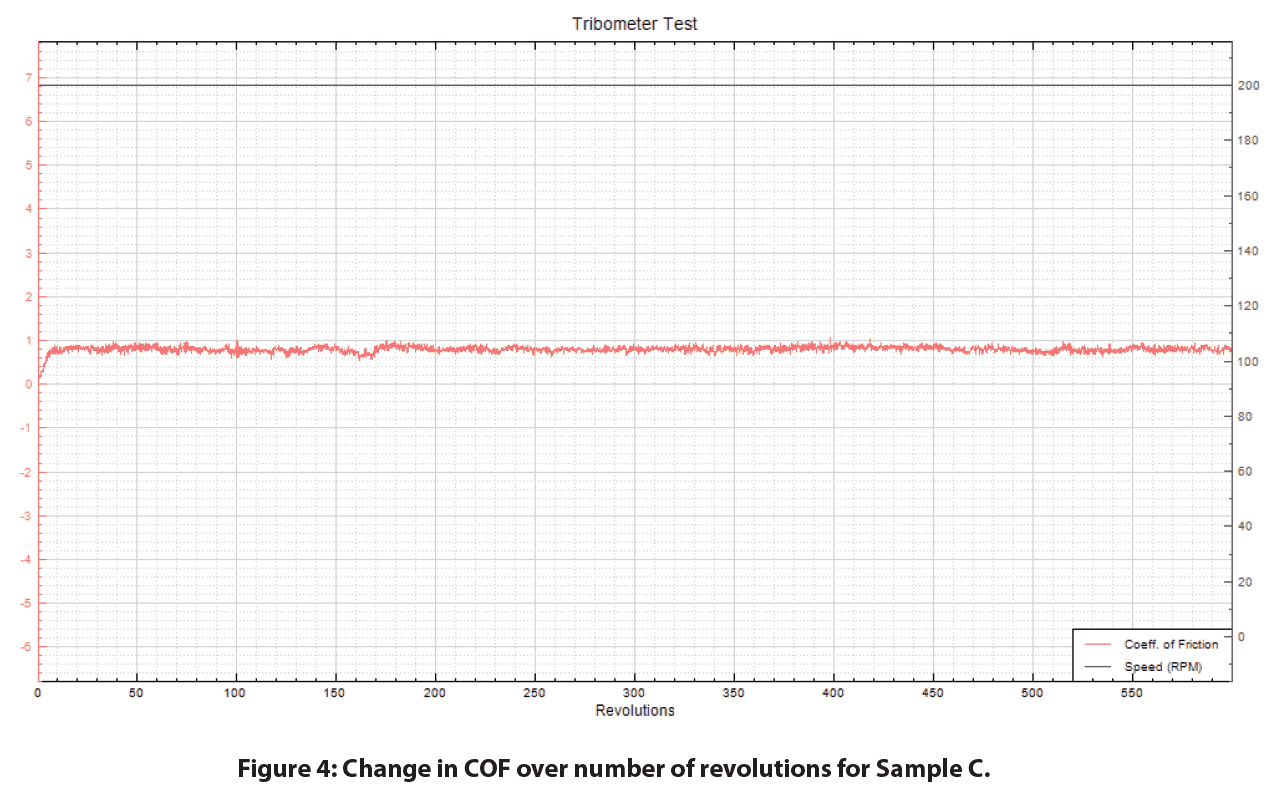
The maximum, minimum, and average coefficient of friction values for the three different eye drop solutions tested are tabulated in Table 2 below. The COF v. Revolutions graphs for each eye drop solution are depicted in Figures 2-4. The COF during each test remained relatively constant for most of the total test duration. Sample A had the lowest average COF indicating it had the best lubrication properties.
Conclusion
In this study we showcase the capability of the Nanovea T50 Tribometer in measuring the coefficient of friction of three eye drop solutions. Based on these values, we show that Sample A had a lower coefficient of friction and therefore exhibits better lubrication in comparison to the other two samples.
Nanovea Tribometers offers precise and repeatable wear and friction testing using ISO and ASTM compliant rotative and linear modules. It also provides optional high temperature wear, lubrication, and tribo-corrosion modules available in one pre-integrated system. Such versatility allows users to better simulate the real application environment and improve fundamental understanding of the wear mechanism and tribological characteristics of various materials.


