USA/GLOBAL: +1-949-461-9292
EUROPE: +39-011-3052-794
CONTACT US

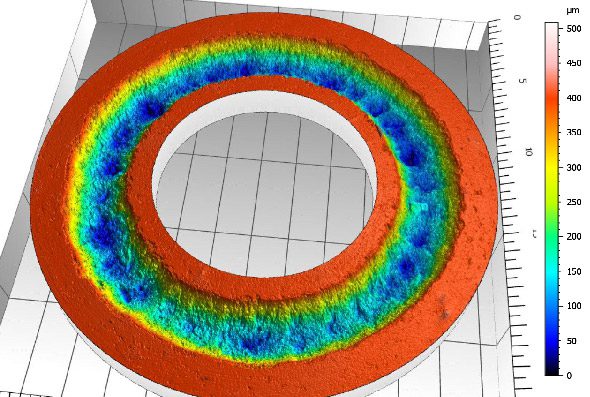
Progressive Wear Mapping of Flooring using Tribometer

Progressive Wear Mapping of Flooring

Using Tribometer with integrated Profilometer

Prepared by

FRANK LIU

INTRODUCTION

Flooring materials are designed to be durable, but they often suffer wear and tear from everyday activities such as movement and furniture use. To ensure their longevity, most types of flooring have a protective wear layer that resists damage. However, the thickness and durability of the wear layer vary depending on the flooring type and level of foot traffic. In addition, different layers within the flooring structure, such as UV coatings, decorative layers, and glaze, have varying wear rates. That’s where progressive wear mapping comes in. Using the NANOVEA T2000 Tribometer with an integrated 3D Non-Contact Profilometer, precise monitoring, and analysis of the performance and longevity of flooring materials can be done. By providing detailed insight into the wear behavior of various flooring materials, scientists and technical professionals can make more informed decisions when selecting and designing new flooring systems.

IMPORTANCE OF PROGRESSIVE WEAR MAPPING FOR FLOOR PANELS

Flooring testing has traditionally centered on the wear rate of a sample to determine its durability against wear. However, progressive wear mapping allows analyzing the sample’s wear rate throughout the test, providing valuable insights into its wear behavior. This in-depth analysis allows for correlations between friction data and wear rate, which can identify the root causes of wear. It should be noted that wear rates are not constant throughout wear tests. Thus, observing the progression of wear gives a more accurate assessment of the sample’s wear. Progressing beyond traditional testing methods, the adoption of progressive wear mapping has contributed to significant advancements in the field of flooring testing.
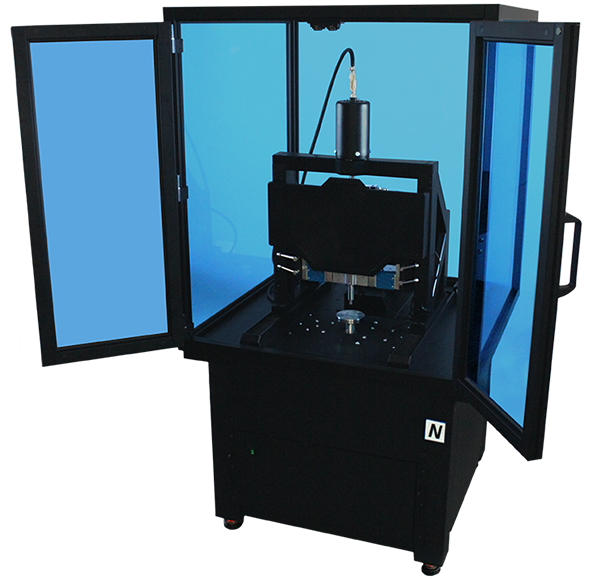
The NANOVEA T2000 Tribometer with an integrated 3D Non-Contact Profilometer is a groundbreaking solution for wear testing and volume loss measurements. Its ability to move with precision between the pin and the profilometer guarantees the reliability of results by eliminating any deviation in wear track radius or location. But that’s not all – the 3D Non-Contact Profilometer’s advanced capabilities allow for high-speed surface measurements, reducing scanning time to mere seconds. With the capability of applying loads of up to 2,000 N and achieving spinning speeds of up to 5,000 rpm, the NANOVEA T2000 Tribometer offers versatility and precision in the evaluation process. It’s clear that this equipment holds a vital role in progressive wear mapping.


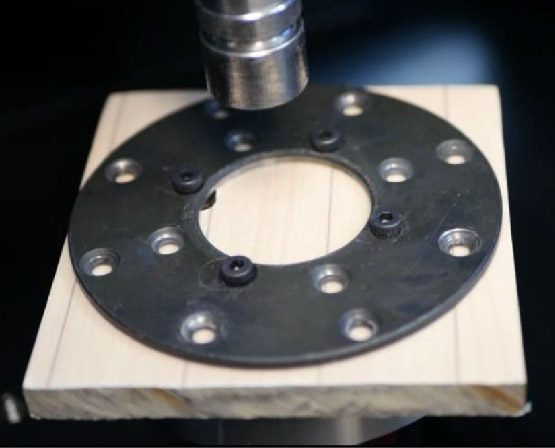
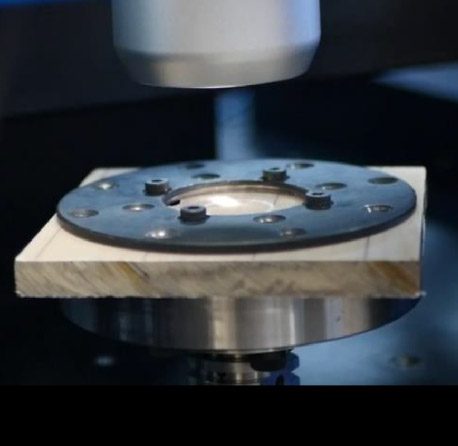
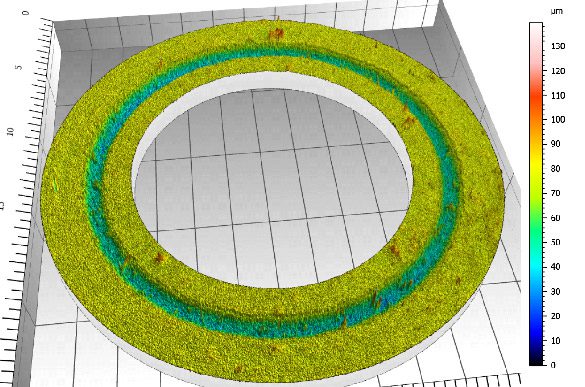
FIGURE 1: Sample set-up prior to wear testing (left) and post-wear test profilometry of the wear track (right).

MEASUREMENT OBJECTIVE

Progressive wear mapping testing was performed on two types of flooring materials: stone and wood. Each sample underwent a total of 7 test cycles, with increasing test durations of 2, 4, 8, 20, 40, 60, and 120 s, allowing for a comparison of wear over time. After each test cycle, the wear track was profiled using the NANOVEA 3D Non-Contact Profilometer. From the data collected by the profiler, the volume of the hole and wear rate can be analyzed using the integrated features in the NANOVEA Tribometer software or our surface analysis software, Mountains.

NANOVEA

T2000

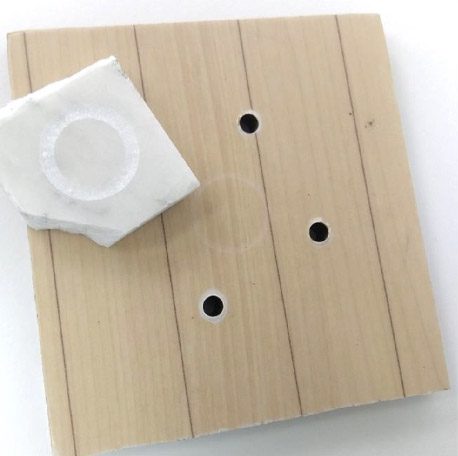
wear mapping test samples wood and stone

 THE SAMPLES 

WEAR MAPPING TEST PARAMETERS

LOAD40 N
TEST DURATIONvaries
SPEED200 rpm
RADIUS10 mm
DISTANCEvaries
BALL MATERIALTungsten Carbide
BALL DIAMETER10 mm

Test duration used over the 7 cycles were 2, 4, 8, 20, 40, 60, and 120 seconds, respectively. The distances traveled were 0.40, 0.81, 1.66, 4.16, 8.36, 12.55, and 25.11 meters.

WEAR MAPPING RESULTS

WOOD FLOORING

Test CycleMax COFMin COFAvg. COF
10.3350.1240.275
20.3370.2070.295
30.3800.2290.329
40.3930.2650.354
50.3520.2050.314
60.3450.1990.312
70.3150.2110.293


RADIAL ORIENTATION

Test CycleTotal Volume Loss (µm3Total Distance
Traveled (m)
Wear Rate
(mm/Nm) x10-5
Instantaneous Wear Rate
(mm/Nm) x10-5
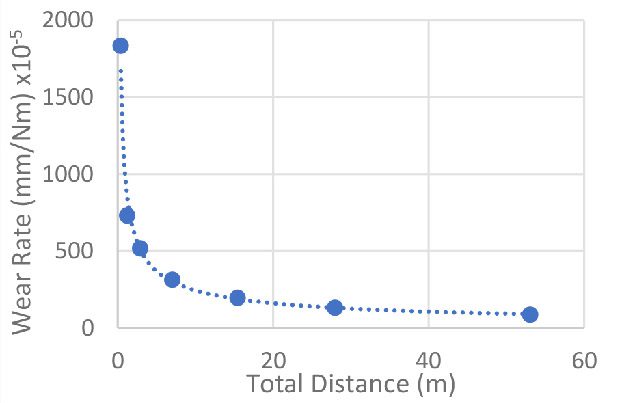
12962476870.401833.7461833.746
23552452271.221093.260181.5637
35963713262.88898.242363.1791
48837477677.04530.629172.5496
5120717995115.40360.88996.69074
6147274531827.95293.32952.89311
7185131921053.06184.34337.69599
wood progressive wear rate vs total distance

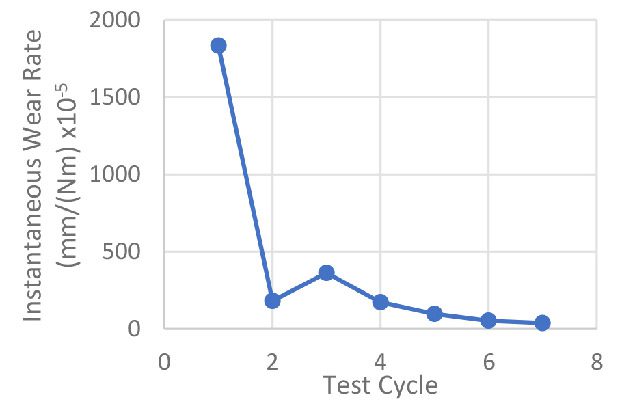
FIGURE 2: Wear rate vs total distance traveled (left)
and instantaneous wear rate vs test cycle (right) for wood flooring.

progressive wear mapping of wood floor

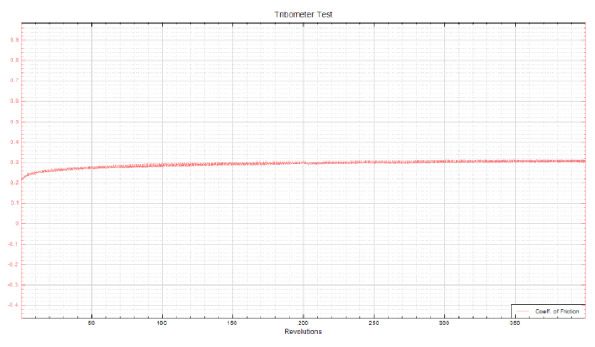
FIGURE 3: COF graph and 3D view of wear track from test #7 on wood flooring.

wear mapping extracted profile

FIGURE 4: Cross-Sectional Analysis of Wood Wear Track from Test #7

progressive wear mapping volume and area analysis

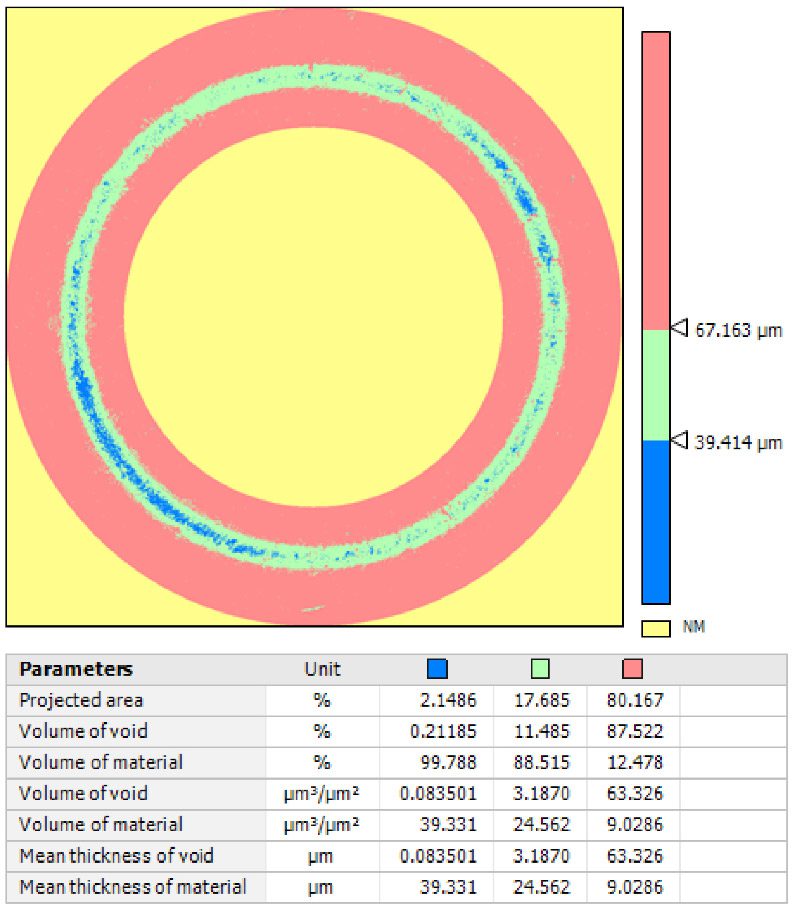
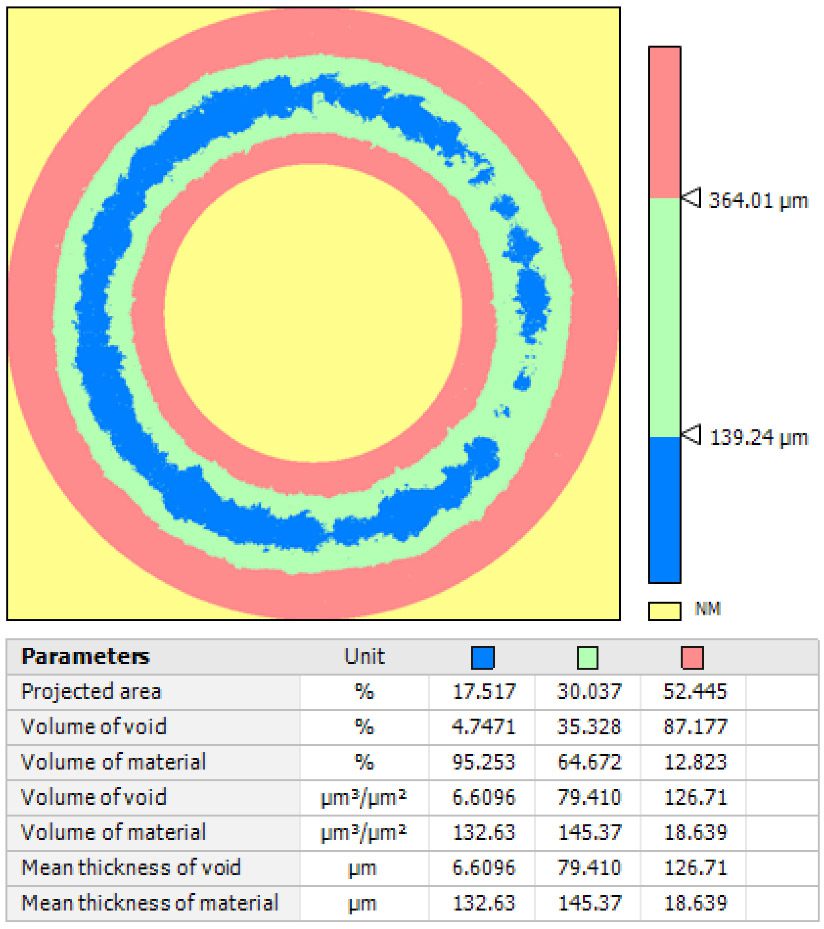
FIGURE 5: Volume and Area Analysis of Wear Track on Wood Sample Test #7.

WEAR MAPPING RESULTS

STONE FLOORING

Test CycleMax COFMin COFAvg. COF
10.2490.0350.186
20.3490.1970.275
30.2940.1540.221
40.5030.1240.273
50.5480.1060.390
60.5100.1290.434
70.5270.1810.472


RADIAL ORIENTATION

Test CycleTotal Volume Loss (µm3Total Distance
Traveled (m)
Wear Rate
(mm/Nm) x10-5
Instantaneous Wear Rate
(mm/Nm) x10-5
1962788460.40595.957595.9573
28042897311.222475.1852178.889
313161478552.881982.355770.9501
431365302157.041883.2691093.013
51082173218015.403235.1802297.508
62017496034327.954018.2821862.899
74251206342053.064233.0812224.187
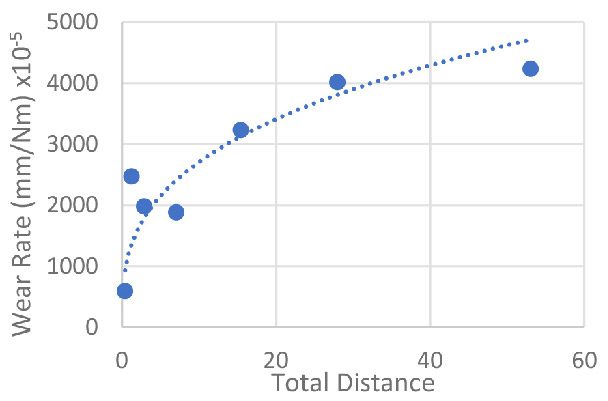
stone flooring wear rate vs distance
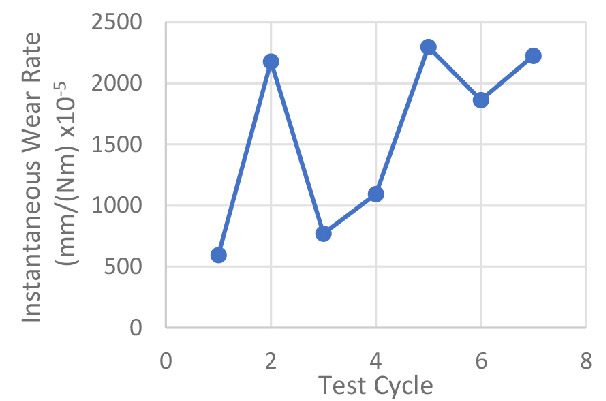
stone flooring instantaneous wear rate chart

FIGURE 6: Wear rate vs total distance travelled (left)
and instantaneous wear rate vs test cycle (right) for stone flooring.

stone floor 3d profile of wear track

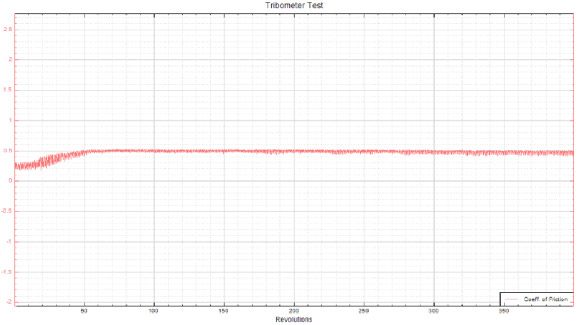
FIGURE 7: COF graph and 3D view of wear track from test #7 on stone flooring.

stone floor progressive wear mapping extracted profile
stone flooring extracted profile maximum depth and height area of the hole and peak

FIGURE 8: Cross-Sectional Analysis of Stone Wear Track from Test #7.

wood floor progressive wear mapping volume analysis

FIGURE 9: Volume and Area Analysis of Wear Track on Stone Sample Test #7.

DISCUSSION

The instantaneous wear rate is calculated with the following equation:
progressive wear mapping of flooring formula

Where V is the volume of a hole, N is the load, and X is the total distance, this equation describes the wear rate between test cycles. The instantaneous wear rate can be used to better identify changes in wear rate throughout the test.

Both samples have very different wear behaviors. Over time, the wood flooring starts with a high wear rate but quickly drops to a smaller, steady value. For the stone flooring, the wear rate appears to start at a low value and trends to a higher value over cycles. The instantaneous wear rate also shows little consistency. The specific reason for the difference is not certain but may be due to the structure of the samples. The stone flooring seems to consist of loose grain-like particles, which would wear differently compared to the wood’s compact structure. Additional testing and research would be needed to ascertain the cause of this wear behavior.

The data from the coefficient of friction (COF) seems to agree with the observed wear behavior. The COF graph for the wood flooring appears consistent throughout the cycles, complementing its steady wear rate. For the stone flooring, the average COF increases throughout the cycles, similar to how the wear rate also increases with cycles. There are also apparent changes in the shape of the friction graphs, suggesting changes in how the ball is interacting with the stone sample. This is most apparent in cycle 2 and cycle 4.

CONCLUSION

The NANOVEA T2000 Tribometer showcases its ability to perform progressive wear mapping by analyzing the wear rate between two different flooring samples. Pausing the continuous wear test and scanning the surface with the NANOVEA 3D Non-Contact Profilometer provides valuable insights into the material’s wear behavior over time.

The NANOVEA T2000 Tribometer with the integrated 3D Non-Contact Profilometer provides a wide variety of data, including COF (Coefficient of Friction) data, surface measurements, depth readings, surface visualization, volume loss, wear rate, and more. This comprehensive set of information allows users to gain a deeper understanding of the interactions between the system and the sample. With its controlled loading, high precision, ease of use, high loading, wide speed range, and additional environmental modules, the NANOVEA T2000 Tribometer takes tribology to the next level.

NOW, LET'S TALK ABOUT YOUR APPLICATION

Comment