Category: Laboratory Testing
Ceramics: Nanoindentation Fast Mapping for Grain Detection
INTRODUCTION
Nanoindentation has become a widely applied technique for measuring mechanical behaviors of materials at small scalesi ii. The high-resolution load-displacement curves from a nanoindentation measurement can provide a variety of physicomechanical properties, including hardness, Young’s modulus, creeping, fracture toughness and many others.
Importance of Fast Mapping Indentation
One significant bottleneck for further popularization of the nanoindentation technique is time consumption. A mechanical property mapping by conventional nanoindentation procedure can easily take hours which hinders the application of the technique in mass production industries, such as semiconductor, aerospace, MEMS, consumer products such as ceramic tiles and many others.
Fast mapping can prove to be essential in the ceramic tile manufacturing industry, Hardness and Young’s modulus mappings across a single ceramic tile can present a distribution of data that indicates how homogeneous the surface is. Softer regions on a tile can be outlined in this mapping and show locations more prone to failure from physical impacts that happen on a day to day basis in someone’s residence. Mappings can be made on different types of tiles for comparative studies and on a batch of similar tiles to measure tile consistency in a quality control processes. The combination of measurements setups can be extensive as well as accurate and efficient with the fast mapping method.
MEASUREMENT OBJECTIVE
In this study, the Nanovea Mechanical Tester, in FastMap mode is used to map the mechanical property of a floor tile at high speeds. We showcase the capacity of the Nanovea Mechanical Tester in performing two fast nanoindentation mappings with high precision and reproducibility.
Test Conditions
The Nanovea Mechanical Tester was used to perform a series of nanoindentations with the FastMap Mode on a floor tile using a Berkovich indenter. The test parameters are summarized below for the two indent matrices created.
Table 1: Test parameter summary.
RESULTS & DISCUSSION
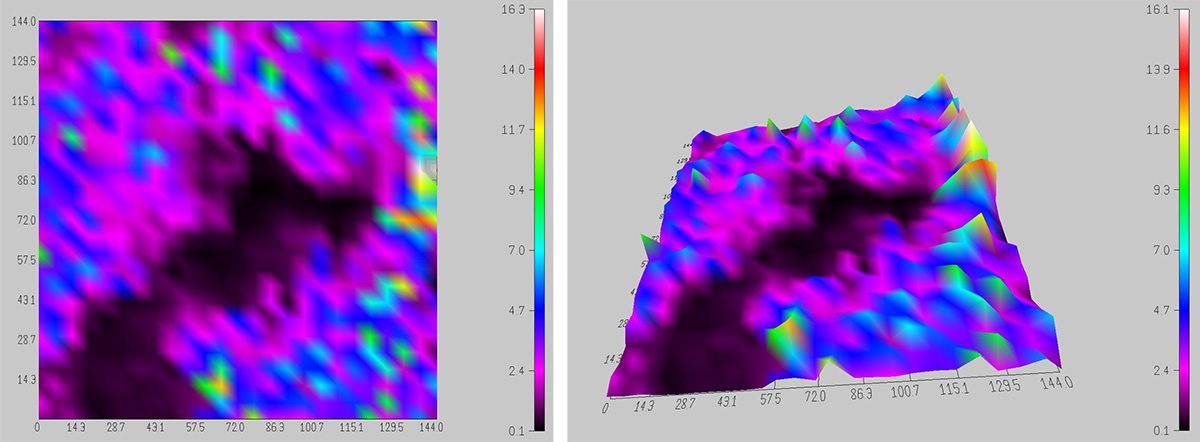
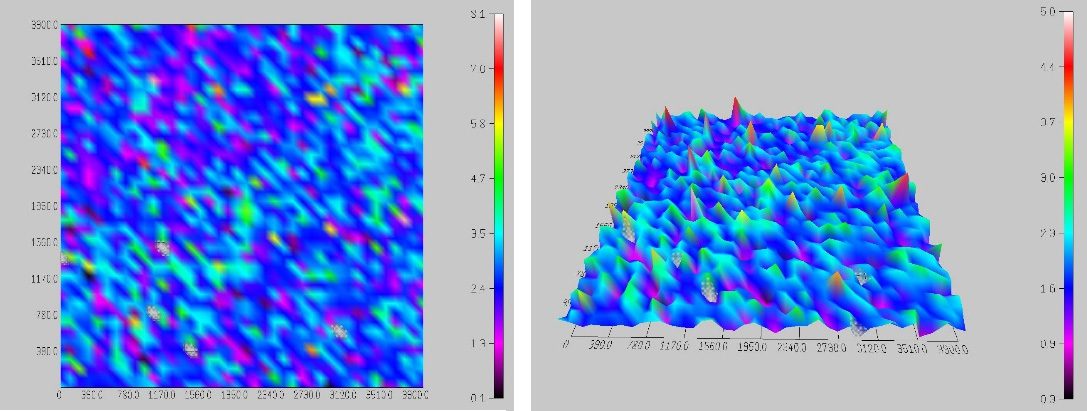
Figure 1: 2D and 3D view of 625-indent hardness mapping.
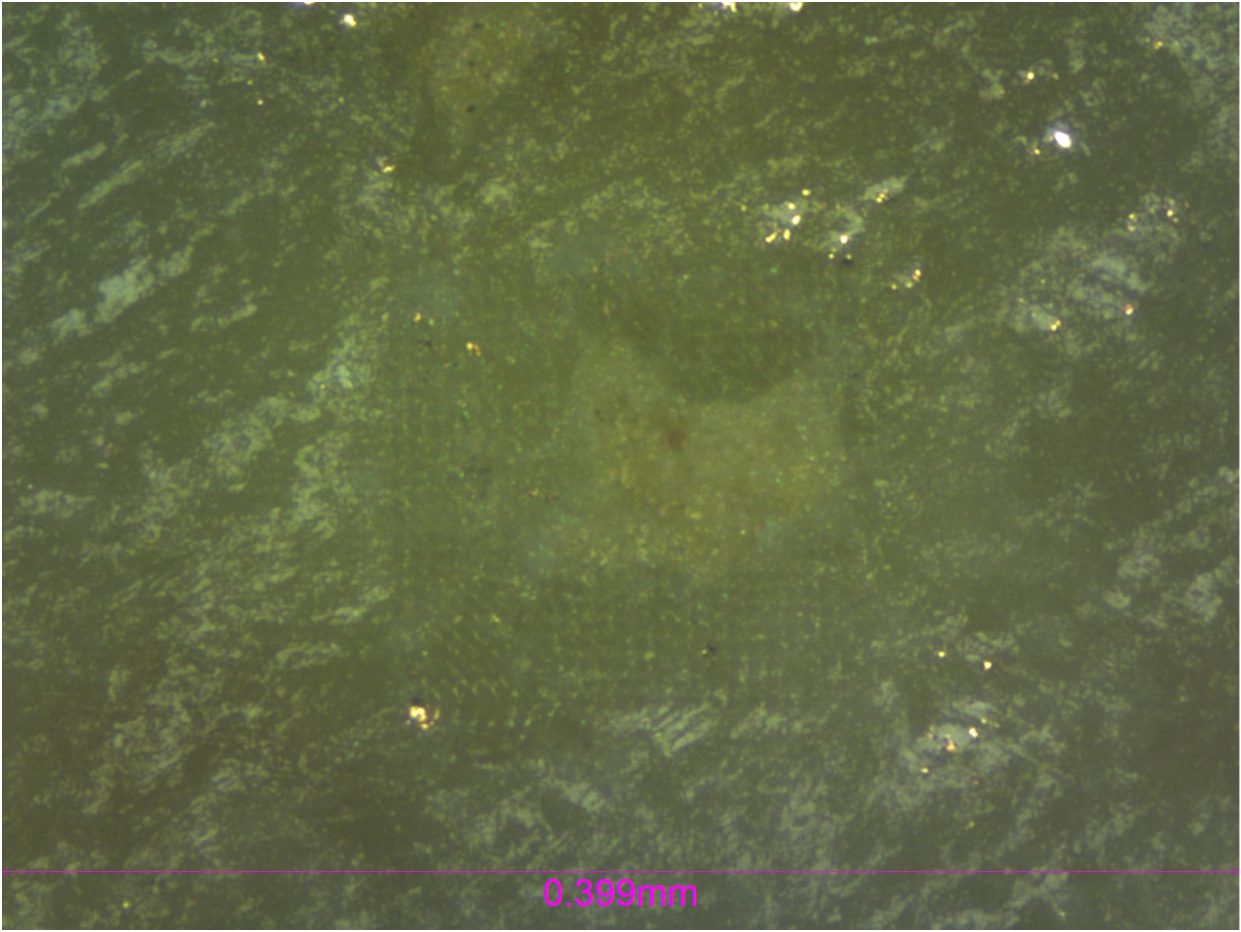
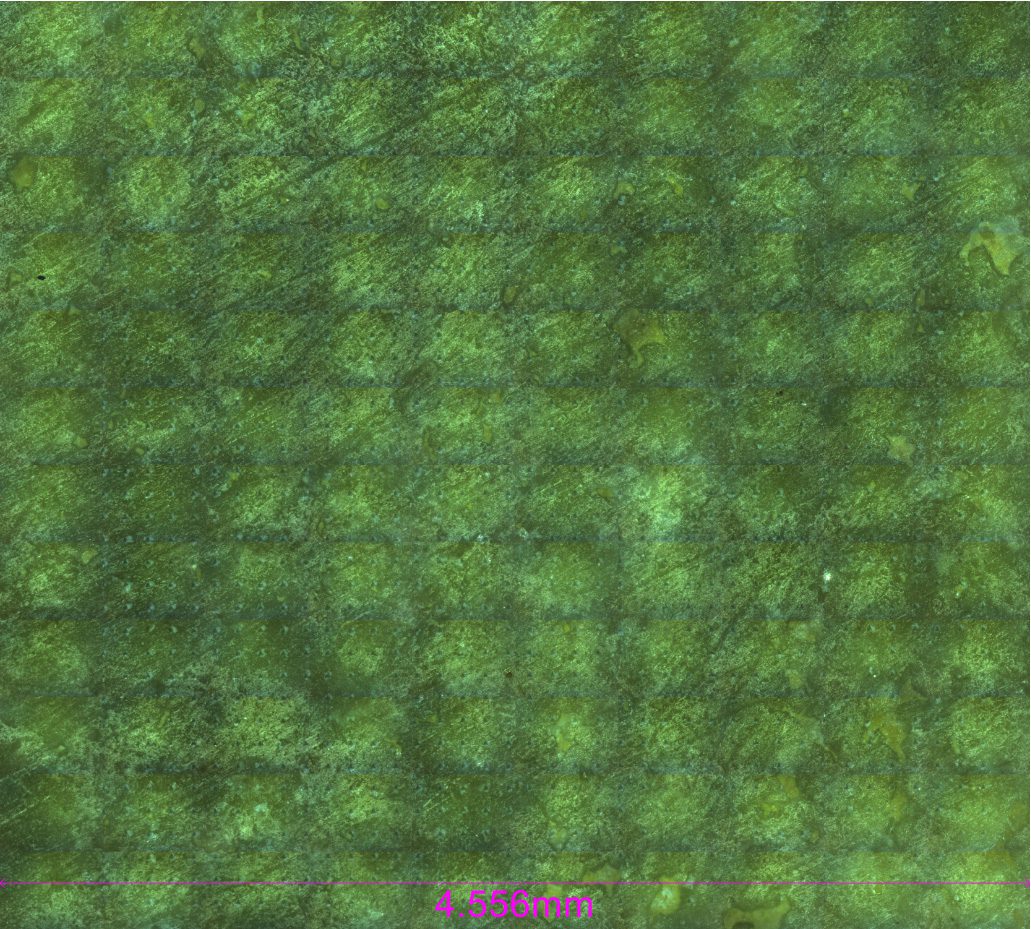
Figure 2: Micrograph of 625-indent matrix showcasing grain.
A 625-indent matrix was conducted on a 0.20mm2 area with a large visible grain present. This grain (Figure 2) had an average hardness lower than the overall surface of the tile. The Nanovea Mechanical Software allows the user to see the hardness distribution map in 2D and 3D mode which are depicted in Figure 1. Using the high-precision position control of the sample stage, the software allows users to target areas such as these for in depth mechanical properties mapping.
Figure 3: 2D and 3D view of 1600-indent hardness mapping.
Figure 4: Micrograph of 1600-indent matrix.
A 1600-indent matrix was also created on the same tile to measure the homogeneity of the surface. Here again the user has the ability to see the hardness distribution in 3D or 2D mode (Figure 3) as well as the microscope image of the indented surface. Based on the hardness distribution presented, it can be concluded that the material is porous due to the even scattering of high and low hardness data points.
Compared to conventional nanoindentation procedures, FastMap mode in this study is substantially less time-consuming and more cost-effective. It enables speedy quantitative mapping of mechanical properties including Hardness and Young’s Modulus and provides a solution for grain detection and material consistency which is critical for quality control of a variety of materials in mass production.
CONCLUSION
In this study, we showcased the capacity of the Nanovea Mechanical Tester in performing speedy and precise nanoindentation mapping using FastMap mode. The mechanical property maps on the ceramic tile utilize the position control (with 0.2µm accuracy) of the stages and force module sensitivity to detect surface grains and measure homogeneity of a surface at high speed.
The test parameters used in this study were determined based on the size of the matrix and sample material. A variety of test parameters can be chosen to optimize the total indentation cycle time to 3 seconds per indent (or 30 seconds for every 10 indentations).
The Nano and Micro modules of the Nanovea Mechanical Tester all include ISO and ASTM compliant indentation, scratch and wear tester modes, providing the widest and most user-friendly range of testing available in a single system. Nanovea’s unmatched range is an ideal solution for determining the full range of mechanical properties of thin or thick, soft or hard coatings, films and substrates, including hardness, Young’s Modulus, fracture toughness, adhesion, wear resistance and many others.
In addition, optional 3D non-contact profiler and AFM Module are available for high resolution 3D imaging of indentation, scratch and wear track in addition to other surface measurements such as roughness.
Author: Duanjie Li, PhD Revised by Pierre Leroux & Jocelyn Esparza
Improve Mining Procedures With Microindendation
MICROINDENTATION RESEARCH AND QUALITY CONTROL
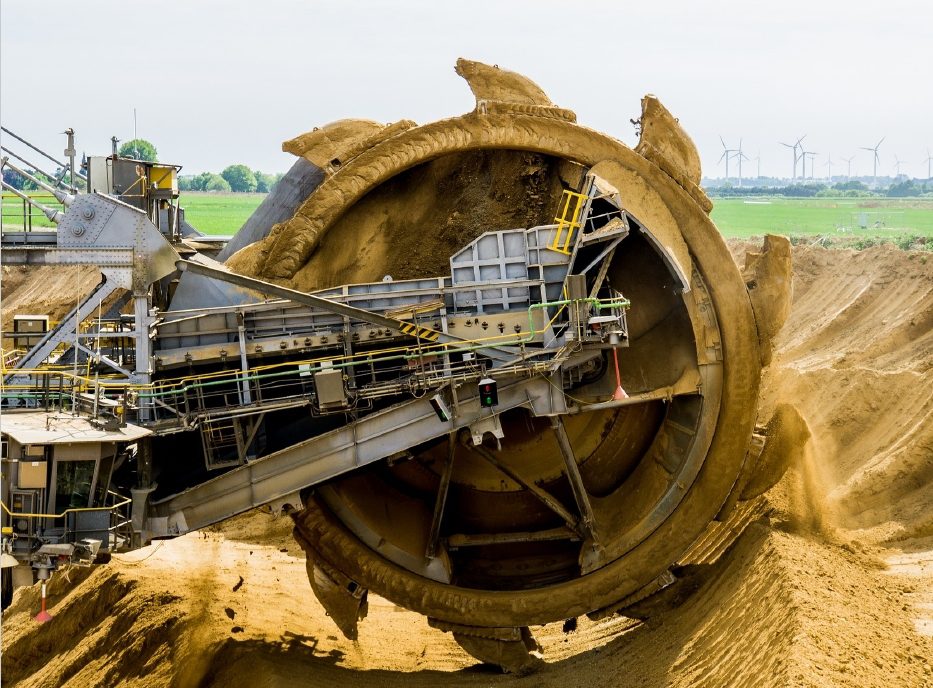
Rock mechanics is the study of the mechanical behavior of rock masses and is applied in mining, drilling, reservoir production, and civil construction industries. Advanced instrumentation with precise measurement of mechanical properties allows for part and procedure improvement within these industries. Successful quality control procedures are ensured by understanding rock mechanics at the micro scale.
MEASUREMENT OBJECTIVE
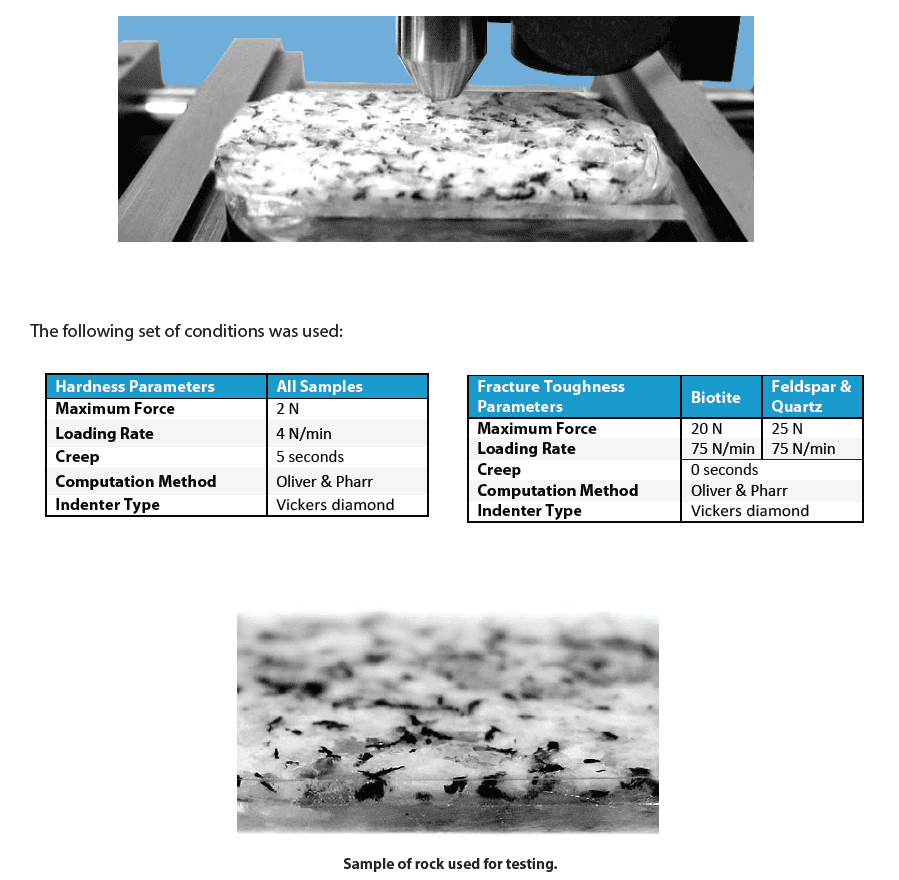
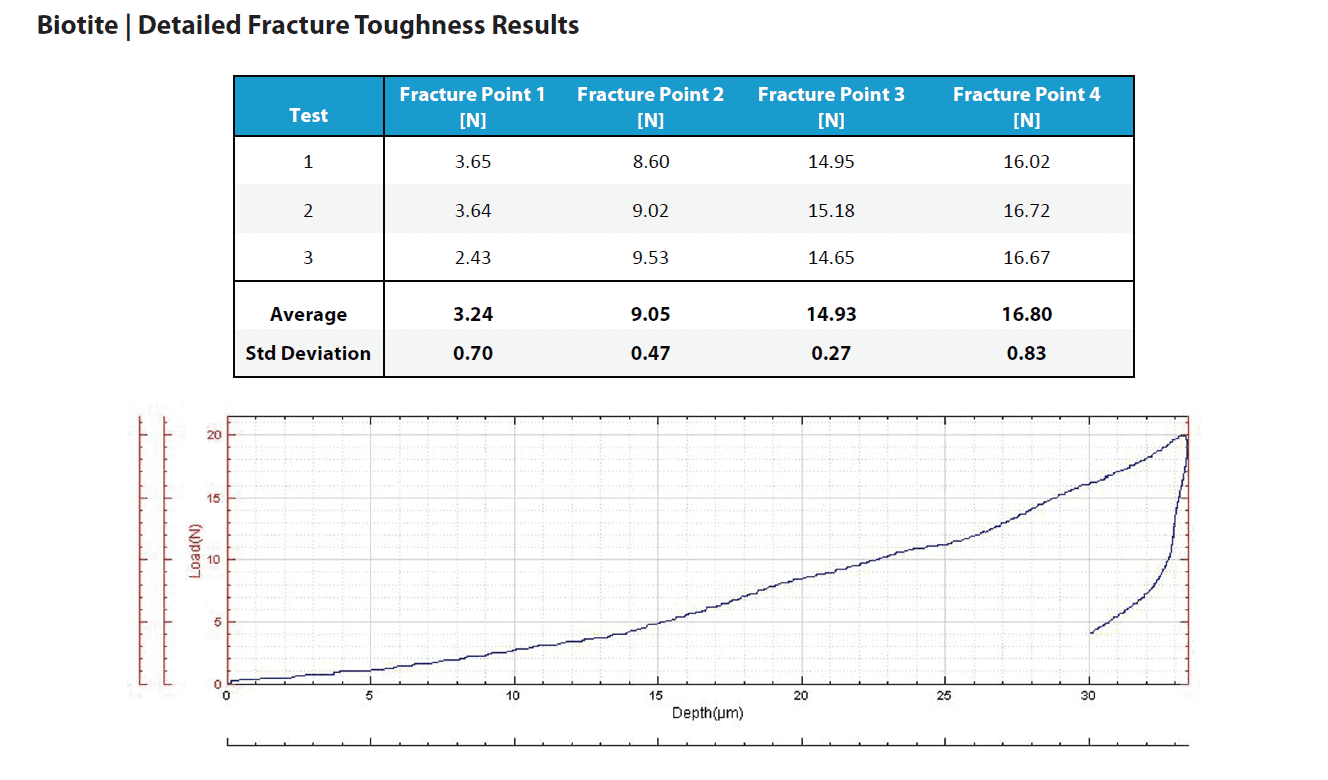
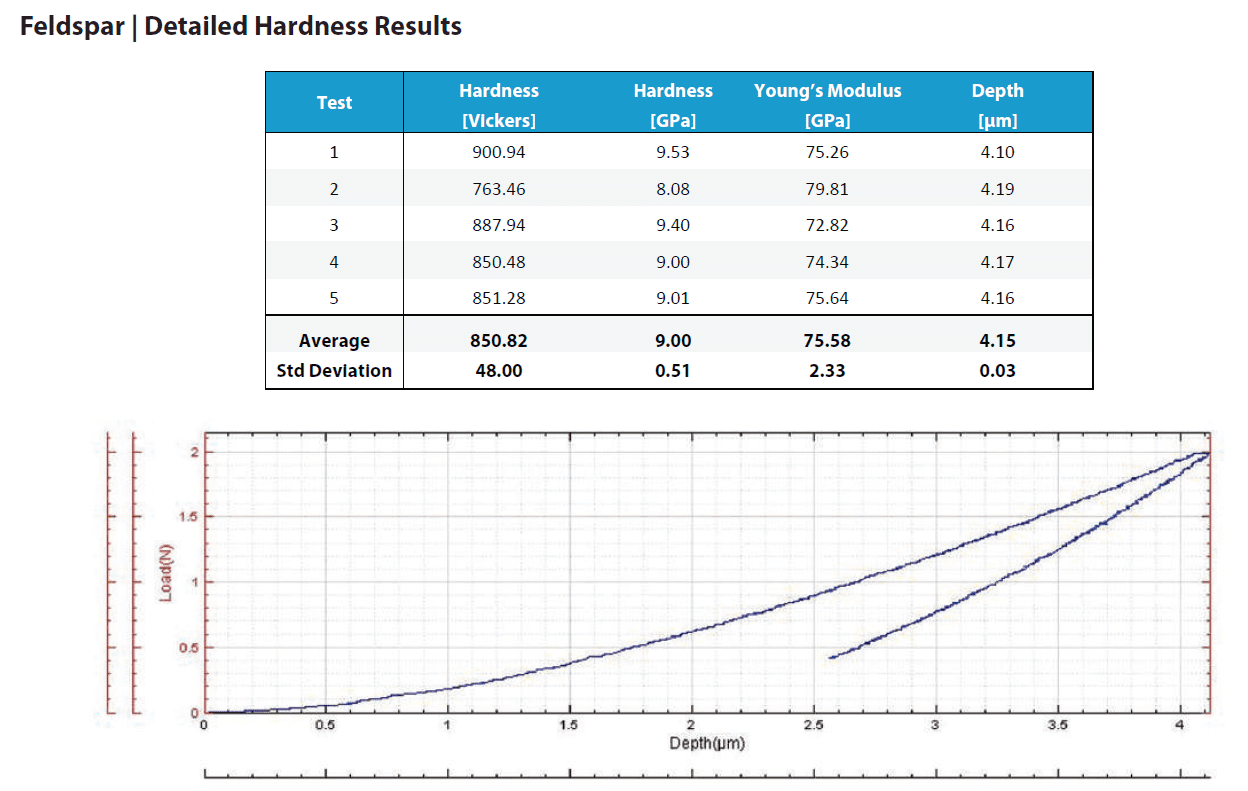
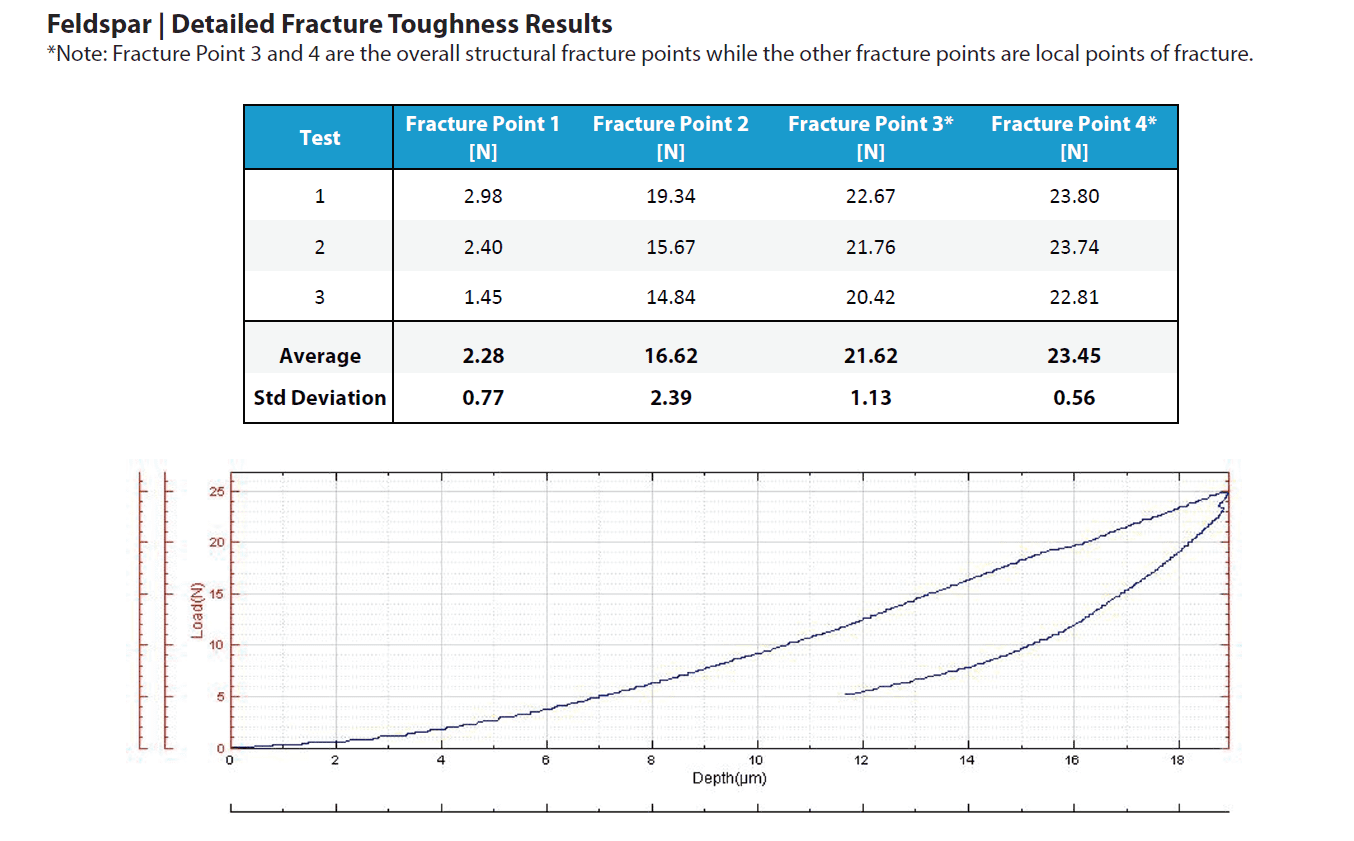
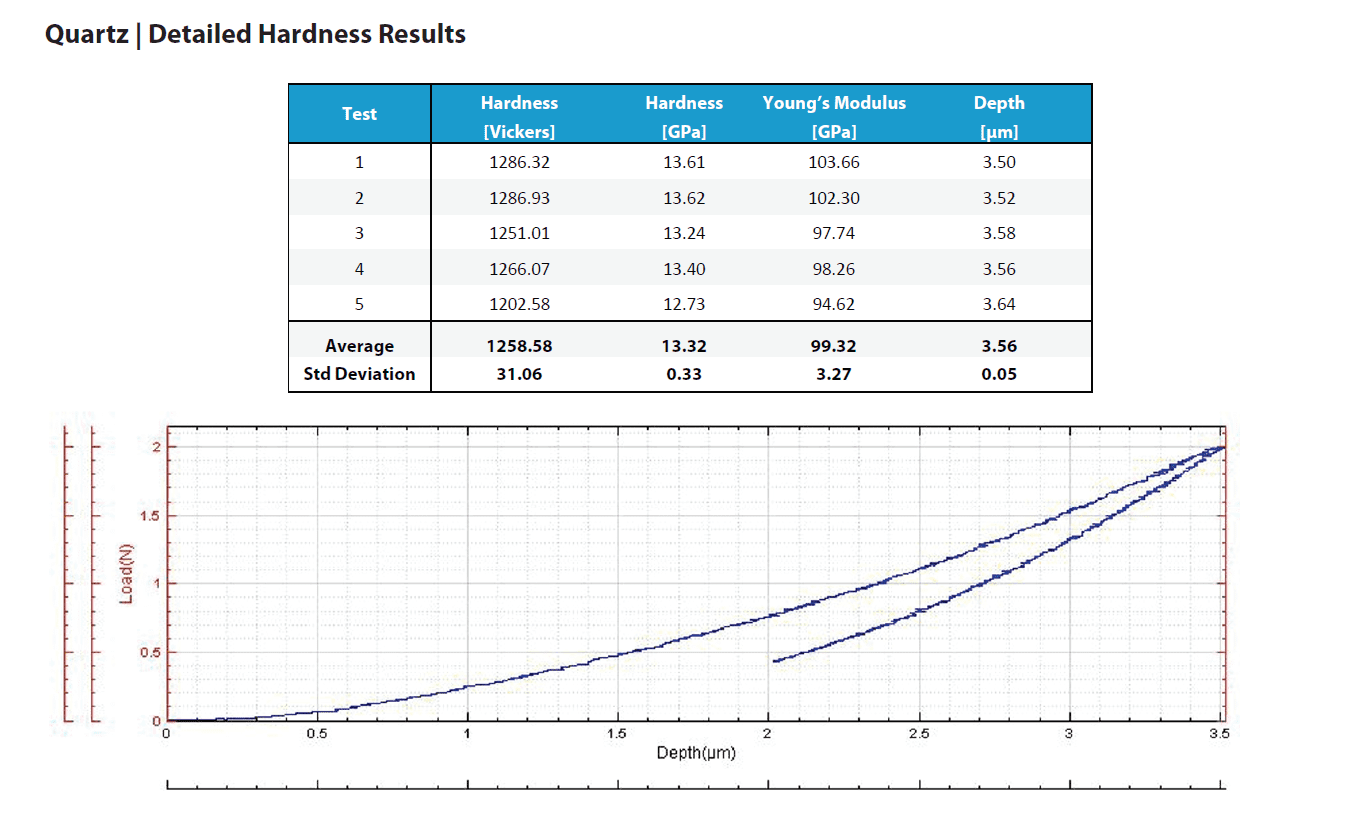
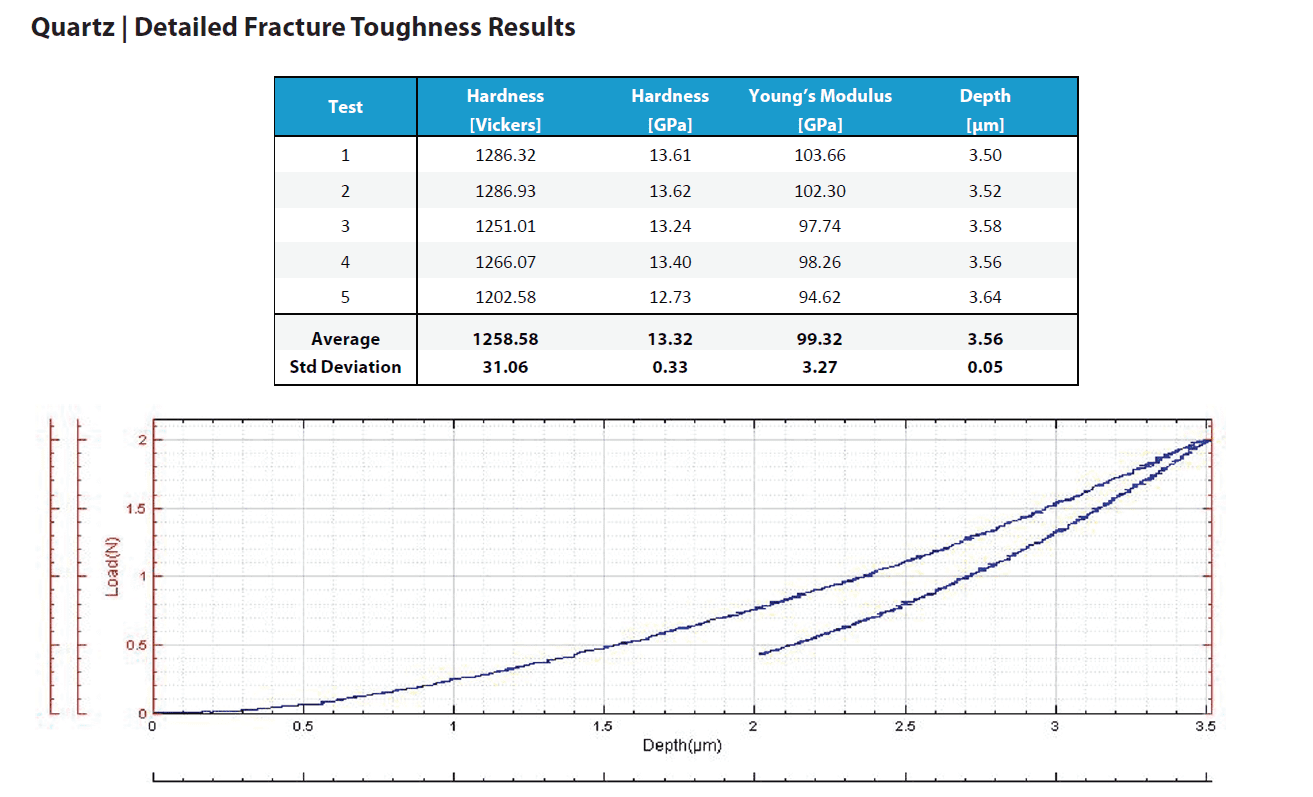
In this application the Nanovea mechanical tester measures the Vickers hardness (Hv), Young’s modulus, and fracture toughness of a mineral rock sample. The rock is made up of biotite, feldspar and quartz which form the standard granite composite. Each is tested separately.
RESULTS AND DISCUSSION
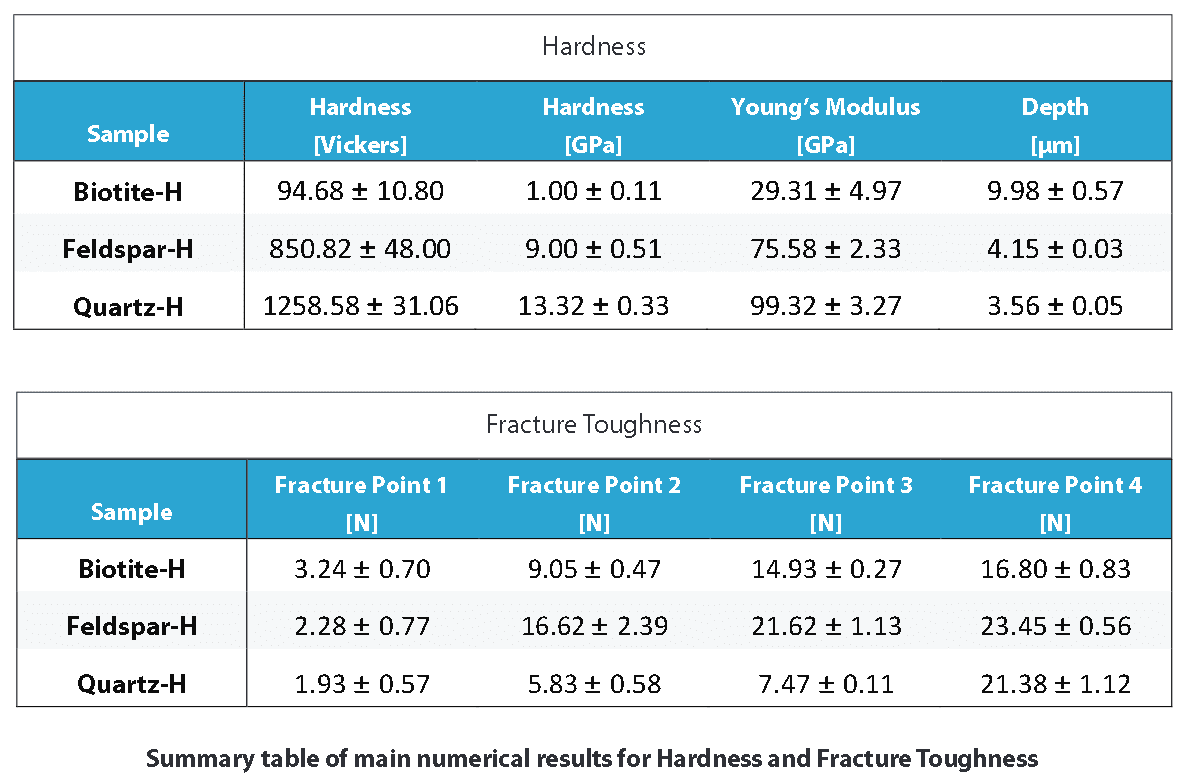
This section includes a summary table that compares the main numerical results for the different samples, followed by the full result listings, including each indentation performed, accompanied by micrographs of the indentation, when available. These full results present the measured values of Hardness and Young’s modulus as the penetration depth (Δd) with their averages and standard deviations. It should be considered that large variation in the results can occur in the case that the surface roughness is in the same size range as the indentation.
Summary table of main numerical results for Hardness and Fracture Toughness
CONCLUSION
The Nanovea mechanical tester demonstrates reproducibility and precise indentation results on the hard surface of mineral rock. Hardness and Young’s modulus of each material forming the granite was measured directly from depth versus load curves. The rough surface meant testing at higher loads that may have caused micro cracking. Micro cracking would explain some of the variations seen in measurements. Cracks were not perceivable through standard microscopy observation because of a rough sample surface. Therefore, it is not possible to calculate traditional fracture toughness numbers that requires cracks length measurements. Instead, we used the system to detect initiation of cracks through the dislocations in the depth versus load curves while increasing loads.
Fracture threshold loads were reported at loads where failures occurred. Unlike traditional fracture toughness tests that simply measure crack length, a load is obtained at which threshold fracture starts. Additionally, the controlled and closely monitored environment allows the measurement of hardness to use as a quantitative value for comparing a variety of samples.
NOW, LET'S TALK ABOUT YOUR APPLICATION
In-line Roughness Inspection
Learn more
IMPORTANCE OF NON-CONTACT PROFILER FOR IN-LINE ROUGHNESS INSPECTION
Surface defects derive from materials processing and product manufacturing. In-line surface quality inspection ensures the tightest quality control of the end products. The Nanovea 3D Non-Contact Profilometers utilize chromatic confocal technology with a unique capability to determine the roughness of a sample with-out contact. Multiple profiler sensors can be installed to monitor the roughness and texture of different areas of the product at the same time. The roughness threshold calculated in real-time by the analysis software serves as a fast and reliable pass/fail tool.
MEASUREMENT OBJECTIVE
In this study, the Nanovea roughness inspection conveyor system equipped with a point sensor is used to inspect the surface roughness of the acrylic and sandpaper samples. We showcase the capacity of Nanovea non-contact profilometer in providing fast and reliable in-line roughness inspection in a production line in real-time.
RESULTS AND DISCUSSION
The conveyor profilometer system can operate in two modes, namely Trigger Mode and Continuous Mode. As illustrated in Figure 2, the surface roughness of the samples are measured when they are passing under the optical profiler heads under the Trigger Mode. In comparison, Continuous Mode provides non-stop measurement of the surface roughness on the continuous sample, such as metal sheet and fabric. Multiple optical profiler sensors can be installed to monitor and record the roughness of different sample areas.
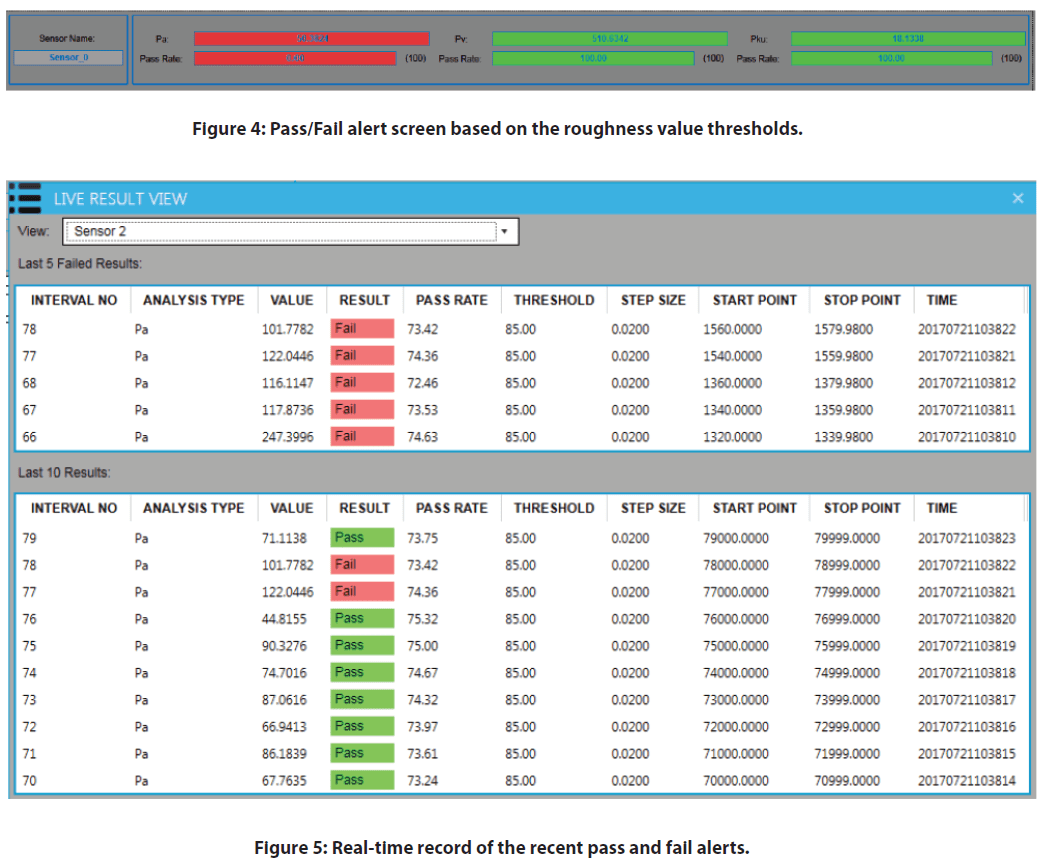
During the real-time roughness inspection measurement, the pass and fail alerts are displayed on the software windows as shown in Figure 4 and Figure 5. When the roughness value is within the given thresholds, the measured roughness is highlighted in green color. However, the highlight turns red when the measured surface roughness is out of the range of the set threshold values. This provides a tool for the user to determine the quality of a product’s surface finish.
In the following sections, two types of samples, e.g. Acrylic and Sandpaper are used to demonstrate the Trigger and Continuous Modes of the Inspection system.
Trigger Mode: Surface inspection of the Acrylic Sample
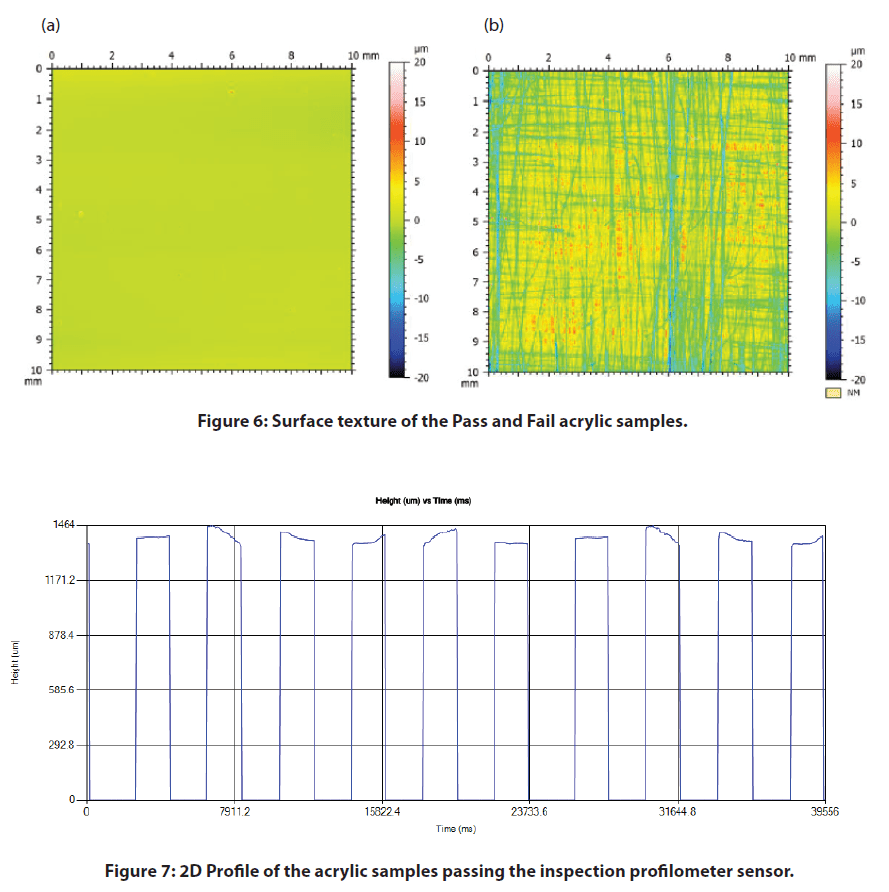
A series of Acrylic samples are aligned on the conveyor belt and move under the optical profiler head as shown in Figure 1. The false color view in Figure 6 shows the change of the surface height. Some of the mirror-like finished Acrylic samples had been sanded to create a rough surface texture as shown in Figure 6b.
As the Acrylic samples move at a constant speed under the optical profiler head, the surface profile is measured as shown in Figure 7 and Figure 8. The roughness value of the measured profile is calculated at the same time and compared to the threshold values. The red fail alert is launched when the roughness value is over the set threshold, allowing users to immediately detect and locate the defective product on the production line.
Continuous Mode: Surface Inspection of the sandpaper sample
Surface Height Map, Roughness Distribution Map, and Pass / Fail Roughness Threshold Map of the sandpaper sample surface as shown in Figure 9. The sandpaper sample has a couple of higher peaks in the used part as shown in the surface height map. The different colors in the pallet of Figure 9C represent the roughness value of the local surface. The Roughness Map exhibits a homogeneous roughness in the intact area of the sandpaper sample, while the used area is highlighted in dark blue color, indicating the reduced roughness value in this region. A Pass/Fail roughness threshold can be set up to locate such regions as shown in Figure 9D.
As the sandpaper continuously passes under the in-line profiler sensor, the real-time local roughness value is calculated and recorded as plotted in Figure 10. The pass/fail alerts are displayed on the software screen based on the set roughness threshold values, serving as a fast and reliable tool for quality control. The product surface quality in the production line is inspected in situ to discover defective areas in time.
In this application, we have shown the Nanovea Conveyor Profilometer equipped with an optical non-contact profiler sensor works as a reliable in-line quality control tool effectively and efficiently.
The inspection system can be installed in the production line to monitor the surface quality of the products in situ. The roughness threshold works as a dependable criteria to determine the surface quality of the products, allowing users to notice the defective products in time. Two inspection modes, namely Trigger Mode and Continuous Mode, are provided to meet the requirement for inspection on different types of products.
The data shown here represent only a portion of the calculations available in the analysis software. Nanovea Profilometers measure virtually any surface in fields including Semiconductor, Microelectronics, Solar, Fiber, Optics, Automotive, Aerospace, Metallurgy, Machining, Coatings, Pharmaceutical, Biomedical, Environmental and many others.
NOW, LET'S TALK ABOUT YOUR APPLICATION
Block-On-Ring Wear Test
IMPORTANCE OF BLOCK-ON-RING WEAR EVALUATION
Block-on-Ring (ASTM G77) test is a widely used technique that evaluates the sliding wear behaviors of materials in different simulated conditions, allows reliable ranking of material couples for specific tribological applications.
MEASUREMENT OBJECTIVE
In this application, the Nanovea Mechanical Tester measures the YS and UTS of stainless steel SS304 and aluminum Al6061 metal alloy samples. The samples were chosen for their commonly recognized YS and UTS values showing the reliability of Nanovea’s indentation methods.
The sliding wear behavior of an H-30 block on an S-10 ring was evaluated by Nanovea’s tribometer using the Block-on-Ring module. The H-30 block is made of 01 tool steel of 30HRC hardness, while the S-10 ring is steel type 4620 of surface hardness 58 to 63 HRC and ring diameter of ~34.98 mm. Block-on-Ring tests were performed in dry and lubricated environments to investigate the effect on wear behavior. Lubrication tests were performed in USP heavy mineral oil. The wear track was examined using Nanovea’s 3D non-contact profilometer. Test parameters are summarized in Table 1. The wear rate (K), was evaluated using the formula K=V/(F×s), where V is the worn volume, F is the normal load, s is the sliding distance.
RESULTS AND DISCUSSION
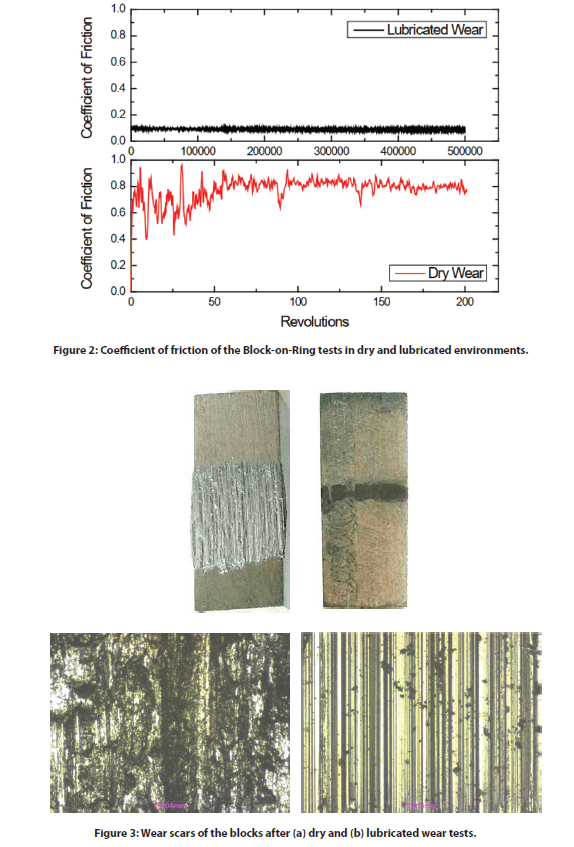
Figure 2 compares the coefficient of friction (COF) of the Block-on-Ring tests in dry and lubricated environments. The block has significantly more friction in a dry environment than a lubricated environment. COF
fluctuates during the run-in period in the first 50-revolution and reaches a constant COF of ~0.8 for the rest of the 200-revolution wear test. In comparison, the Block-on-Ring test performed in the USP heavy mineral oil lubrication exhibits constant low COF of 0.09 throughout the 500,000-revolution wear test. The lubricant significantly reduces the COF between the surfaces by ~90 times.
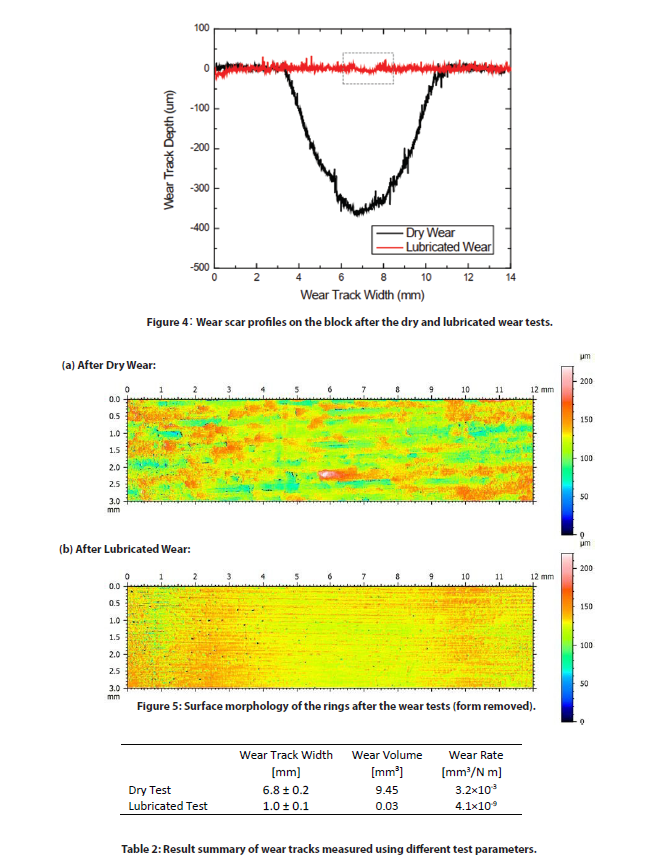
Figures 3 and 4 show the optical images and cross-section 2D profiles of the wear scars on the blocks after dry and lubricated wear tests. The wear track volumes and wear rates are listed in Table 2. The steel block after the dry wear test at a lower rotational speed of 72 rpm for 200 revolutions exhibits a large wear scar volume of 9.45 mm˙. In comparison, the wear test carried out at a higher speed of 197 rpm for 500,000 revolutions in the mineral oil lubricant creates a substantially smaller wear track volume of 0.03 mm˙.
The images in ÿgure 3 show severe wear takes place during tests in the dry conditions compared to the mild wear from the lubricated wear test. High heat and intense vibrations generated during the dry wear test promotes oxidation of metallic debris resulting in severe three-body abrasion. In the lubricated test the mineral oil reduces friction and cools the contact face as well as transporting abrasive debris created during wear away. This leads to signiÿcant reduction of wear rate by a factor of ~8×10ˆ. Such a substantial di˛erence in wear resistance in di˛erent environments shows the importance of proper sliding wear simulation in realistic service conditions.
Wear behavior can change drastically when small changes in test conditions are introduced. The versatility of Nanovea’s tribometer allows wear measurement in high temperature, lubrication, and tribocorrosion conditions. The accurate speed and position control by the advanced motor enables wear tests to be performed at speeds ranging from 0.001 to 5000 rpm, making it an ideal tool for research/testing labs to investigate the wear in di˛erent tribological conditions.
The surface condition of the samples was examined by Nanovea’s non-contact optical proÿlometer. Figure 5 shows the surface morphology of the rings after the wear tests. The cylinder form is removed to better present the surface morphology and roughness created by the sliding wear process. Signiÿcant surface roughening took place due to the three-body abrasion process during the dry wear test of 200 revolutions. The block and ring after the dry wear test exhibit a roughness Ra of 14.1 and 18.1 µm, respectively, compared to 5.7 and 9.1 µm for the long-term 500,000 – revolution lubricated wear test at a higher speed. This test demonstrates the importance of proper lubrication of piston ring-cylinder contact. Severe wear quickly damages the contact surface without lubrication and leads to irreversible deterioration of the service quality and even breakage of the engine.
CONCLUSION
In this study we showcase how Nanovea’s Tribometer is used to evaluate the sliding wear behavior of a steel metal couple using the Block-on-Ring module following the ASTM G77 Standard. The lubricant plays a critical role in the wear properties of the material couple. The mineral oil reduces the wear rate of the H-30 block by a factor of ~8×10ˆ and the COF by ~90 times. The versatility of Nanovea’s Tribometer makes it an ideal tool for measuring wear behavior under various lubrication, high temperature, and tribocorrosion conditions.
Nanovea’s Tribometer o˛ers precise and repeatable wear and friction testing using ISO and ASTM compliant rotative and linear modes, with optional high-temperature wear, lubrication, and tribo-corrosion modules available in one pre-integrated system. Nanovea’s unmatched range is an ideal solution for determining the full range of tribological properties of thin or thick, soft, or hard coatings, ÿlms, and substrates.
NOW, LET'S TALK ABOUT YOUR APPLICATION
Composite Material Analysis using 3D Profilometry
Importance of Non-Contact Profilometry for Composite Materials
It is crucial defects are minimized so composite materials are as strong as possible in reinforcement applications. As an anisotropic material, it is critical weave direction is consistent to maintain high performance predictability. Composite materials have one of the highest strength to weight ratios making it stronger than steel in some cases. It is important to limit exposed surface area in composites to minimize chemical vulnerability and thermal expansion effects. Profilometry surface inspection is critical to quality control production of composites to ensure strong performance over a long service time.
Nanovea’s 3D Non-Contact Profilometer is unlike other surface measurement techniques such as touch probes or interferometry. Our profilometers use axial chromatism to measure nearly any surface and open staging allows for samples of any size with no preparation needed. Nano through macro measurements are obtained during surface profile measurement with zero influence from sample reflectivity or absorption. Our profilometers easily measure any material: transparent, opaque, specular, diffusive, polished, and rough with the advanced ability to measure high surface angles with no software manipulation. The Non-Contact Profilometer technique provides the ideal and user-friendly capability to maximize composite material surface studies; along with the benefits of combined 2D & 3D capability.
Measurement Objective
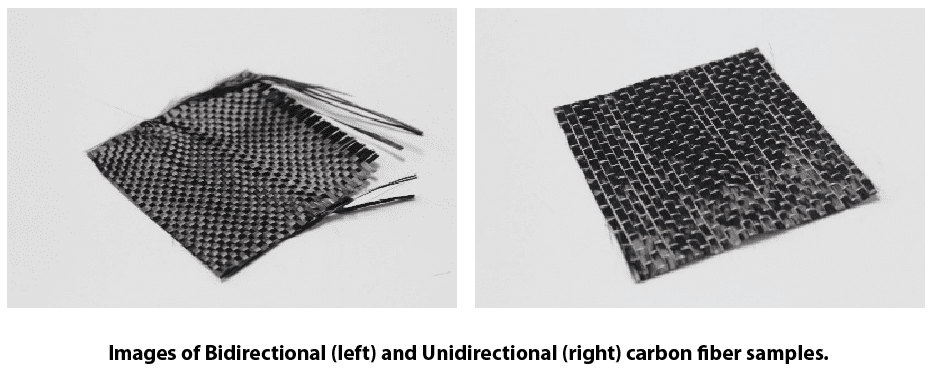
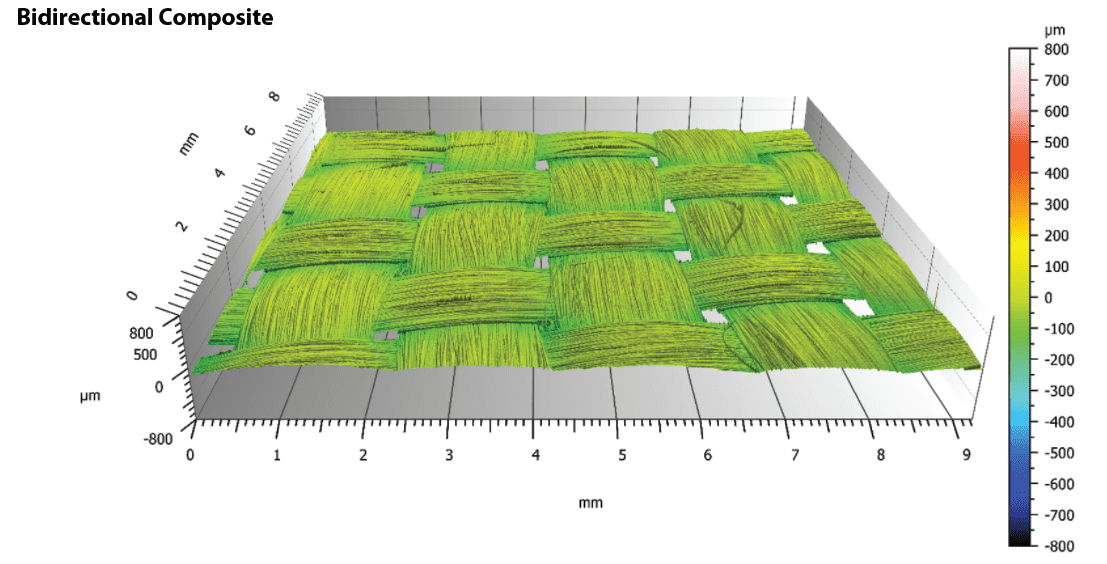
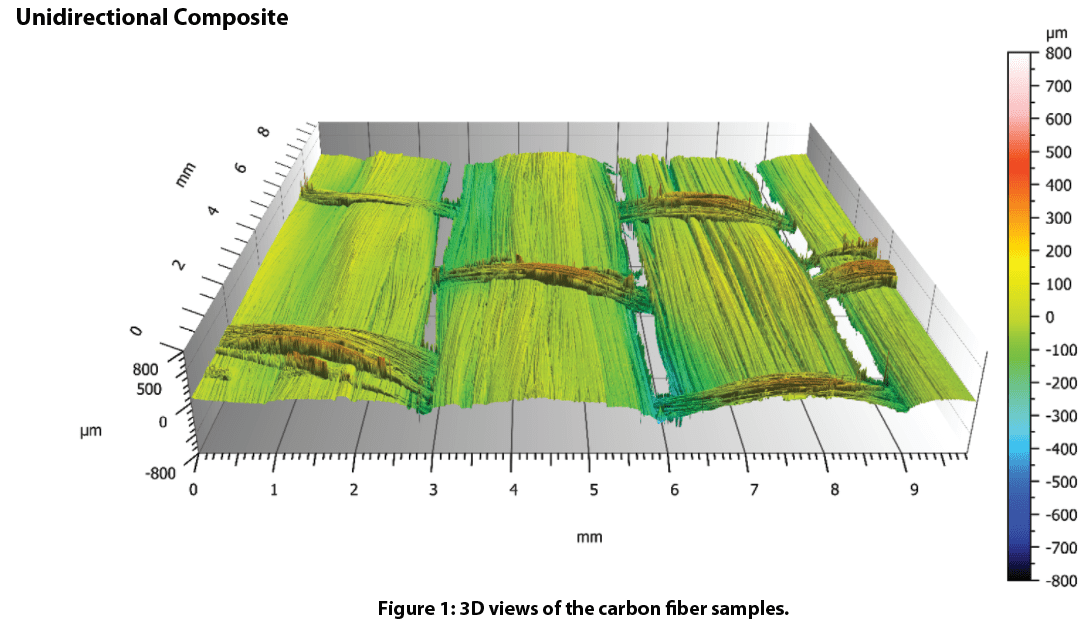
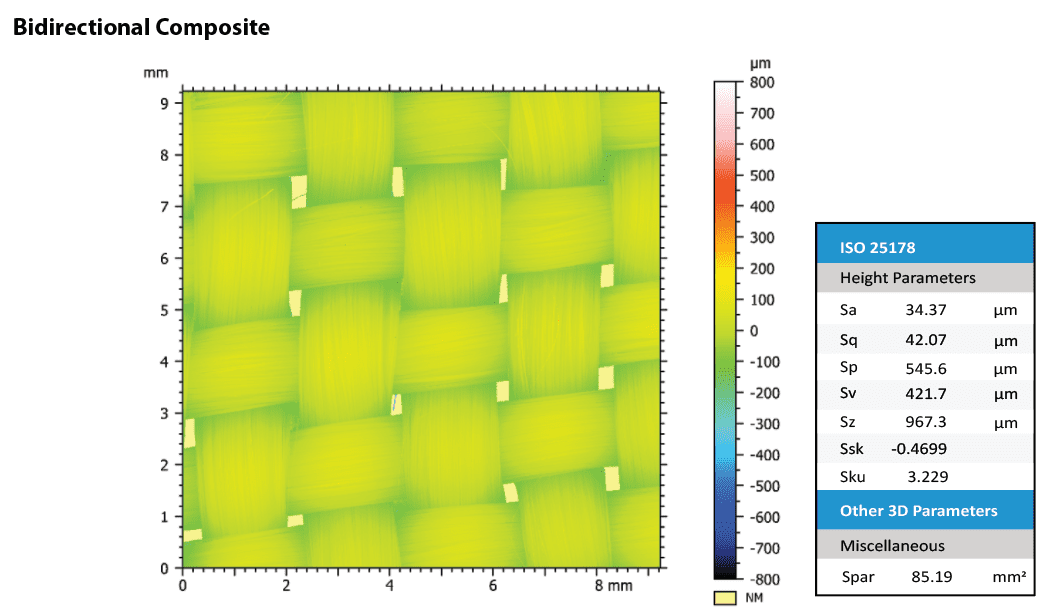
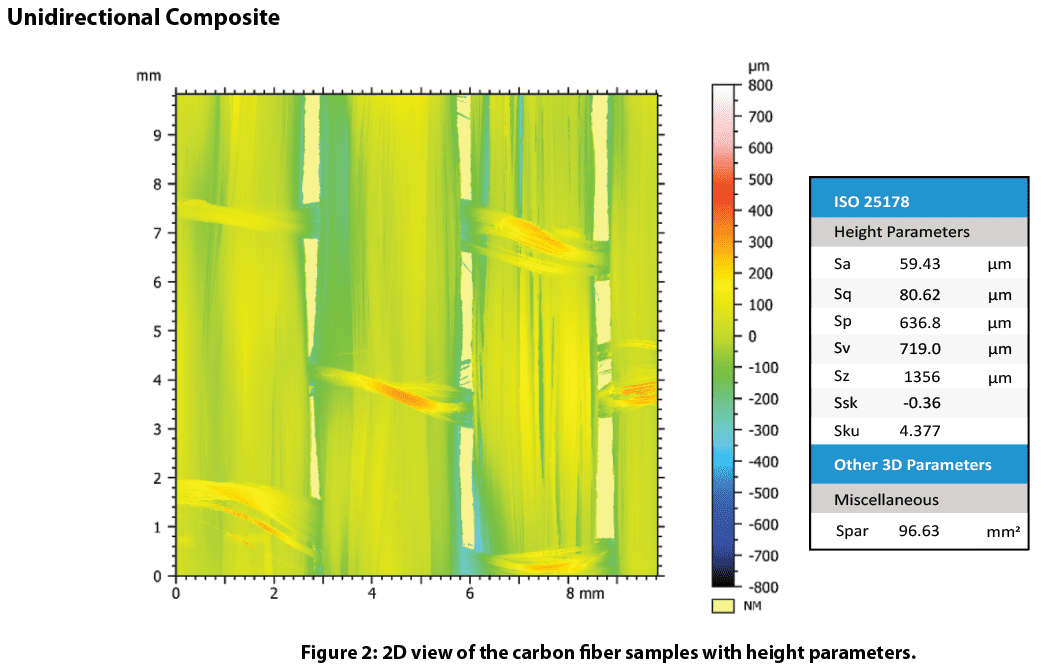
The Nanovea HS2000L Profilometer used in this application measured the surface of two weaves of carbon fiber composites. Surface roughness, weave length, isotropy, fractal analysis, and other surface parameters are used to characterize the composites. The area measured was randomly selected and assumed large enough that property values can be compared using Nanovea’s powerful surface analysis software.
Results and Discussion
Surface Analysis
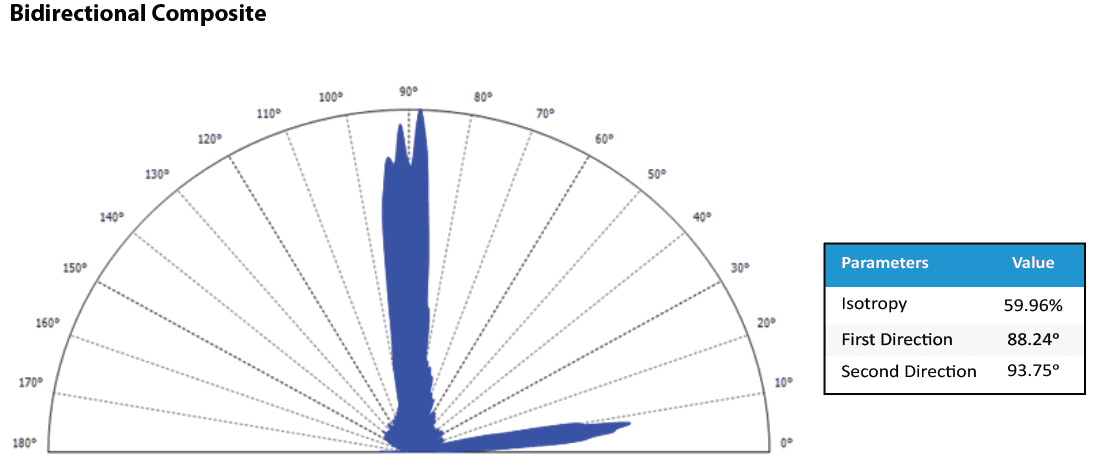
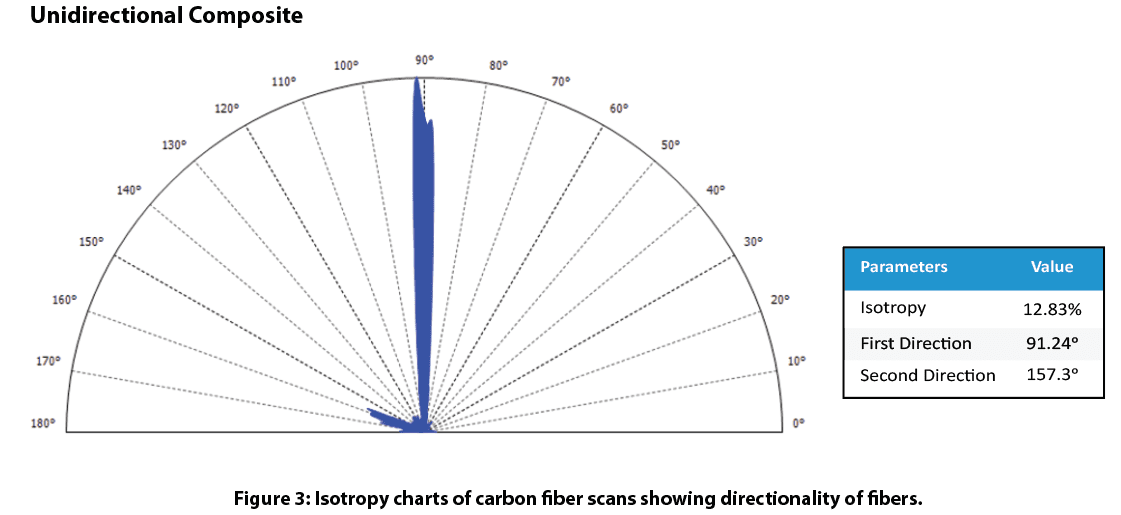
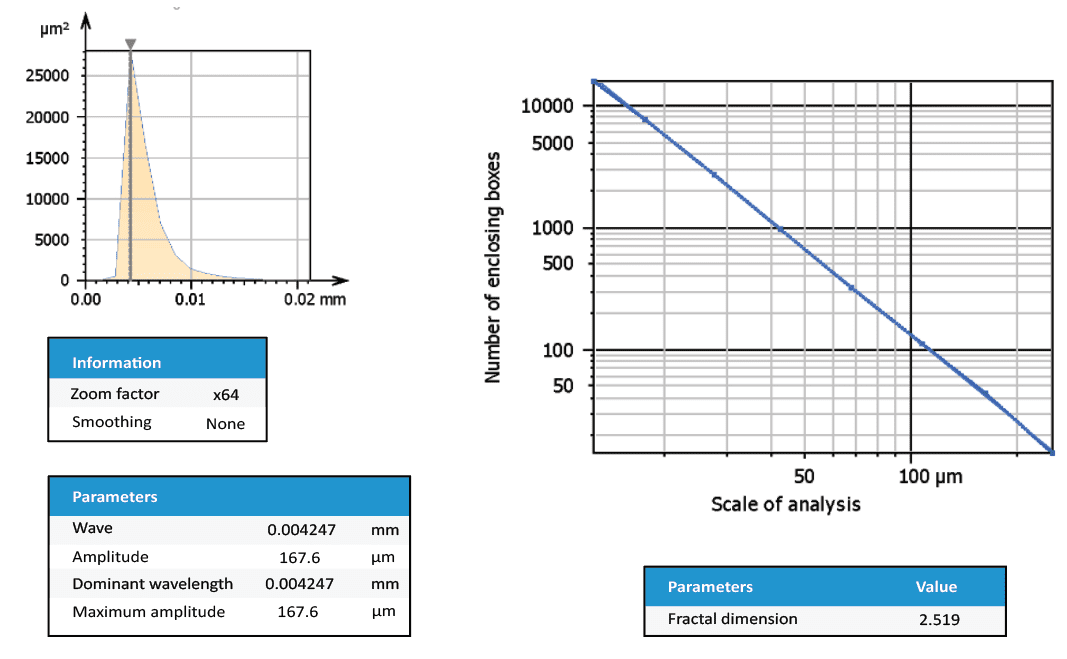
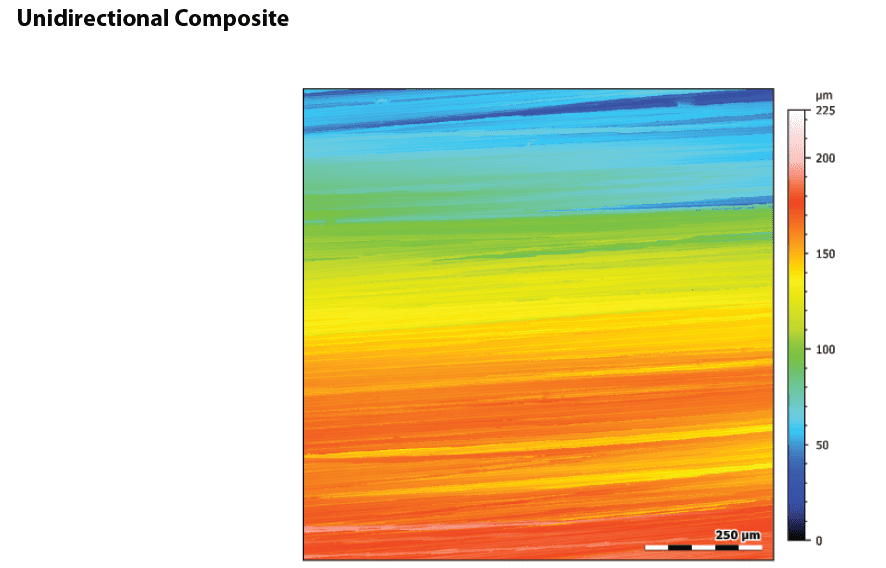
Isotropy shows directionality of the weave to determine expected property values. Our study shows how the bidirectional composite is ~60% isotropic as expected. Meanwhile, the unidirectional composite is ~13% isotropic due to the strong single fiber path direction fiber.
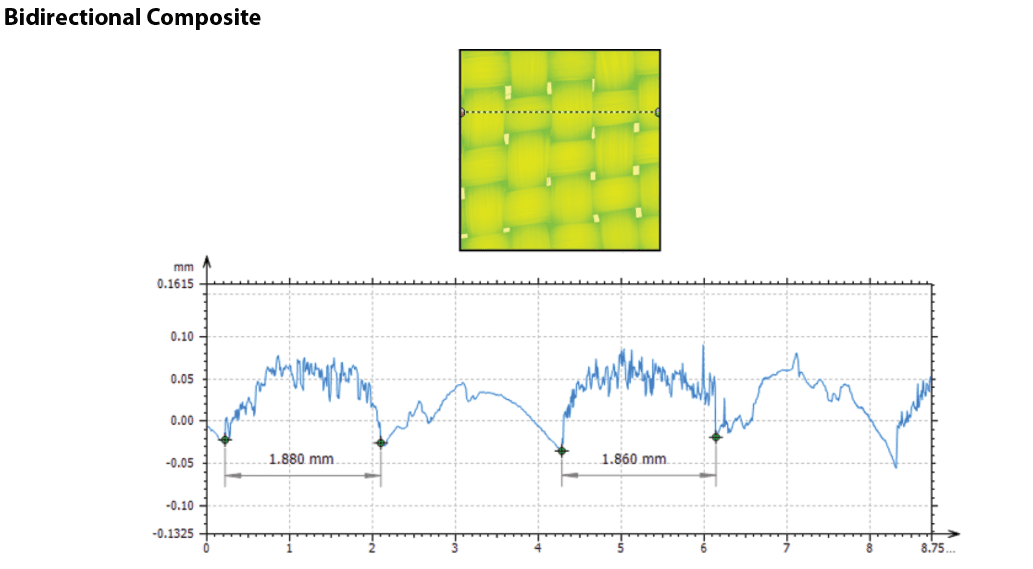
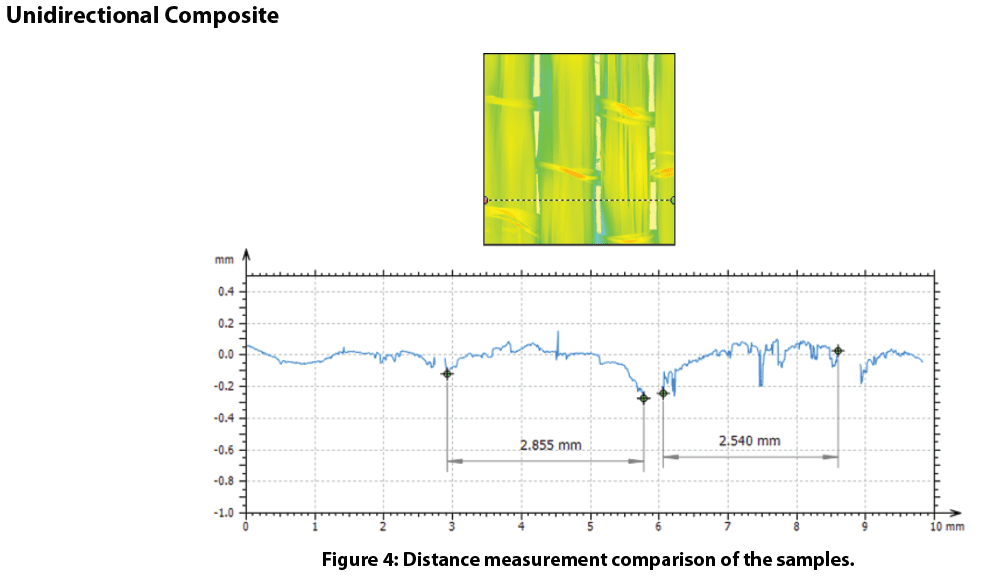
Weave size determines the consistency of packing and width of fibers used in the composite. Our study shows how easily we can measure weave size down to micron accuracy to ensure quality parts.
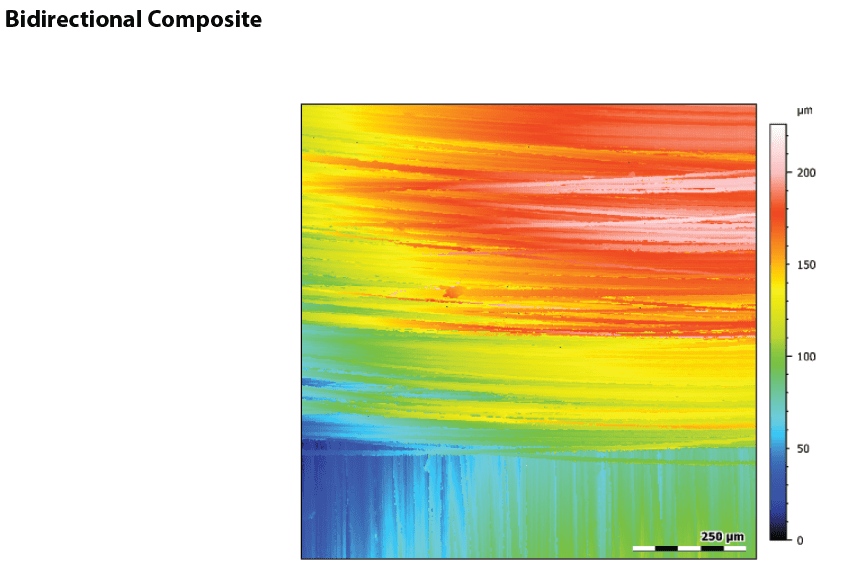
Texture analysis of the dominant wavelength suggests strand size for both composites are 4.27 microns thick. Fractal dimension analysis of the fiber surface determines smoothness to find how easily fibers will set in a matrix. The fractal dimension of the unidirectional fiber is higher than the bidirectional fiber which may affect the processing of composites.
Conclusion
In this application, we have shown the Nanovea HS2000L Non-Contact Profilometer precisely characterizes the fibrous surface of composite materials. We distinguished differences between weave types of carbon fiber with height parameters, isotropy, texture analysis, and distance measurements along with much more.
Our profilometer surface measurements precisely and quickly mitigate composite damage which decreases defects in parts, maximizing composite material capability. Nanovea’s 3D profilometer speed ranges from <1mm/s to 500mm/s for suitability in research applications to the needs of high-speed inspection. The Nanovea profilometer is the solution
to any composite measurement need.
NOW, LET'S TALK ABOUT YOUR APPLICATION
Biological Tissue Hardness Evaluation using Nanoindentation
Importance of Biological Tissue Nanoindentation
Traditional mechanical tests (hardness, adhesion, compression, puncture, yield strength, etc.) require greater precision and reliability in today’s quality control environments with a wide range of advanced materials from tissues to brittle materials. Traditional mechanical instrumentation fails to provide the sensitive load control and resolution required for advanced materials. The challenges associated with biomaterials require developing mechanical tests capable of accurate load control on extremely soft materials. These materials require very low sub mN testing loads with large depth range to ensure proper property measurement. In addition, many different mechanical test types can be performed on a single system allowing for greater functionality. This provides a range of important measurements on biomaterials including hardness, elastic modulus, loss and storage modulus, and creep in addition to scratch resistance and yield strength failure points.
Measurement Objective
In this application Nanovea’s mechanical tester in nanoindentation mode is used to study the hardness and elastic modulus of 3 separate areas of a biomaterial substitute on fat, light meat, and dark meat regions of prosciutto.
Nanoindentation is based on instrumented indentation standards ASTM E2546 and ISO 14577. It uses established methods where an indenter tip of known geometry is driven into a specific site of the test material with a controlled increasing normal load. When reaching a pre-set maximum depth, normal load is reduced until complete relaxation occurs. Load is applied by a piezo actuator and measured in a controlled loop with a high sensitivity load cell. During experiments the indenter position relative to the sample surface is monitored with a high precision capacitive sensor. The resulting load and displacement curves provide data specific to the mechanical nature of the tested material. Established models calculate quantitative hardness and modulus values with the measured data. Nanoindentation is suited to low load and penetration depth measurements at nanometer scales.
Results and Discussion
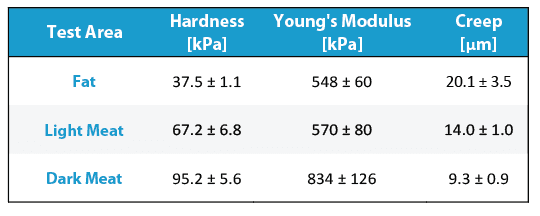
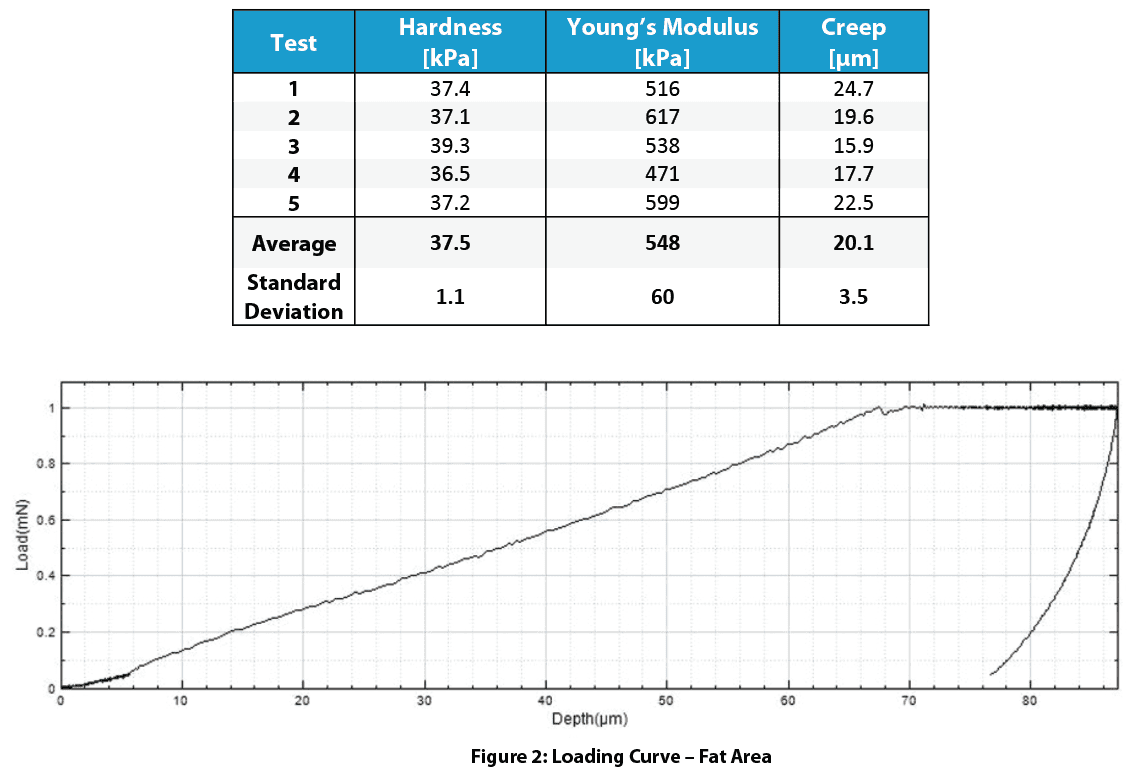
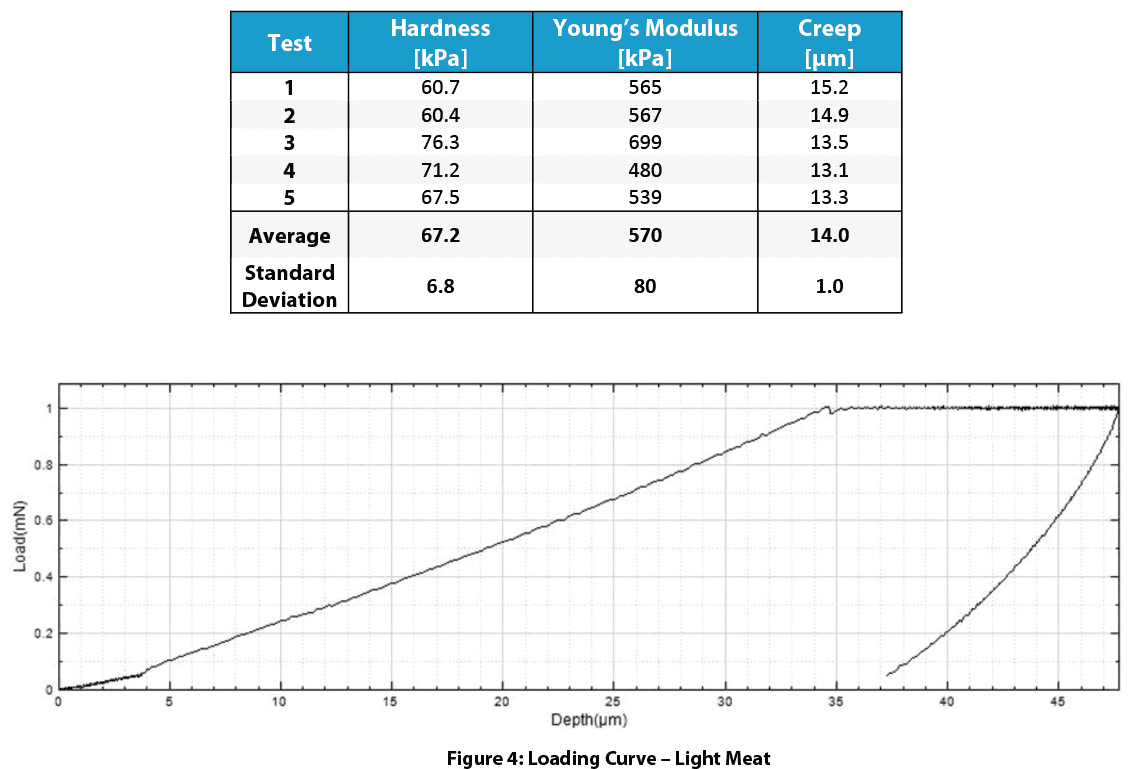
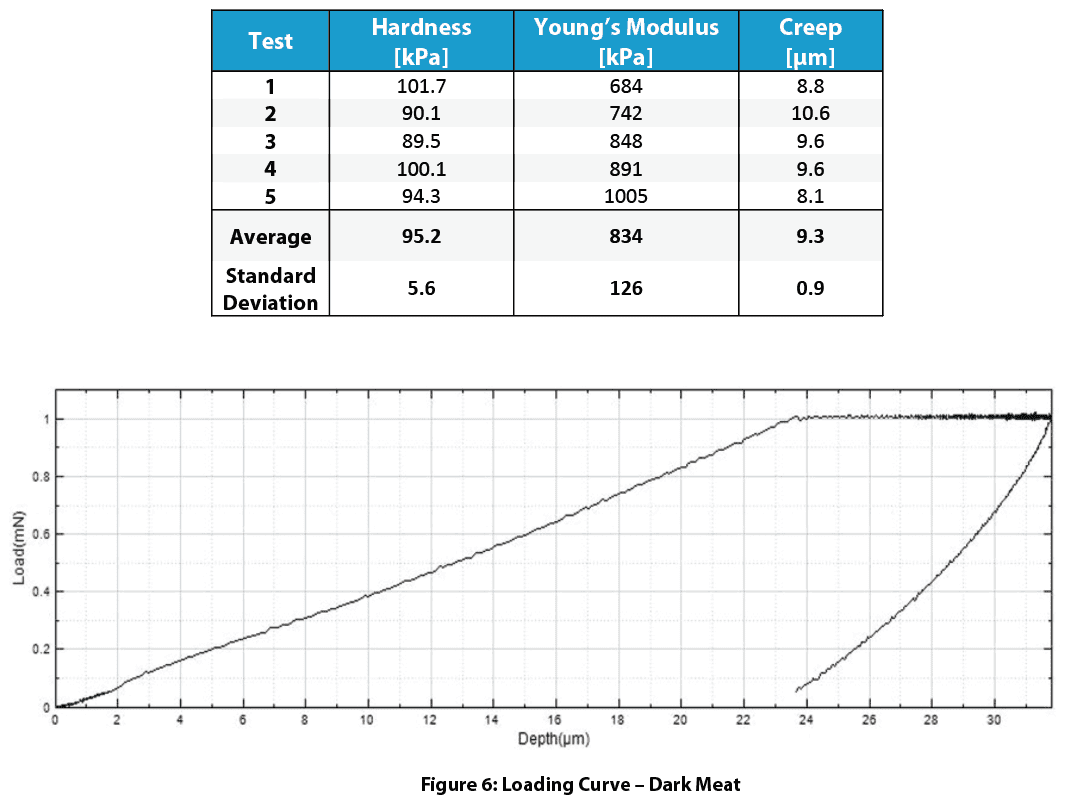
These tables below present measured values of hardness and Young’s modulus with averages and standard deviations. High surface roughness may cause large variations in the results due to small indentation size.
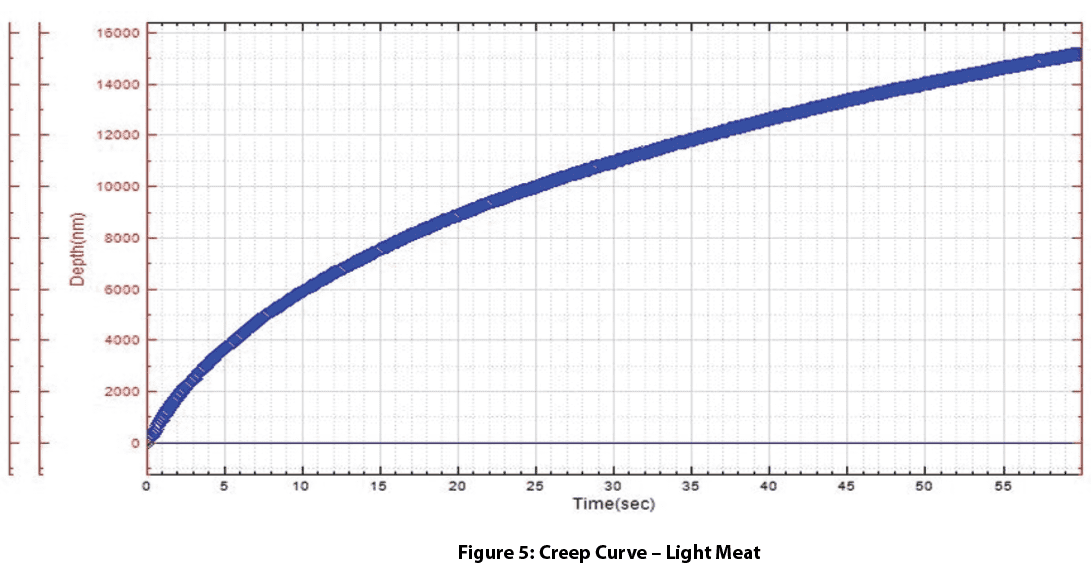
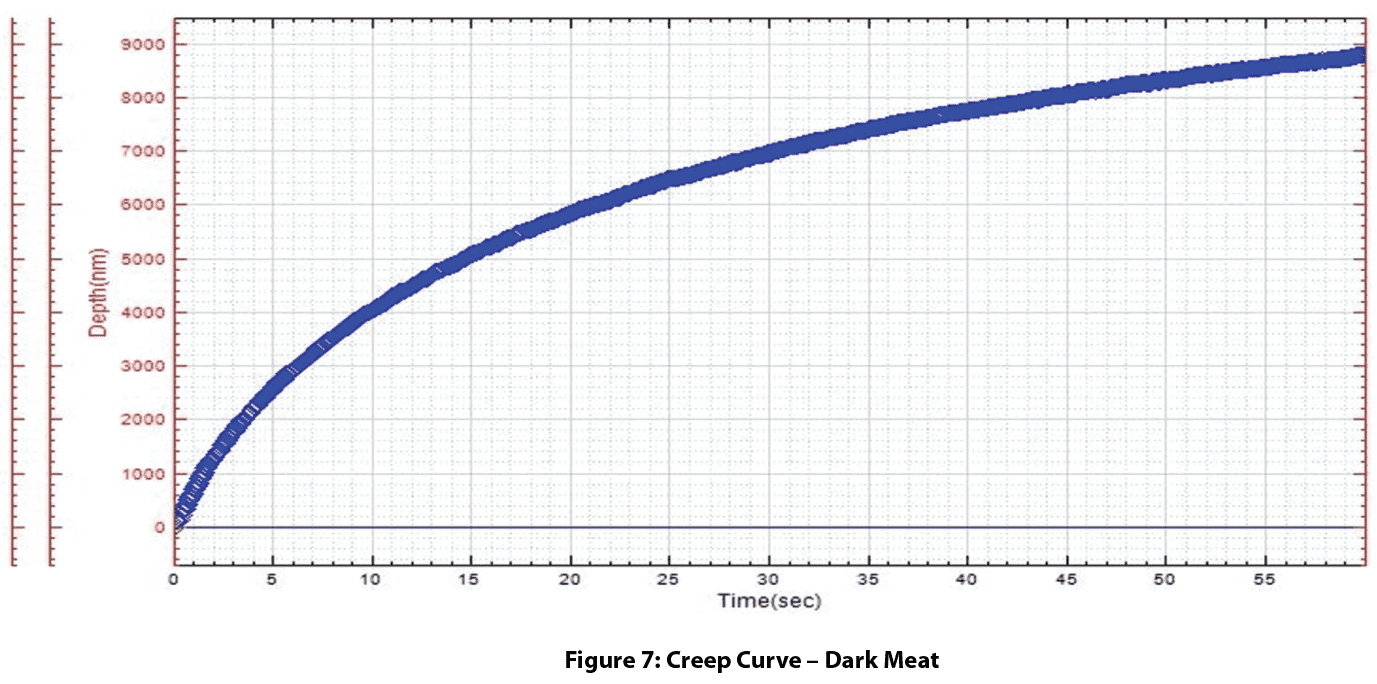
The fat area had about half the hardness of the meat areas. Meat treatment caused the darker meat area to be harder than the light meat area. Elastic modulus and hardness are in direct relation to mouth feel chewiness of the fat and meat areas. The fat and light meat area have creep continuing at a higher rate than the dark meat after 60 seconds.
Detailed Results – Fat
Detailed Results – Light Meat
Detailed Results – Dark Meat
Conclusion
In this application, Nanovea’s mechanical tester in nanoindentation mode reliably determined mechanical properties of the fat and meat areas while overcoming high sample surface roughness. This demonstrated the wide and unmatched capability of Nanovea’s mechanical tester. The system simultaneously provides precise mechanical property measurements on extremely hard materials and soft biological tissues.
The load cell in closed loop control with the piezo table ensures precise measurement of hard or soft gel materials from 1 to 5kPa. Using the same system, it is possible to test biomaterials at higher loads up to 400N. Multi-cycle loading can be used for fatigue testing and yield strength information in each zone can be obtained using a flat cylindrical diamond tip. In addition, with Dynamic Mechanical Analysis (DMA), the viscoelastic properties loss and storage moduli can be evaluated with high accuracy using the closed loop load control. Tests at various temperatures and under liquids are also available on the same system.
Nanovea’s mechanical tester continues to be the superior tool for biological and soft polymer/gel applications.
NOW, LET'S TALK ABOUT YOUR APPLICATION
Wear and Scratch Evaluation of Surface Treated Copper Wire
Importance of Wear and Scratch Evaluation of Copper Wire
Copper has a long history of use in electric wiring since the invention of the electromagnet and telegraph. Copper wires are applied in a wide range of electronic equipment such as panels, meters, computers, business machines, and appliances thanks to its corrosion resistance, solderability, and performance at elevated temperatures up to 150°C. Approximately half of all mined copper is used for manufacturing electrical wire and cable conductors.
Copper wire surface quality is critical to application service performance and lifetime. Micro defects in wires may lead to excessive wear, crack initiation and propagation, decreased conductivity, and inadequate solderability. Proper surface treatment of copper wires removes surface defects generated during wire drawing improving corrosion, scratch, and wear resistance. Many aerospace applications with copper wires require controlled behavior to prevent unexpected equipment failure. Quantifiable and reliable measurements are needed to properly evaluate the wear and scratch resistance of the copper wire surface.
Measurement Objective
In this application we simulate a controlled wear process of different copper wire surface treatments. Scratch testing measures the load required to cause failure on the treated surface layer. This study showcases the Nanovea Tribometer and Mechanical Tester as ideal tools for evaluation and quality control of electric wires.
Test Procedure and Procedures
Coefficient of friction (COF) and wear resistance of two different surface treatments on copper wires (Wire A and Wire B) were evaluated by the Nanovea tribometer using a linear reciprocating wear module. An Al₂O₃ ball (6 mm diameter) is the counter material used in this application. The wear track was examined using Nanovea’s 3D non-contact profilometer. Test parameters are summarized in Table 1.
A smooth Al₂O₃ ball as a counter material was used as an example in this study. Any solid material with different shape and surface finish can be applied using a custom fixture to simulate the actual application situation.
Results and Discussion
Wear of copper wire:
Figure 2 shows COF evolution of the copper wires during wear tests. Wire A shows a stable COF of ~0.4 throughout the wear test while wire B exhibits a COF of ~0.35 in the first 100 revolutions and progressively increases to ~0.4.
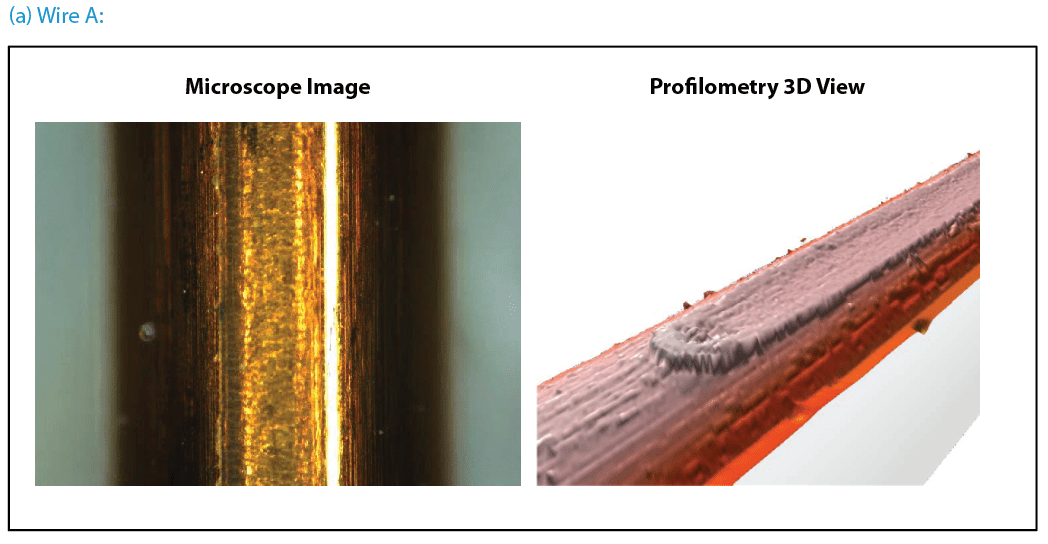
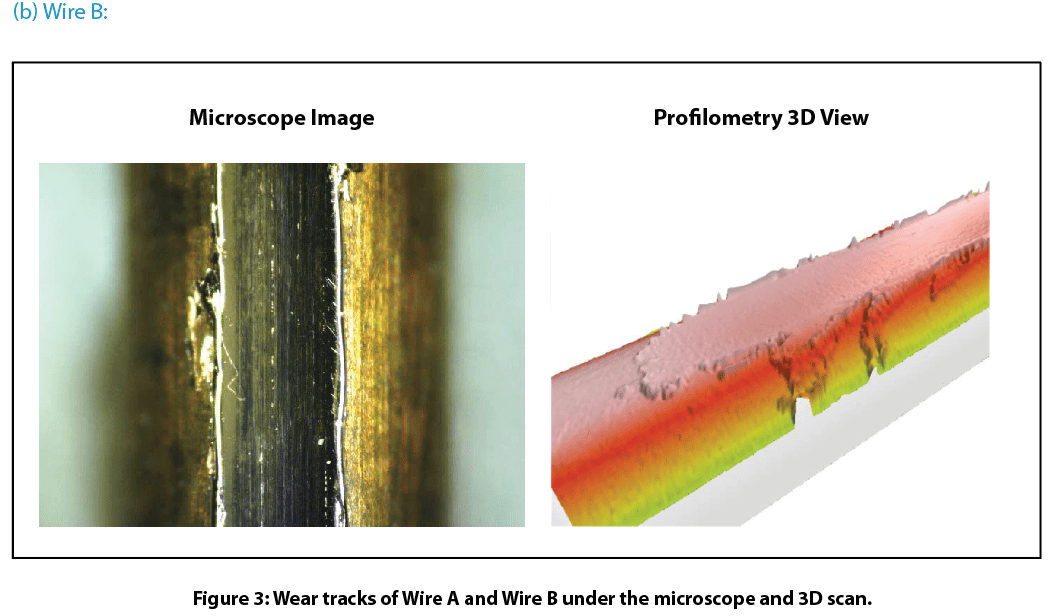
Figure 3 compares wear tracks of the copper wires after tests. Nanovea’s 3D non-contact profilometer offered superior analysis of the detailed morphology of wear tracks. It allows direct and accurate determination of the wear track volume by providing a fundamental understanding of the wear mechanism. Wire B’s surface has signi¬ficant wear track damage after a 600-revolution wear test. The profilometer 3D view shows the surface treated layer of Wire B removed completely which substantially accelerated the wear process. This left a flattened wear track on Wire B where copper substrate is exposed. This may result in significantly shortened lifespan of electrical equipment where Wire B is used. In comparison, Wire A exhibits relatively mild wear shown by a shallow wear track on the surface. The surface treated layer on Wire A did not remove like the layer on Wire B under the same conditions.
Scratch resistance of the copper wire surface:
Figure 4 shows the scratch tracks on the wires after testing. The protective layer of Wire A exhibits very good scratch resistance. It delaminates at a load of ~12.6 N. In comparison, the protective layer of Wire B failed at a load of ~1.0 N. Such a significant difference in scratch resistance for these wires contributes to their wear performance, where Wire A possesses substantially enhanced wear resistance. The evolution of normal force, COF, and depth during the scratch tests shown in Fig. 5 provides more insight on coating failure during tests.
Conclusion
In this controlled study we showcased the Nanovea’s tribometer conducting quantitative evaluation of wear resistance for surface treated copper wires and Nanovea’s mechanical tester providing reliable assessment of copper wire scratch resistance. Wire surface treatment plays a critical role in the tribo-mechanical properties during their lifetime. Proper surface treatment on Wire A significantly enhanced wear and scratch resistance, critical in the performance and lifespan of electrical wires in rough environments.
Nanovea’s tribometer offers precise and repeatable wear and friction testing using ISO and ASTM compliant rotative and linear modes, with optional high temperature wear, lubrication, and tribo-corrosion modules available in one pre-integrated system. Nanovea’s unmatched range is an ideal solution for determining the full range of tribological properties of thin or thick, soft or hard coatings, films, and substrates.
NOW, LET'S TALK ABOUT YOUR APPLICATION
Yield and Tensile Strength of Steel and Aluminum
Importance of Yield Strength and Ultimate Tensile Strength Measurement using Indentation
Traditionally Yield Strength and Ultimate Tensile Strength have been tested using a large tensile testing machine requiring enormous strength to pull apart test specimens. It is costly and time-consuming to properly machine many test coupons for a material where each sample can only be tested once. Small defects in the sample create a noticeable variance in test results. Different configurations and alignments of the tensile testers in the market often result in substantial variations in testing mechanics and outcomes.
Measurement Objective
In this application, the Nanovea Mechanical Tester measures the Yield Strength and Ultimate Tensile Strength of stainless steel SS304 and aluminum Al6061 metal alloy samples. The samples were chosen for their commonly recognized Yield Strength and Ultimate Tensile Strength values showing the reliability of Nanovea’s indentation methods.
Test Procedure and Procedures
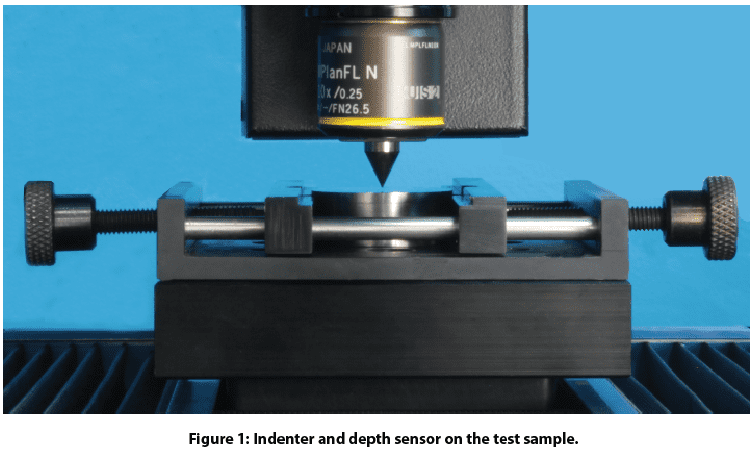
The Yield Strength and Ultimate Tensile Strength tests were performed on the Nanovea Mechanical Tester in the Microindentation mode. A cylindrical flat diamond tip of 200 μm diameter was used for this application. SS304 and Al6061 alloys were selected for their extensive industrial application and commonly recognized Yield Strength and Ultimate Tensile Strength values, in order to show the great potential and reliability of the indentation method. Samples were mechanically polished to a mirror-like finish before testing to avoid surface roughness or defect influence on test results. Test conditions are listed in Table 1. More than ten tests were performed on each sample to ensure the repeatability of the test values.
Results and Discussion
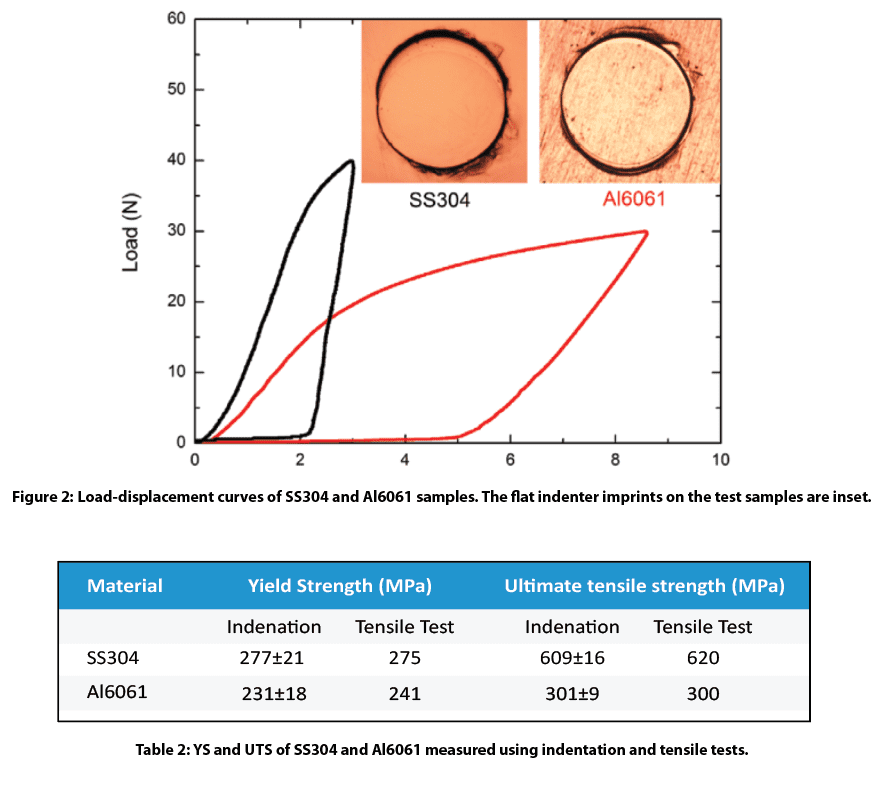
Load-displacement curves of the SS304 and Al6061 alloy samples are shown in Figure 3 with the flat indenter imprints on the test samples inset. Analysis of the “S” shaped loading curve using special algorithms developed by Nanovea calculates Yield Strength and Ultimate Tensile Strength . Values are automatically calculated by the software as summarized in Table 1. Yield Strength and Ultimate Tensile Strength values obtained by conventional tensile tests are listed for comparison.
Conclusion
In this study, we showcased the capacity of Nanovea Mechanical Tester in evaluating Yield Strength & Ultimate Tensile Strength of stainless steel and aluminum alloy sheet samples. The simple experimental setup significantly cuts the time and cost for sample preparation required for tensile tests. The small indentation size makes it possible to perform multiple measurements on one single sample. This method allows YS/UTS measurements on small samples and localized areas, providing a solution for YS/UTS mapping and local defect detection of pipelines or auto structure.
The Nano, Micro or Macro modules of the Nanovea Mechanical Tester all include ISO and ASTM compliant indentation, scratch and wear tester modes, providing the widest and most user friendly range of testing available in a single system. Nanovea’s unmatched range is an ideal solution for determining the full range of mechanical properties of thin or thick, soft or hard coatings, films and substrates, including hardness, Young’s modulus, fracture toughness, adhesion, wear resistance and many others. In addition, optional 3D non-contact profiler and AFM Module are available for high resolution 3D imaging of indentation, scratch and wear track in addition to other surface measurements such as roughness.
NOW, LET'S TALK ABOUT YOUR APPLICATION
Dynamic Load Tribology
Introduction
Wear takes place in virtually every industrial sector and imposes costs of ~0.75% of the GDP1. Tribology research is vital in improving production efficiency, application performance, as well as conservation of material, energy, and the environment. Vibration and oscillation inevitably occur in a wide range of tribological applications. Excessive external vibration accelerates the wear process and reduces service performance which leads to catastrophic failures to the mechanical parts.
Conventional dead load tribometers apply normal loads by mass weights. Such a loading technique not only limits the loading options to a constant load, but it also creates intense uncontrolled vibrations at high loads and speeds leading to limited and inconsistent wear behavior assessments. A reliable evaluation of the effect of controlled oscillation on the wear behavior of materials is desirable for R&D and QC in different industrial applications.
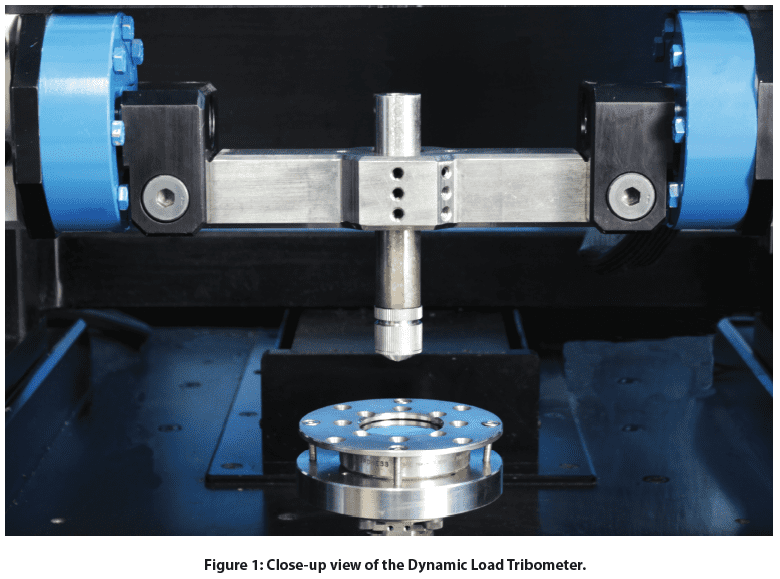
Nanovea’s groundbreaking high load tribometer has a maximum load capacity of 2000 N with a dynamic load control system. The advanced pneumatic compressed air loading system enables users to evaluate the tribological behavior of a material under high normal loads with the advantage of damping undesired vibration created during the wear process. Therefore, the load is measured directly with no need for buffer springs used in older designs. A parallel electromagnet oscillating loading module applies well-controlled oscillation of desired amplitude up to 20 N and frequency up to 150 Hz.
Friction is measured with high accuracy directly from the side force applied to the upper holder. The displacement is monitored in situ, providing insight into the evolution of the wear behavior of the test samples. The wear test under controlled oscillation loading can also be performed in corrosion, high temperature, humidity, and lubrication environments to simulate the real work conditions for the tribological applications. An integrated high-speed non-contact profilometer automatically measures the wear track morphology and wear volume in a few seconds.
Measurement Objective
In this study, we showcase the capacity of the Nanovea T2000 Dynamic Load Tribometer in studying the tribological behavior of different coating and metal samples under controlled oscillation loading conditions.
Test Procedure
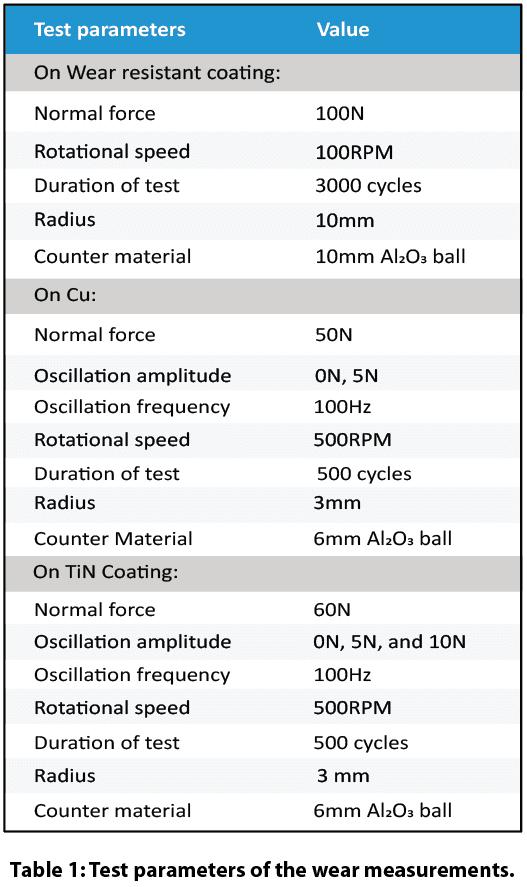
The tribological behavior, e.g. coefficient of friction, COF, and wear resistance of a 300 µm thick wear-resistant coating was assessed and compared by the Nanovea T2000 Tribometer with a conventional dead load tribometer using a pin on disk setup following ASTM G992.
Separate Cu and TiN coated samples against a 6 mm Al₂0₃ ball under controlled oscillation were evaluated by Dynamic Load Tribology Mode of the Nanovea T2000 Tribometer.
The test parameters are summarized in Table 1.
The integrated 3D profilometer equipped with a line sensor automatically scans the wear track after the tests, providing the most accurate wear volume measurement in seconds.
Results and Discussion
Pneumatic loading system vs. Dead load system
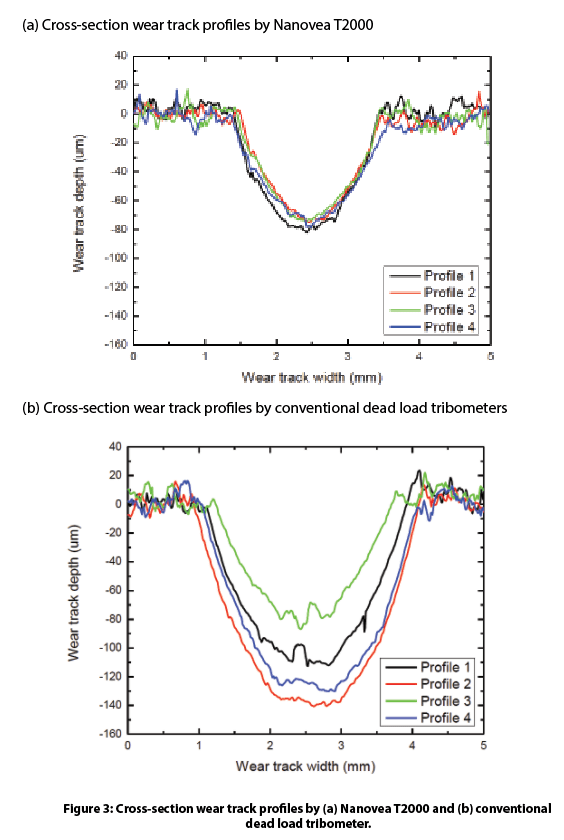
The tribological behavior of a wear-resistant coating using Nanovea T2000 Tribometer is compared to a conventional dead load (DL) tribometer. The evolution of the COF of the coating are shown in Fig. 2. We observe the coating exhibits a comparable COF value of ~0.6 during the wear test. However, the 20 cross-section profiles at different locations of the wear track in Fig. 3 indicate that the coating experienced much more severe wear under the dead load system.
Intense vibrations were generated by the wear process of the dead load system at high load and speed. The massive concentrated pressure at the contact face combined with a high sliding speed creates substantial weight and structure vibration leading to accelerated wear. The conventional dead load tribometer applies load using mass weights. This method is reliable at lower contact loads under mild wear conditions; however, under aggressive wear conditions at higher loads and speeds, the significant vibration causes the weights to bounce repeatedly, resulting in an uneven wear track causing unreliable tribological evaluation. The calculated wear rate is 8.0±2.4 x 10⁻⁴ mm3/N m, showing a high wear rate and large standard deviation.
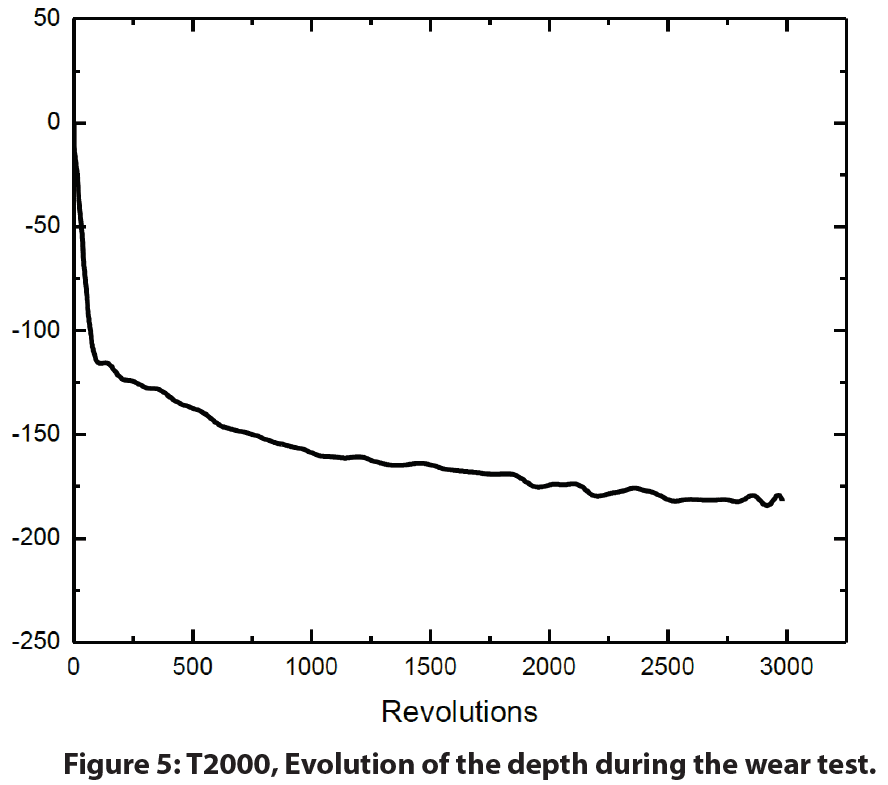
The Nanovea T2000 tribometer is designed with a dynamic control loading system to dampen the oscillations. It applies the normal load with compressed air which minimizes undesired vibration created during the wear process. In addition, active closed loop loading control ensures a constant load is applied throughout the wear test and the stylus follows the depth change of the wear track. A significantly more consistent wear track profile is measured as shown in Fig. 3a, resulting in a low wear rate of 3.4±0.5 x 10⁻⁴ mm3/N m.
The wear track analysis shown in Fig. 4 confirms the wear test performed by the pneumatic compressed air loading system of the Nanovea T2000 Tribometer creates a smoother and more consistent wear track compared to the conventional dead load tribometer. In addition, the Nanovea T2000 tribometer measures stylus displacement during the wear process providing further insight into the progress of the wear behavior in situ.
Controlled Oscillation on Wear of the Cu sample
The parallel oscillating loading electromagnet module of the Nanovea T2000 Tribometer enables users to investigate the effect of controlled amplitude and frequency oscillations on the wear behavior of materials. The COF of the Cu samples is recorded in situ as shown in Fig. 6. The Cu sample exhibits a constant COF of ~0.3 during the first 330-revolution measurement, signifying the formation of a stable contact at the interface and relatively smooth wear track. As the wear test continues, the variation of the COF indicates a change in the wear mechanism. In comparison, the wear tests under a 5 N amplitude-controlled oscillation at 50 N exhibits a different wear behavior: the COF increases promptly at the beginning of the wear process, and shows significant variation throughout the wear test. Such behavior of COF indicates that the imposed oscillation in the normal load plays a role in the unstable sliding state at the contact.
Fig. 7 compares the wear track morphology measured by the integrated non-contact optical profilometer. It can be observed that the Cu sample under a controlled oscillation amplitude of 5 N exhibits a much larger wear track with a volume of 1.35 x 109 µm3, compared to 5.03 x 108 µm3 under no imposed oscillation. The controlled oscillation significantly accelerates the wear rate by a factor of ~2.7, showing the critical effect of oscillation on wear behavior.
Controlled Oscillation on Wear of the TiN Coating
The COF and wear tracks of the TiN coating sample are shown in Fig. 8. The TiN coating exhibits significantly different wear behaviors under oscillation as indicated by the evolution of COF during the tests. The TiN coating shows a constant COF of ~0.3 following the run-in period at the beginning of the wear test, due to the stable sliding contact at the interface between the TiN coating and the Al₂O₃ ball. However, when the TiN coating starts to fail, the Al₂O₃ ball penetrates through the coating and slides against the fresh steel substrate underneath. A significant amount of hard TiN coating debris is generated in the wear track at the same time, turning a stable two-body sliding wear into three-body abrasion wear. Such a change of the material couple characteristics leads to the increased variations in the evolution of COF. The imposed 5 N and 10 N oscillation accelerates the TiN coating failure from ~400 revolutions to below 100 revolutions. The larger wear tracks on the TiN coating samples after the wear tests under the controlled oscillation is in agreement with such a change in COF.
The advanced pneumatic loading system of the Nanovea T2000 Tribometer possesses an intrinsic advantage as a naturally quick vibration damper compared to traditional dead load systems. This technological advantage of pneumatic systems is true compared to load-controlled systems that use a combination of servo motors and springs to apply the load. The technology ensures reliable and better-controlled wear evaluation at high loads as demonstrated in this study. In addition, the active closed loop loading system can change the normal load to a desired value during wear tests to simulate real-life applications seen in brake systems.
Instead of having influence from uncontrolled vibration conditions during tests, we have shown the Nanovea T2000 Dynamic-Load Tribometer enables users to quantitatively assess the tribological behaviors of materials under different controlled oscillation conditions. Vibrations play a significant role in the wear behavior of metal and ceramic coating samples.
The parallel electromagnet oscillating loading module provides precisely controlled oscillations at set amplitudes and frequencies, allowing users to simulate the wear process under real-life conditions when environmental vibrations are often an important factor. In the presence of imposed oscillations during wear, both the Cu and the TiN coating samples exhibit substantially increased wear rate. The evolution of the coefficient of friction and stylus displacement measured in situ are important indicators for the performance of the material during the tribological applications. The integrated 3D non-contact profilometer offers a tool to precisely measure the wear volume and analyze the detailed morphology of the wear tracks in seconds, providing more insight into the fundamental understanding of wear mechanism.
The T2000 is equipped with a self-tuned, high-quality, and high torque motor with a 20-bit internal speed and a 16-bit external position encoder. It enables the tribometer to provide an unmatched range of rotational speeds from 0.01 to 5000 rpm that can change in stepwise jumps or at continuous rates. Contrary to systems that use a bottom located torque sensor, the Nanovea Tribometer uses a top located high-precision load cell to accurately and separately measure friction forces.
Nanovea Tribometers offers precise and repeatable wear and friction testing using ISO and ASTM compliant rotative and linear modes (including 4ball, thrust washer, and block on ring tests), with optional high-temperature wear, lubrication and tribo-corrosion modules available in one pre-integrated system. Nanovea T2000’s unmatched range is an ideal solution for determining the full range of tribological properties of thin or thick, soft or hard coatings, films, and substrates.
NOW, LET'S TALK ABOUT YOUR APPLICATION
Paint Orange Peel Texture Analysis using 3D Profilometry
Introduction
The size and frequency of surface structures on substrates affect the quality of gloss coatings. Paint orange peel texture, named after its appearance, can develop from substrate influence and paint application technique. Texture problems are commonly quantified by waviness, wavelength, and the visual effect they have on gloss coatings. The smallest textures result in gloss reduction while larger textures result in visible ripples on the coated surface. Understanding the development of these textures and its relation to substrates and techniques are critical to quality control.
Importance of Profilometry for Texture Measurement
Unlike traditional 2D instruments used to measure gloss texture, 3D non-contact measurement quickly provides a 3D image used to understand surface characteristics with the added ability to quickly investigate areas of interest. Without speed and 3D review, a quality control environment would solely rely on 2D information that gives little predictability of the entire surface. Understanding textures in 3D allows for the best selection of processing and control measures. Assuring quality control of such parameters heavily relies on quantifiable, reproducible, and reliable inspection. Nanovea 3D Non-Contact Profilometers utilize chromatic confocal technology to have the unique capability to measure the steep angles found during fast measurement. Nanovea Profilometers succeed where other techniques fail to provide reliable data due to probe contact, surface variation, angle, or reflectivity.
Measurement Objective
In this application, the Nanovea HS2000L measures the paint orange peel texture of a gloss paint. There are endless surface parameters automatically calculated from the 3D surface scan. Here we analyze a scanned 3D surface by quantifying the characteristics of the paint orange peel texture.
The Nanovea HS2000L quantified isotropy and height parameters of the orange peel paint. The orange peel texture quantified the random pattern direction with 94.4% isotropy. Height parameters quantify the texture with a 24.84µm height difference.
The bearing ratio curve in Figure 4 is a graphical representation of the depth distribution. This is an interactive feature within the software that allows the user to view distributions and percentages at varying depths. An extracted profile in Figure 5 gives useful roughness values for the orange peel texture. Peak extraction above a 144 micron threshold shows the orange peel texture. These parameters are easily adjusted to other areas or parameters of interest.
Conclusion
In this application, the Nanovea HS2000L 3D Non-Contact Profilometer precisely characterizes both topography and nanometer details of the paint orange peel texture on a gloss coating. Areas of interest from 3D surface measurements are quickly identified and analyzed with many useful measurements (Dimension, Roughness Finish Texture, Shape Form Topography, Flatness Warpage Planarity, Volume Area, Step-Height, etc.). Quickly chosen 2D cross-sections provide a complete set of surface measurement resources on gloss texture. Special areas of interest can be further analyzed with an integrated AFM module. Nanovea 3D Profilometer’s speed ranges from <1 mm/s to 500 mm/s for suitability in research applications to the needs of high-speed inspection. Nanovea 3D Profilometers have a wide range of configurations to suit your application.
NOW, LET'S TALK ABOUT YOUR APPLICATION
Categorías
- Application Notes
- Block on Ring Tribology
- Corrosion Tribology
- Friction Testing | Coefficient of Friction
- High Temperature Mechanical Testing
- High Temperature Tribology
- Humidity and Gases Tribology
- Humidity Mechanical Testing
- Indentation | Creep and Relaxation
- Indentation | Fracture Toughness
- Indentation | Hardness and Elastic
- Indentation | Loss and Storage
- Indentation | Stress vs Strain
- Indentation | Yield Strength and Fatigue
- Laboratory Testing
- Linear Tribology
- Liquid Mechanical Testing
- Liquid Tribology
- Low Temperature Tribology
- Mechanical Testing
- Press Release
- Profilometry | Flatness and Warpage
- Profilometry | Geometry and Shape
- Profilometry | Roughness and Finish
- Profilometry | Step Height and Thickness
- Profilometry | Texture and Grain
- Profilometry | Volume and Area
- Profilometry Testing
- Ring on Ring Tribology
- Rotational Tribology
- Scratch Testing | Adhesive Failure
- Scratch Testing | Cohesive Failure
- Scratch Testing | Multi-Pass Wear
- Scratch Testing | Scratch Hardness
- Scratch Testing Tribology
- Tradeshow
- Tribology Testing
- Uncategorized
Archivos
- septiembre 2023
- agosto 2023
- junio 2023
- mayo 2023
- julio 2022
- mayo 2022
- abril 2022
- enero 2022
- diciembre 2021
- noviembre 2021
- octubre 2021
- septiembre 2021
- agosto 2021
- julio 2021
- junio 2021
- mayo 2021
- marzo 2021
- febrero 2021
- diciembre 2020
- noviembre 2020
- octubre 2020
- septiembre 2020
- julio 2020
- mayo 2020
- abril 2020
- marzo 2020
- febrero 2020
- enero 2020
- noviembre 2019
- octubre 2019
- septiembre 2019
- agosto 2019
- julio 2019
- junio 2019
- mayo 2019
- abril 2019
- marzo 2019
- enero 2019
- diciembre 2018
- noviembre 2018
- octubre 2018
- septiembre 2018
- julio 2018
- junio 2018
- mayo 2018
- abril 2018
- marzo 2018
- febrero 2018
- noviembre 2017
- octubre 2017
- septiembre 2017
- agosto 2017
- junio 2017
- mayo 2017
- abril 2017
- marzo 2017
- febrero 2017
- enero 2017
- noviembre 2016
- octubre 2016
- agosto 2016
- julio 2016
- junio 2016
- mayo 2016
- abril 2016
- marzo 2016
- febrero 2016
- enero 2016
- diciembre 2015
- noviembre 2015
- octubre 2015
- septiembre 2015
- agosto 2015
- julio 2015
- junio 2015
- mayo 2015
- abril 2015
- marzo 2015
- febrero 2015
- enero 2015
- noviembre 2014
- octubre 2014
- septiembre 2014
- agosto 2014
- julio 2014
- junio 2014
- mayo 2014
- abril 2014
- marzo 2014
- febrero 2014
- enero 2014
- diciembre 2013
- noviembre 2013
- octubre 2013
- septiembre 2013
- agosto 2013
- julio 2013
- junio 2013
- mayo 2013
- abril 2013
- marzo 2013
- febrero 2013
- enero 2013
- diciembre 2012
- noviembre 2012
- octubre 2012
- septiembre 2012
- agosto 2012
- julio 2012
- junio 2012
- mayo 2012
- abril 2012
- marzo 2012
- febrero 2012
- enero 2012
- diciembre 2011
- noviembre 2011
- octubre 2011
- septiembre 2011
- agosto 2011
- julio 2011
- junio 2011
- mayo 2011
- noviembre 2010
- enero 2010
- abril 2009
- marzo 2009
- enero 2009
- diciembre 2008
- octubre 2008
- agosto 2007
- julio 2006
- marzo 2006
- enero 2005
- abril 2004