Medición de límites superficiales
Medición de límites superficiales mediante perfilometría 3D
Más información
MEDICIÓN DE LÍMITES DE SUPERFICIE
UTILIZANDO LA PERFILOMETRÍA 3D

Preparado por
Craig Leising
INTRODUCCIÓN
En estudios en los que se evalúa la orientación de las características, patrones, formas, etc. de la interfaz de la superficie, resulta útil identificar rápidamente las áreas de interés en todo el perfil de medición. Al segmentar una superficie en áreas significativas, el usuario puede evaluar rápidamente los límites, picos, hoyos, áreas, volúmenes y muchos otros elementos para comprender su función en todo el perfil de la superficie objeto de estudio. Por ejemplo, al igual que en la imagen de los límites de grano de los metales, la importancia del análisis radica en la interfaz de muchas estructuras y su orientación general. Al comprender cada área de interés, se pueden identificar los defectos y/o anomalías dentro del área general. Aunque la imagen de los límites de grano se estudia normalmente en un rango que supera la capacidad del perfilómetro, y solo se trata de un análisis de imágenes en 2D, es una referencia útil para ilustrar el concepto de lo que se mostrará aquí a mayor escala, junto con las ventajas de la medición de superficies en 3D.
IMPORTANCIA DEL PERFILÓMETRO 3D SIN CONTACTO PARA EL ESTUDIO DE LA SEPARACIÓN DE SUPERFICIES
A diferencia de otras técnicas, como las sondas táctiles o la interferometría, el Perfilómetro 3D sin contacto, mediante el cromatismo axial, puede medir casi cualquier superficie, los tamaños de las muestras pueden variar ampliamente debido a la disposición abierta y no es necesario preparar las muestras. Se obtiene un rango de nano a macro durante la medición del perfil de la superficie sin influencia alguna de la reflectividad o absorción de la muestra, tiene una capacidad avanzada para medir ángulos de superficie elevados y no hay manipulación de los resultados por parte del software. Mida fácilmente cualquier material: transparente, opaco, especular, difusivo, pulido, rugoso, etc. La técnica del perfilómetro sin contacto proporciona una capacidad ideal, amplia y fácil de usar para maximizar los estudios de superficie cuando se necesita un análisis de los límites de la superficie, junto con las ventajas de la capacidad combinada de 2D y 3D.
OBJETIVO DE MEDICIÓN
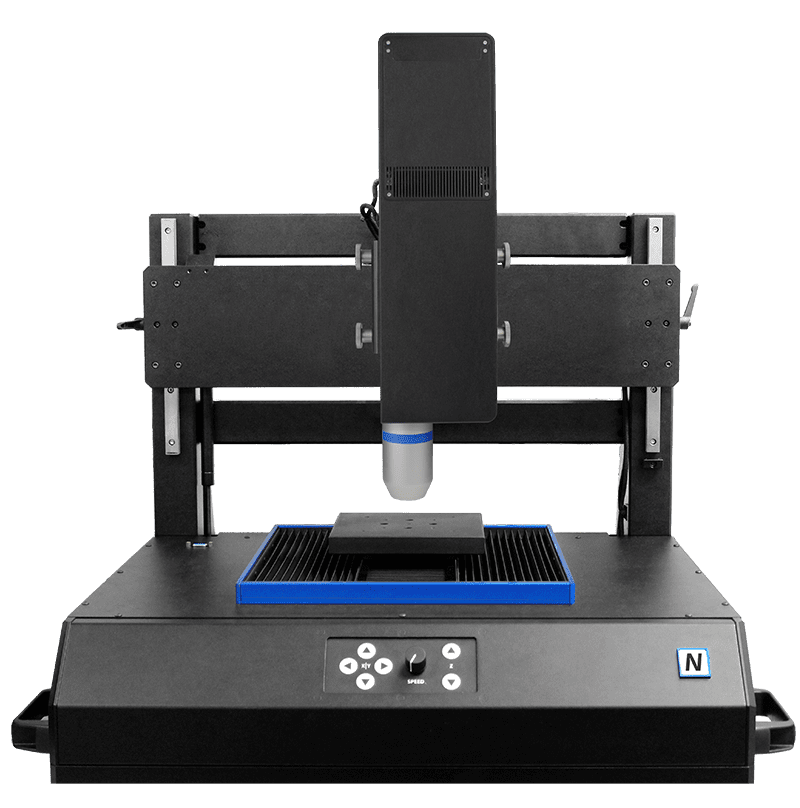
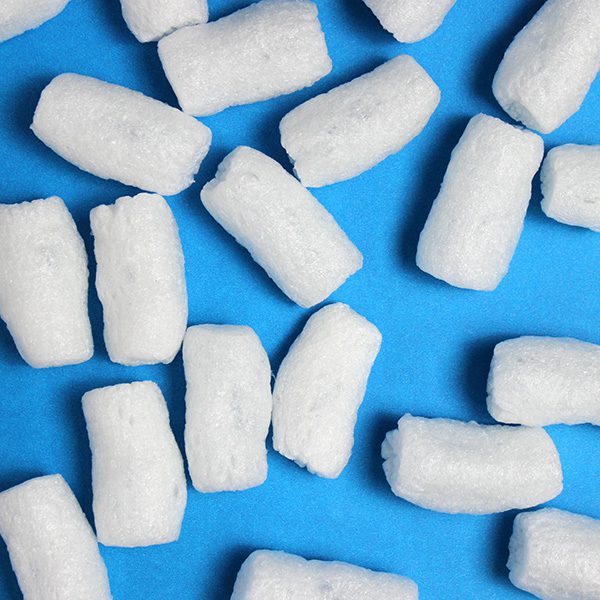
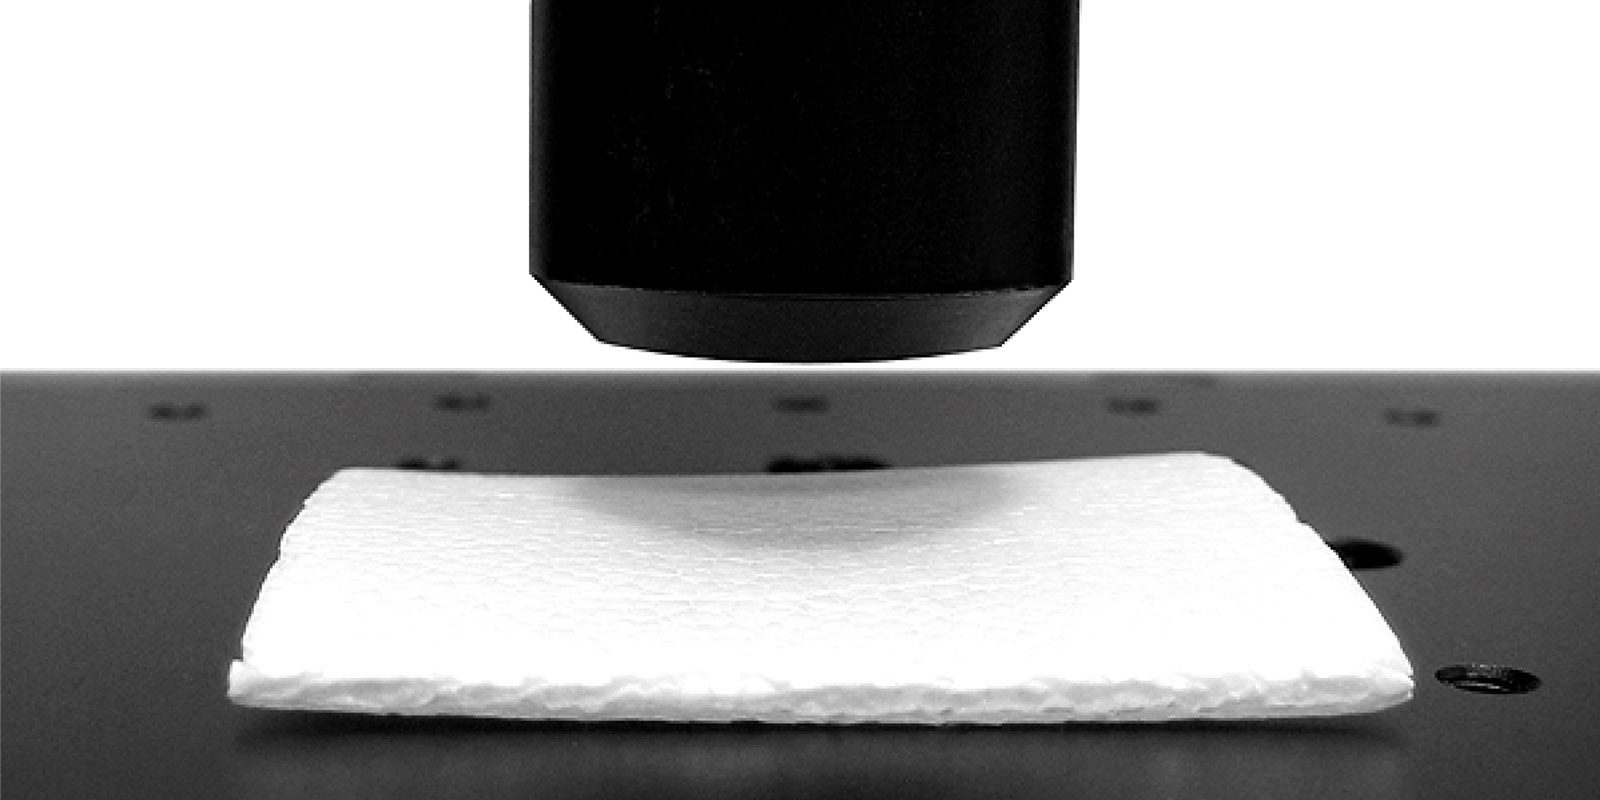
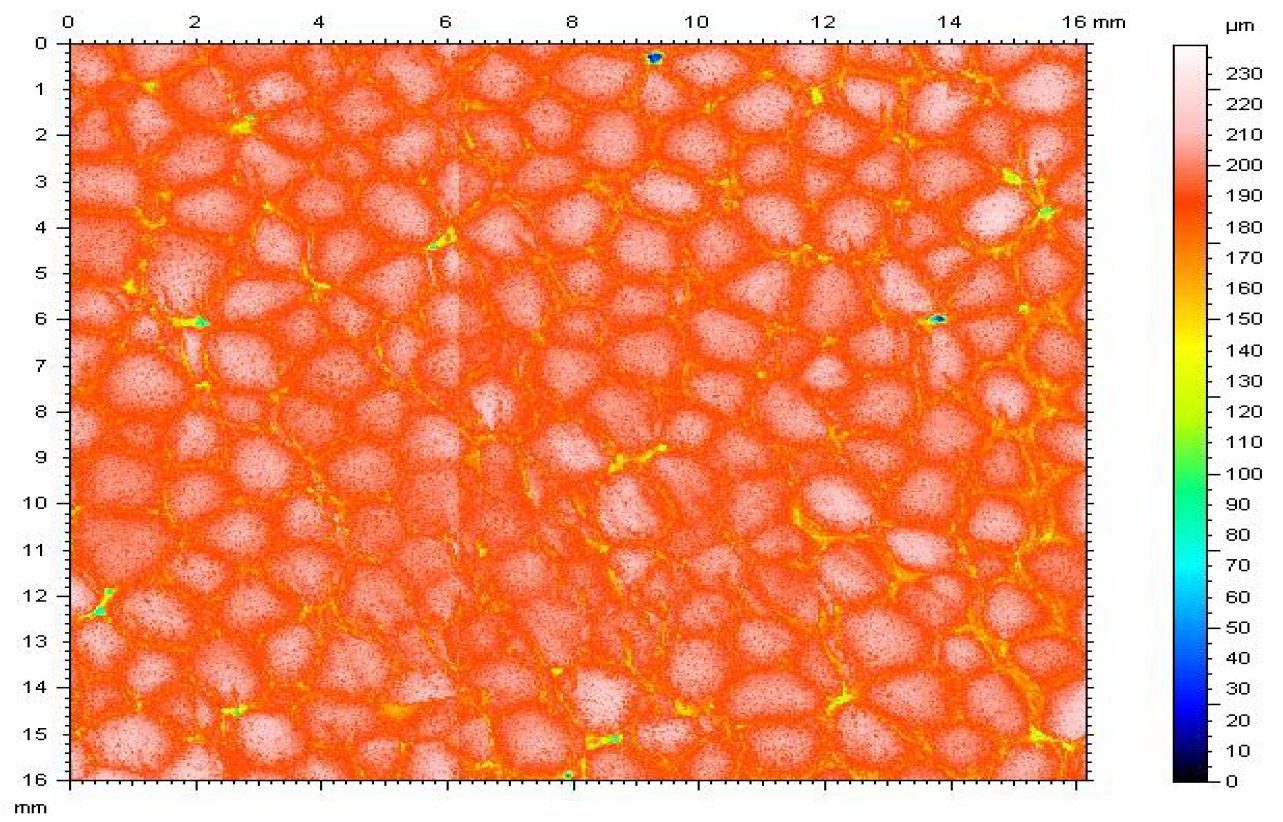
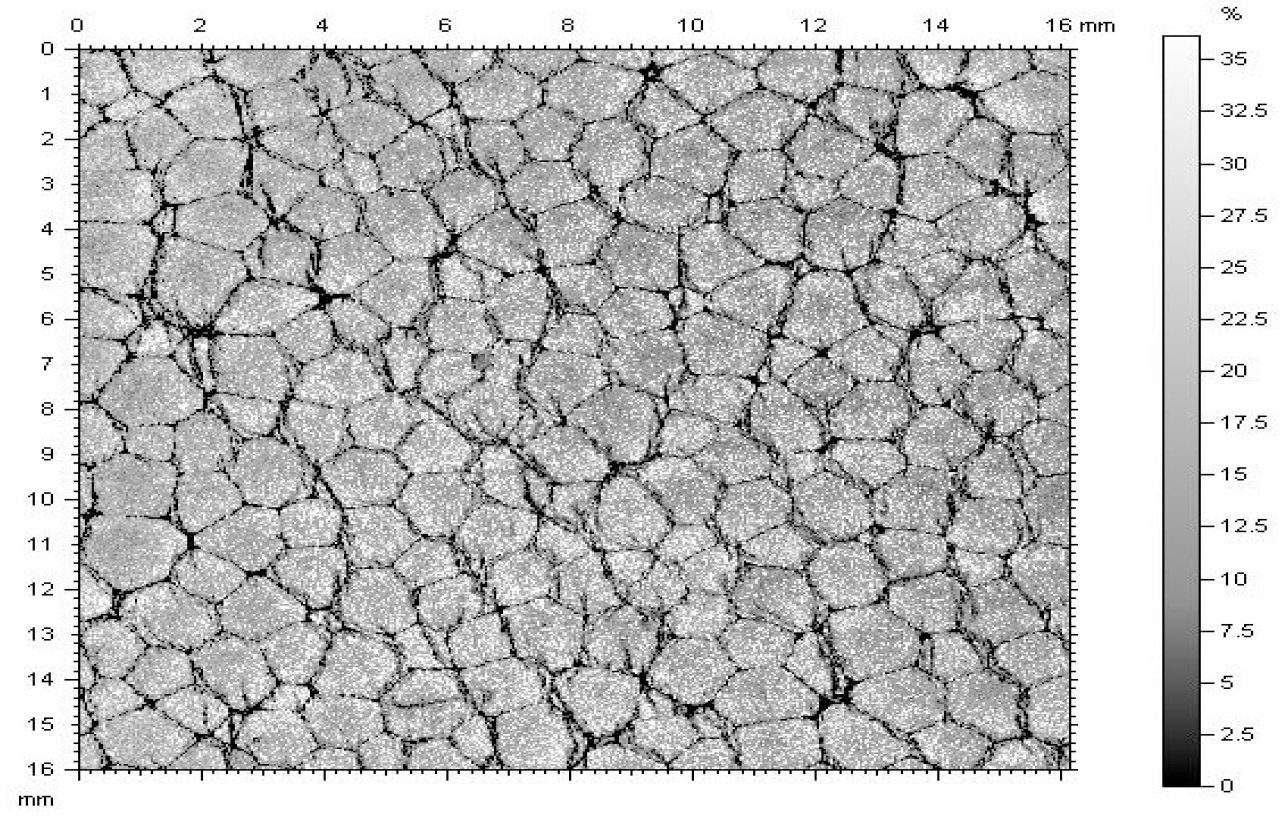
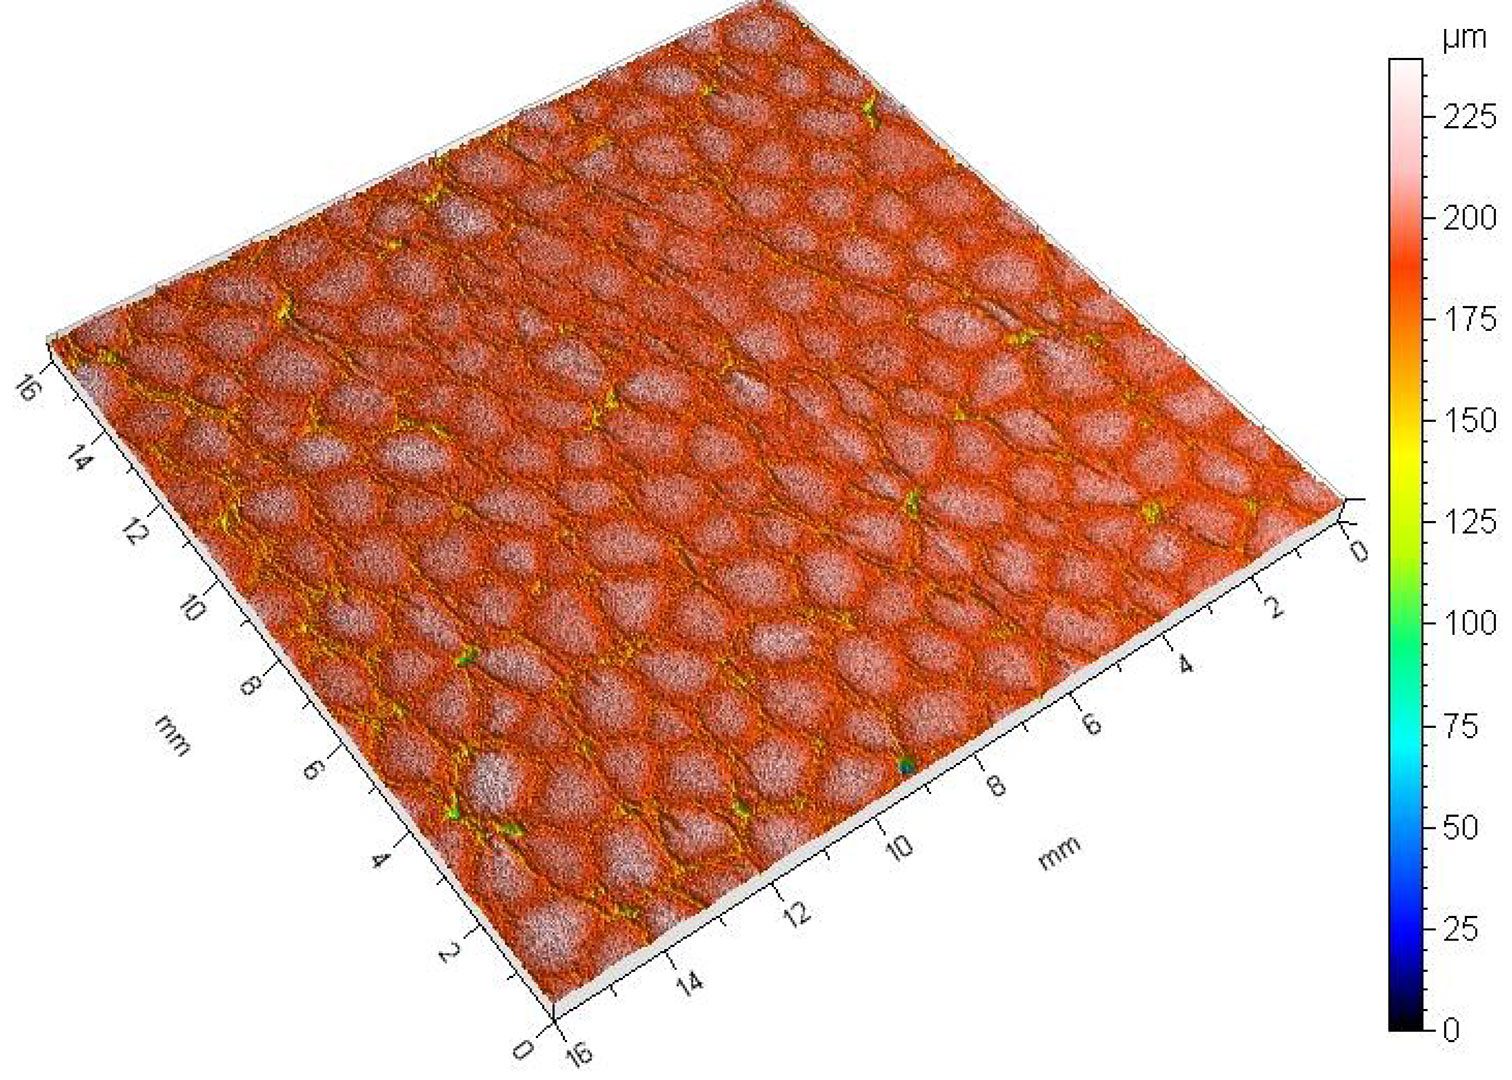
En esta aplicación, se utiliza el perfilómetro Nanovea ST400 para medir la superficie del poliestireno expandido. Los límites se establecieron combinando un archivo de intensidad reflejada con la topografía, que se obtuvieron simultáneamente utilizando el NANOVEA ST400. A continuación, estos datos se utilizaron para calcular la información sobre la forma y el tamaño de cada “grano” de poliestireno expandido.
NANOVEA
ST400
Imagen topográfica (abajo a la izquierda) enmascarada por una imagen de intensidad reflejada (abajo a la derecha) para definir claramente los límites de los granos. Todos los granos con un diámetro inferior a 565 µm se han ignorado mediante la aplicación de un filtro.
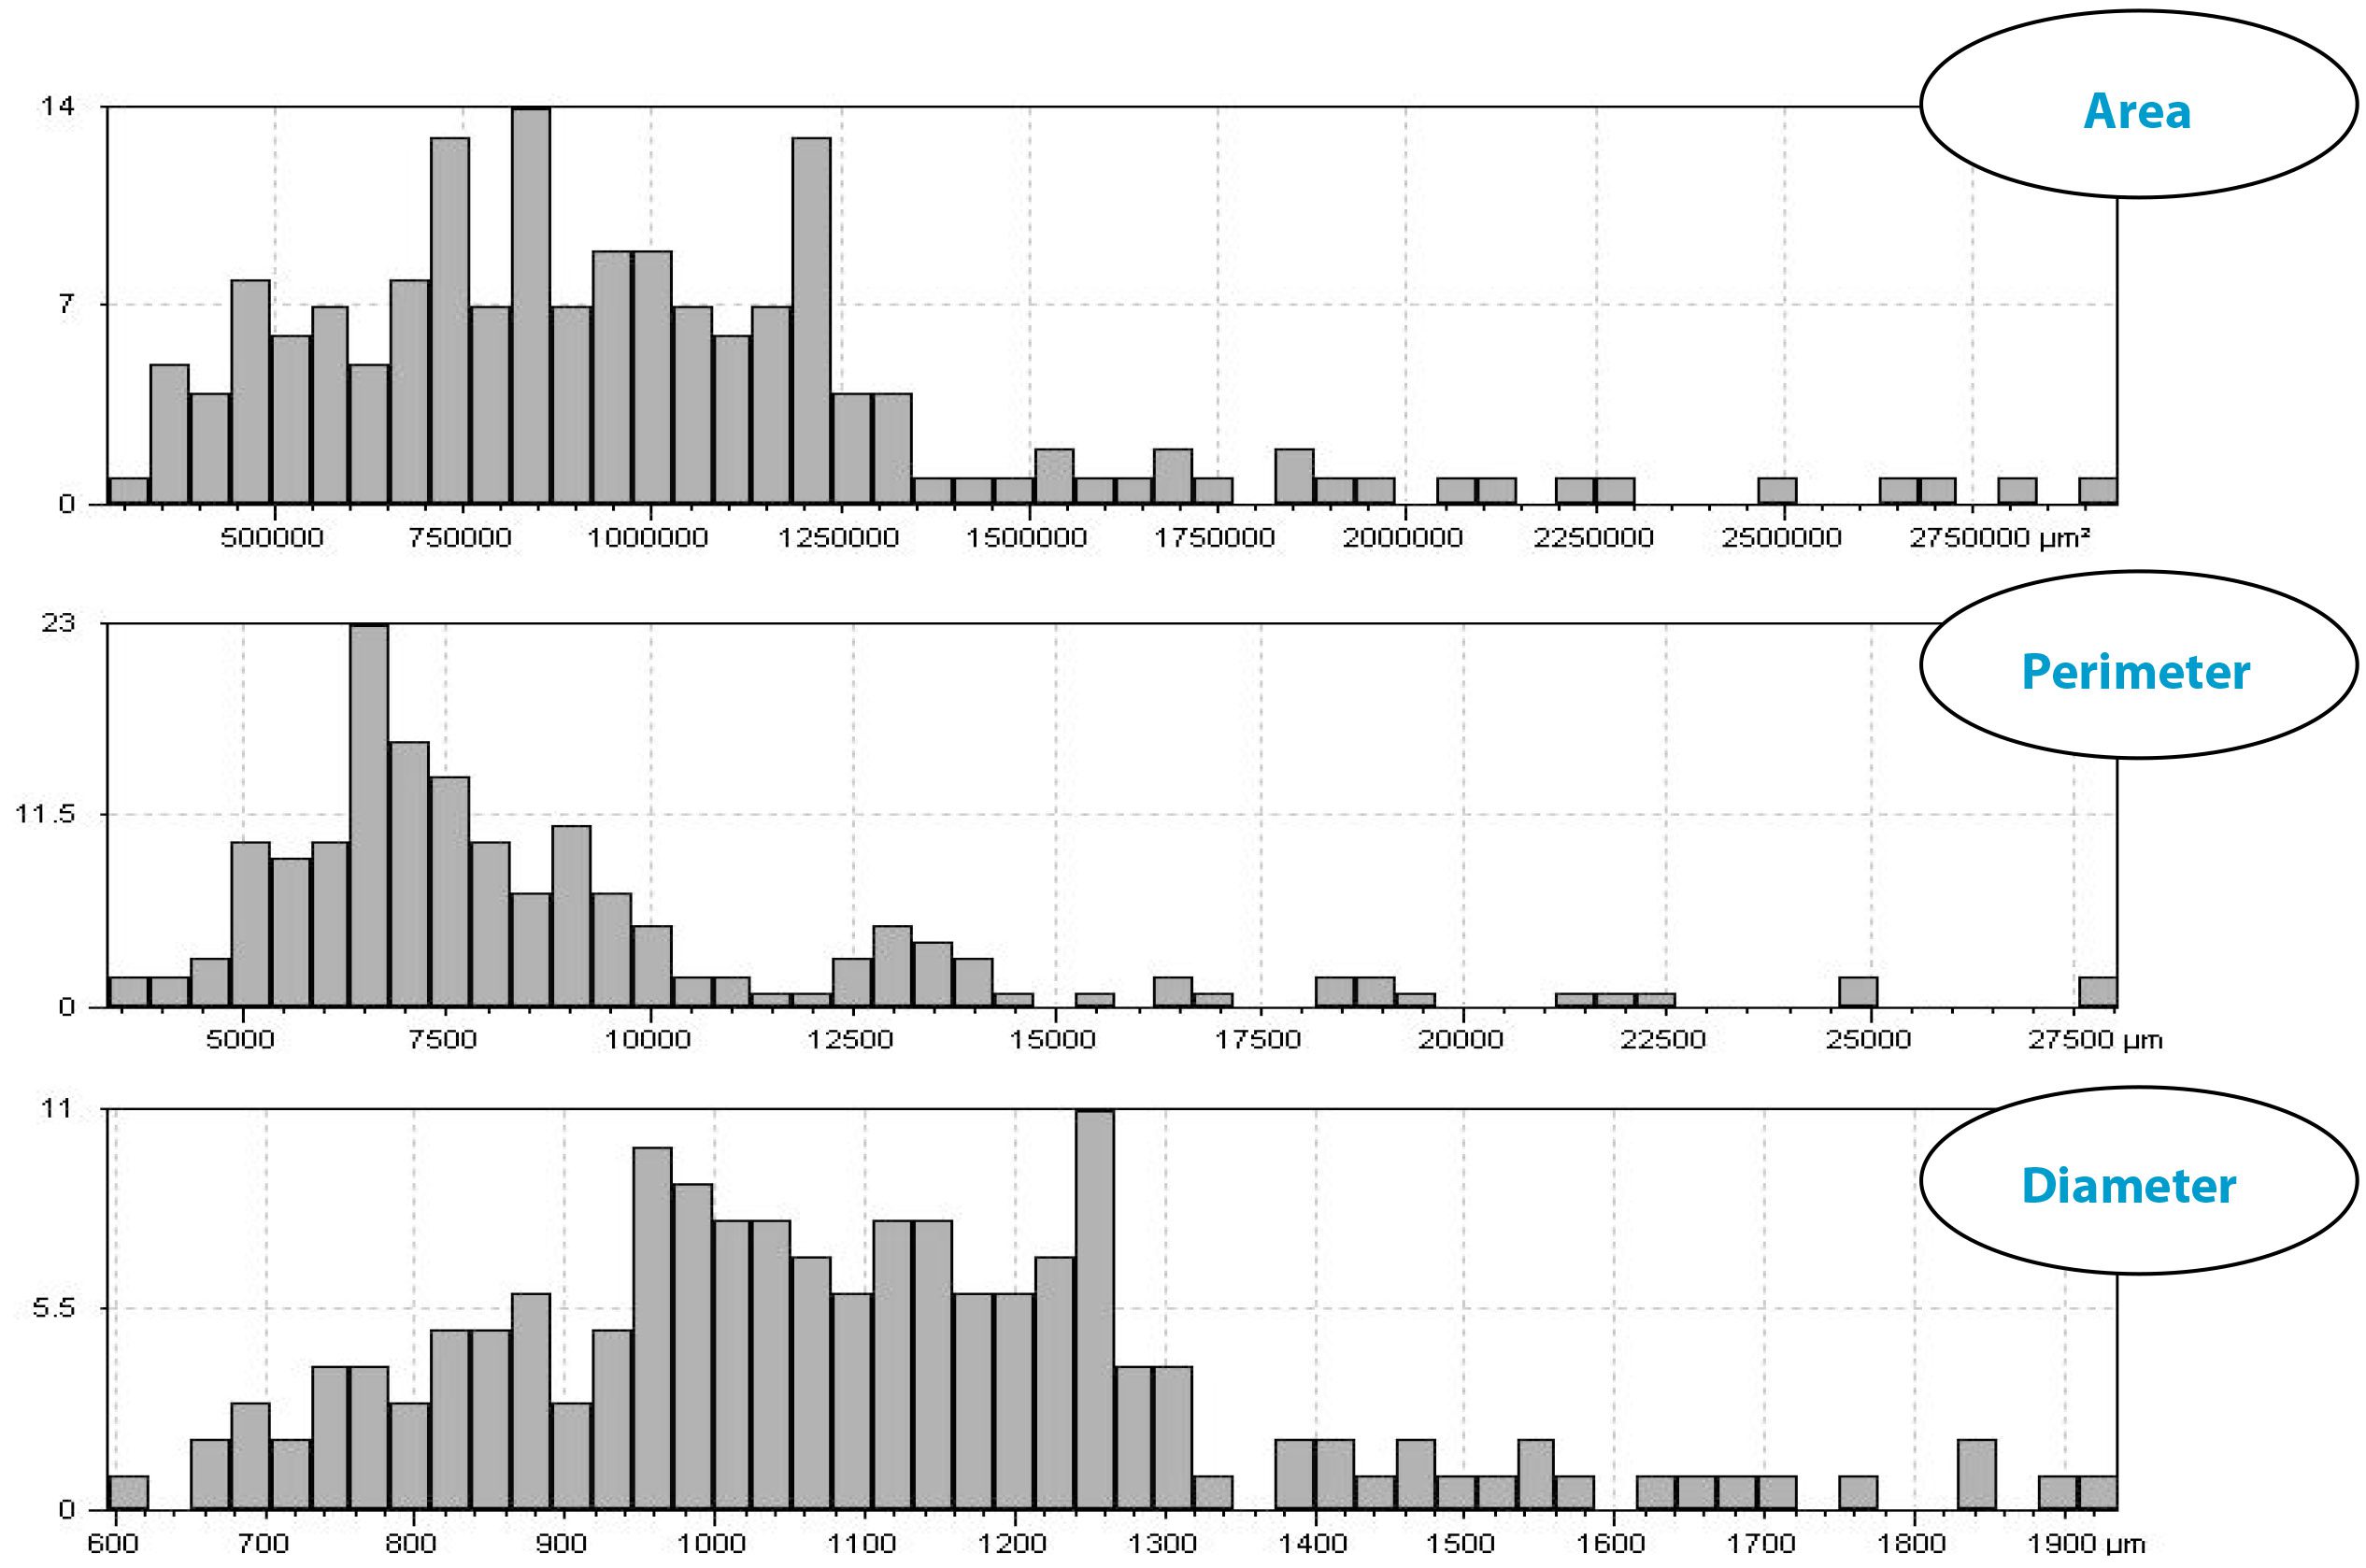
Número total de granos: 167
Área total proyectada ocupada por los granos: 166,917 mm² (64,5962 %)
Área total proyectada ocupada por los límites: (35.4038 %)
Densidad de granos: 0,646285 granos/mm2
Perímetro = 9114,15 µm +/- 4570,38 µm
Diámetro equivalente = 1098,61 µm +/- 256,235 µm
Diámetro medio = 945,373 µm +/- 248,344 µm
Diámetro mínimo = 675,898 µm +/- 246,850 µm
Diámetro máximo = 1312,43 µm +/- 295,258 µm
RESULTADOS Y DISCUSIÓN: Medición de límites superficiales en 3D
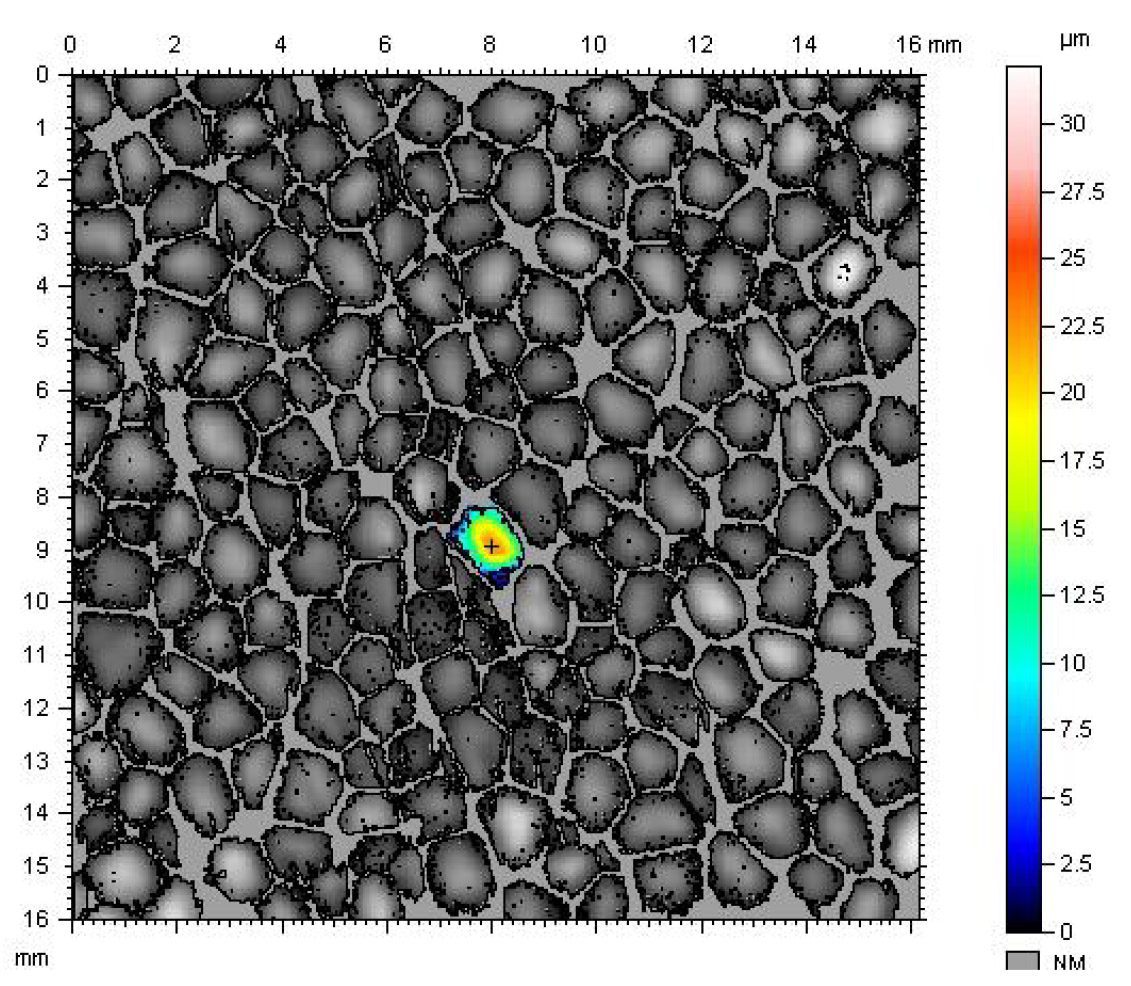
Mediante el uso de los datos topográficos 3D obtenidos, se puede analizar el volumen, la altura, el pico, la relación de aspecto y la información sobre la forma general de cada grano. Área total ocupada en 3D: 2,525 mm3.
CONCLUSIÓN
En esta aplicación, hemos mostrado cómo el perfilómetro sin contacto NANOVEA 3D puede caracterizar con precisión la superficie del poliestireno expandido. Se puede obtener información estadística sobre toda la superficie de interés o sobre granos individuales, ya sean picos o depresiones. En este ejemplo, se utilizaron todos los granos mayores que un tamaño definido por el usuario para mostrar el área, el perímetro, el diámetro y la altura. Las características que se muestran aquí pueden ser fundamentales para la investigación y el control de calidad de superficies naturales y prefabricadas, desde aplicaciones biomédicas hasta micro mecanizado, entre muchas otras.
Categorías
- Notas de aplicación
- Bloque sobre tribología anular
- Tribología de la corrosión
- Pruebas de fricción | Coeficiente de fricción
- Pruebas mecánicas a alta temperatura
- Tribología de alta temperatura
- Humedad y gases Tribología
- Humedad Pruebas mecánicas
- Indentación | Fluencia y relajación
- Indentación | Resistencia a la fractura
- Indentación | Dureza y elasticidad
- Indentación | Pérdida y almacenamiento
- Indentación | Esfuerzo frente a deformación
- Indentación | Límite elástico y fatiga
- Pruebas de laboratorio
- Tribología lineal
- Pruebas mecánicas de líquidos
- Tribología de líquidos
- Tribología a baja temperatura
- Pruebas mecánicas
- Comunicado de prensa
- Perfilometría | Planitud y alabeo
- Perfilometría | Geometría y forma
- Perfilometría | Rugosidad y acabado
- Profilometría | Altura y grosor del escalón
- Profilometría | Textura y grano
- Perfilometría | Volumen y área
- Pruebas de perfilometría
- Tribología anillo sobre anillo
- Tribología rotacional
- Prueba de arañazos | Fallo adhesivo
- Prueba del rasguño | Fallo de cohesión
- Pruebas de arañazos | Desgaste en varias pasadas
- Pruebas de rayado | Dureza al rayado
- Pruebas de rayado Tribología
- Pruebas de tribología
- Sin categoría
Archivos
- noviembre 2025
- septiembre 2023
- agosto 2023
- junio 2023
- mayo 2023
- julio 2022
- mayo 2022
- abril 2022
- enero 2022
- diciembre 2021
- noviembre 2021
- octubre 2021
- septiembre 2021
- agosto 2021
- julio 2021
- junio 2021
- mayo 2021
- marzo 2021
- febrero 2021
- diciembre 2020
- noviembre 2020
- octubre 2020
- septiembre 2020
- julio 2020
- mayo 2020
- abril 2020
- marzo 2020
- febrero 2020
- enero 2020
- noviembre 2019
- octubre 2019
- septiembre 2019
- agosto 2019
- julio 2019
- junio 2019
- mayo 2019
- abril 2019
- marzo 2019
- enero 2019
- diciembre 2018
- noviembre 2018
- octubre 2018
- septiembre 2018
- julio 2018
- junio 2018
- abril 2018
- marzo 2018
- febrero 2018
- noviembre 2017
- octubre 2017
- septiembre 2017
- agosto 2017
- junio 2017
- mayo 2017
- marzo 2017
- febrero 2017
- enero 2017
- noviembre 2016
- octubre 2016
- agosto 2016
- julio 2016
- junio 2016
- mayo 2016
- abril 2016
- marzo 2016
- febrero 2016
- enero 2016
- diciembre 2015
- noviembre 2015
- octubre 2015
- septiembre 2015
- agosto 2015
- julio 2015
- junio 2015
- mayo 2015
- abril 2015
- marzo 2015
- febrero 2015
- enero 2015
- noviembre 2014
- octubre 2014
- septiembre 2014
- agosto 2014
- julio 2014
- junio 2014
- mayo 2014
- abril 2014
- marzo 2014
- febrero 2014
- enero 2014
- diciembre 2013
- noviembre 2013
- octubre 2013
- septiembre 2013
- agosto 2013
- julio 2013
- junio 2013
- mayo 2013
- abril 2013
- marzo 2013
- febrero 2013
- enero 2013
- diciembre 2012
- noviembre 2012
- octubre 2012
- septiembre 2012
- agosto 2012
- julio 2012
- junio 2012
- mayo 2012
- abril 2012
- marzo 2012
- febrero 2012
- enero 2012
- diciembre 2011
- noviembre 2011
- octubre 2011
- septiembre 2011
- agosto 2011
- julio 2011
- junio 2011
- mayo 2011
- noviembre 2010
- enero 2010
- abril 2009
- marzo 2009
- enero 2009
- diciembre 2008
- octubre 2008
- agosto 2007
- julio 2006
- marzo 2006
- enero 2005
- abril 2004
