アメリカ/グローバル: +1-949-461-9292
ヨーロッパ+39-011-3052-794
お問い合わせ
3D optical profilometry image showing climbing hold surface roughness, pore morphology, and grip-related texture features.

Climbing Hold Surface Roughness Analysis

Application Note | 3D Optical Profilometry

Climbing Hold Surface Roughness Analysis Using 3D Optical Profilometry

Measuring Texture, Porosity, and Topography on Bouldering Holds

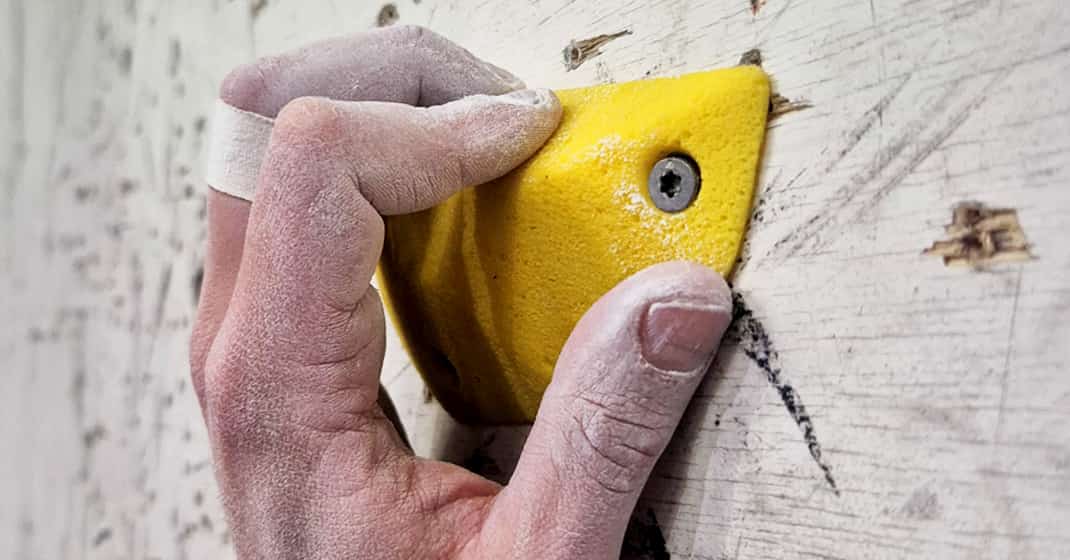
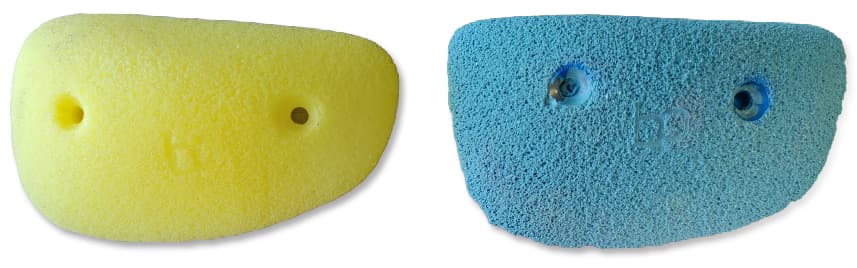
Bouldering holds analyzed for climbing hold surface roughness using 3D optical profilometry.

Research & Experimental Testing

Walter Alabiso, PhD

Visual Design & Editorial

アンドリュー・ショア

はじめに

Bouldering is a demanding discipline that combines physical strength, precise body positioning, and an understanding of how the human body interacts with climbing surfaces. On slab routes, where the wall is angled below vertical and positive holds are limited or absent, a climber’s stability depends almost entirely on the tribological interaction between the body and the climbing hold surface.

Climbing hold surface roughness plays a central role in this contact. Roughness provides the microtexture needed for smearing, a technique where high-friction rubber soles are pressed firmly against the surface to expand the effective contact area and generate adherence. A similar mechanism occurs at the fingers, where the ridges of fingerprints and the pliability of skin deform slightly against the hold’s surface features, creating grip through microscopic interlocking.

Porosity contributes to grip performance by absorbing moisture, sweat, or chalk at the contact interface, preventing the formation of a thin lubricating film that would reduce friction. Micro-cracks and surface flaws act as additional friction points, helping the climber maintain lateral tension against the hold surface. Because these features (roughness, porosity, and surface morphology) operate at different scales and interact differently depending on the hold, quantitative 3D surface measurement is essential for comparing how different climbing hold textures perform under real contact conditions.
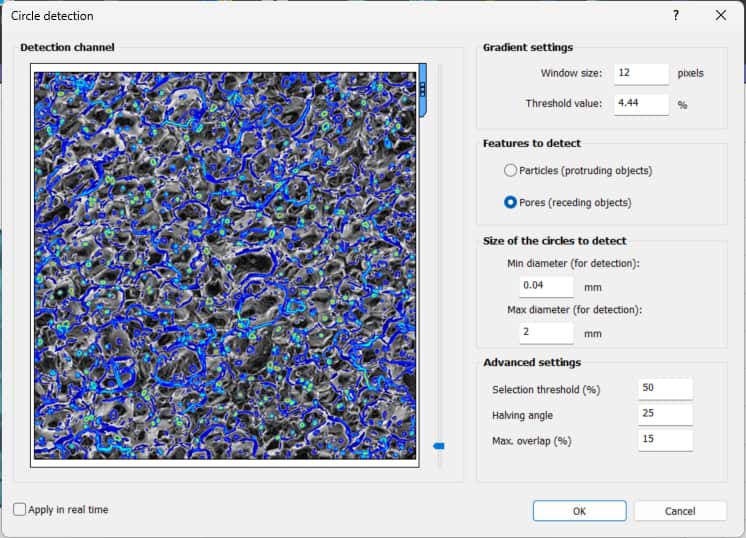
Bouldering grips used to compare surface roughness, pore morphology, and grip-related topography.

Why Use Non-Contact Profilometry for Climbing Hold Surface Analysis

Climbing holds and rock-like surfaces can include deep pores, steep asperities, sharp valleys, and irregular texture. These features are difficult to measure accurately with contact-based profilometry because a physical stylus can lose contact, deform local surface features, or fail to reach narrow cavities.

NANOVEA’s non-contact optical profilometry uses chromatic light technology to capture surface height data without touching the sample. This makes it suitable for reconstructing complex climbing hold topography, including deep nooks, pores, and surface flaws, while avoiding measurement artifacts caused by local plastic deformation.

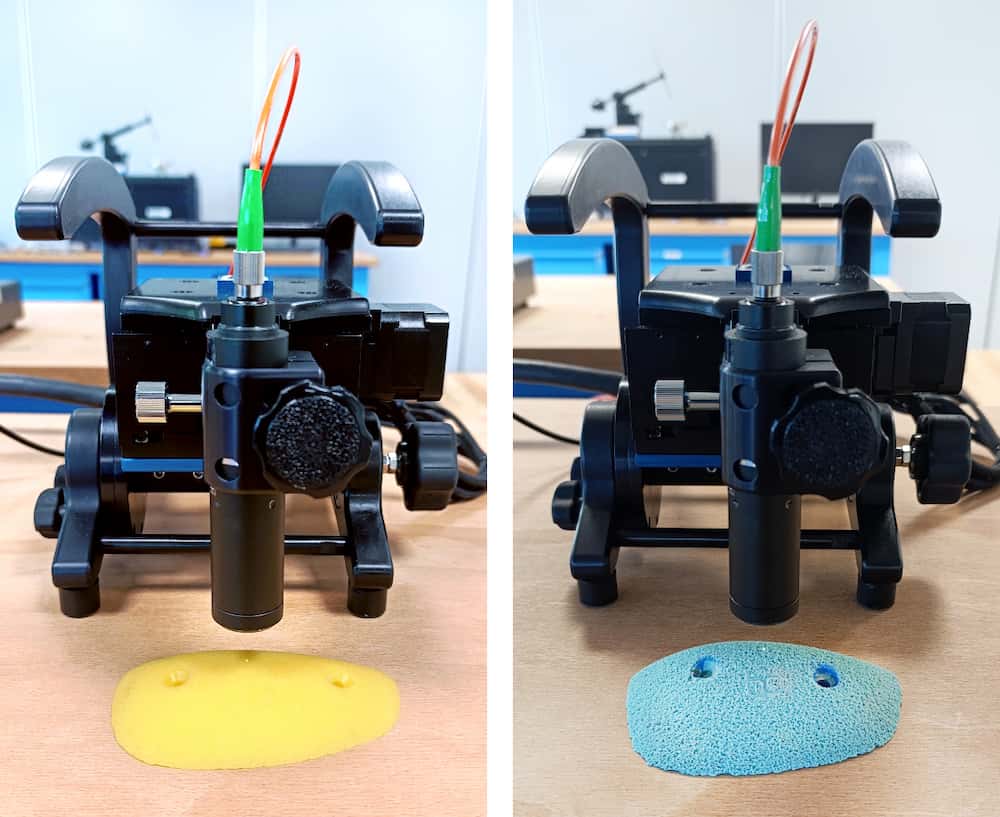
In this study, the NANOVEA JR25 Optical Profiler was used to measure two bouldering grips: a yellow block with a smoother, flatter surface and a green block with a rougher tactile texture. Both samples were scanned using a PS4-MG35 single-point optical sensor with a 3000 µm Z-range and a 4 µm acquisition step in X and Y.

Dual-frequency acquisition was used to reduce light sensor saturation from localized bright spots on the grip surfaces, allowing the profiler to capture roughness and pore morphology across the scanned areas.

測定目的

The objective of this study was to demonstrate how non-contact 3D optical profilometry can be used to reconstruct and compare the surface roughness, topography, and pore morphology of climbing holds.

Two bouldering grip samples were analyzed: a yellow block with a smoother, flatter surface and a blue block with a rougher tactile texture and sharper grip features. The analysis focused on surface height variation, areal roughness parameters, pore coverage, pore size, pore depth, and functional surface behavior.

The NANOVEA JR25 Optical Profilometer measuring the climbing hold samples using an optical sensor.

Measurement Method

The NANOVEA JR25 Optical Profiler was used to measure the yellow and blue bouldering grip samples. Each surface was scanned with a PS4-MG35 single-point optical sensor with an enhanced 3000 µm Z-range, allowing the system to capture deep pores, sharp valleys, and irregular surface texture while maintaining a 4 µm acquisition step in X and Y.

Dual-frequency acquisition was used to reduce light sensor saturation from localized bright spots on the grip surfaces, improving data capture across rough, porous, and uneven areas.

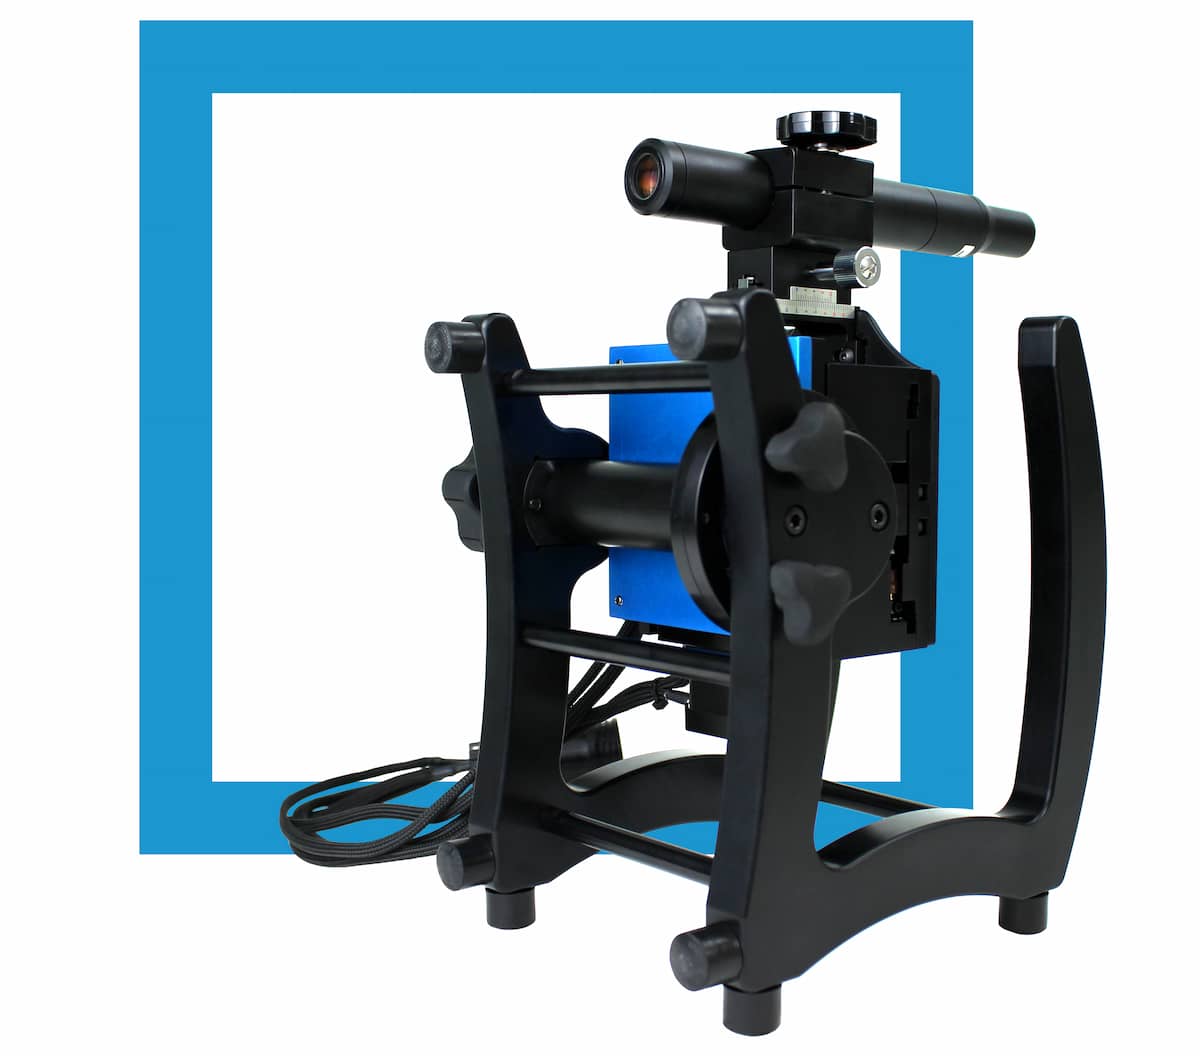
ナノビア JR25 Portable

光学式表面形状計

テスト・パラメーター

Two bouldering grip samples were analyzed: a yellow grip with a smoother, flatter surface and a blue grip with a rougher tactile texture and sharper grip features. The analysis focused on surface height variation, areal roughness parameters, pore coverage, pore size, pore depth, and functional surface behavior.

Measurement Setting Optical Profilometry Setup
Samples measured Yellow and blue bouldering grip samples
Optical pen PS4-MG35
Z-range 3000 µm
Scan area 5.00 mm × 5.00 mm
X-step size 4.00 µm
Y-step size 4.00 µm
Averaging 1
Measurement type Direct
Acquisition mode Dual frequency
Acquisition rate 100–400 Hz
Light intensity 100%

表1: Optical profilometry test conditions used to measure the bouldering grip samples.

Optical Profilometry Results

Yellow Grip Sample

Surface Roughness Analysis

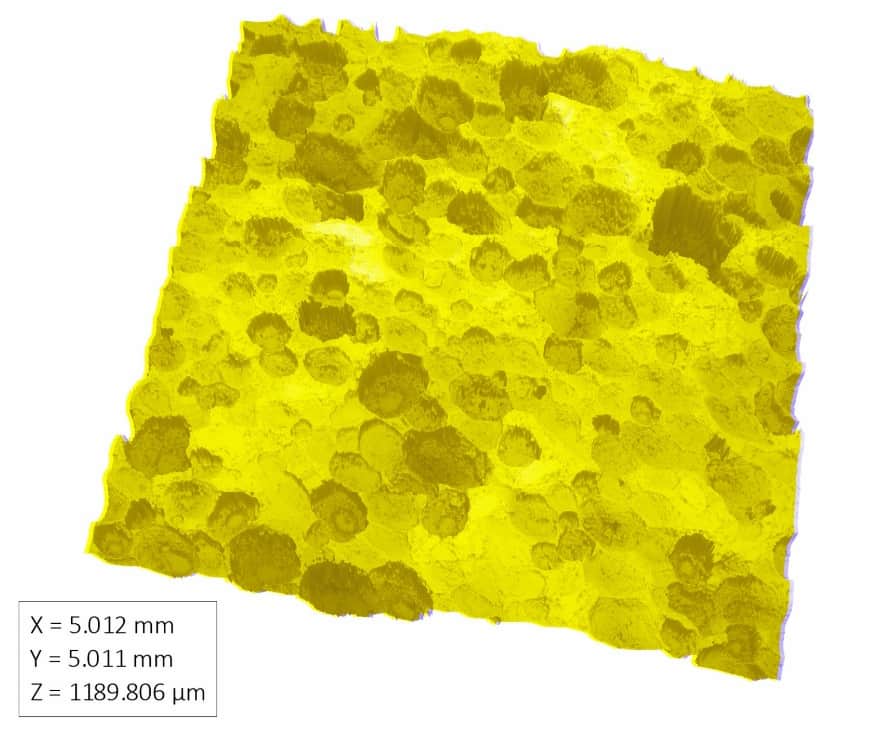
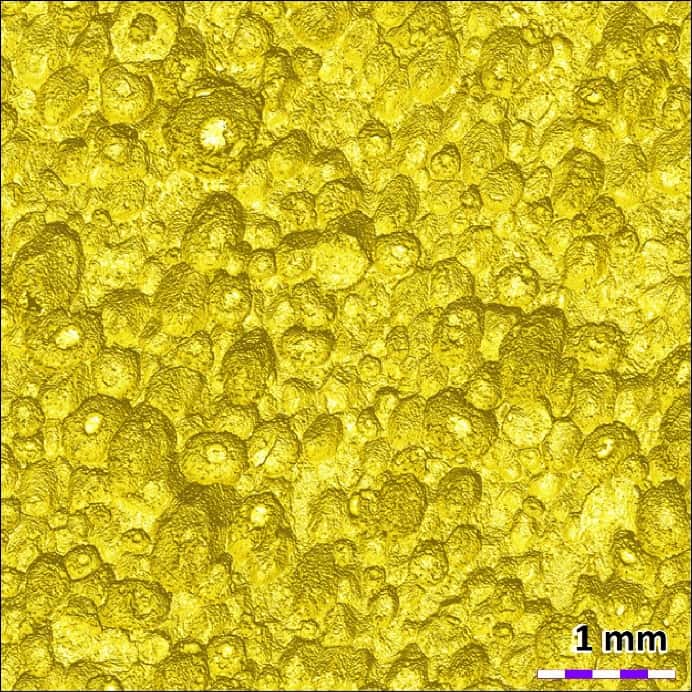
The 3D rendering below shows the reconstructed surface topography of the yellow climbing grip sample.

3D optical profilometry reconstruction of the yellow climbing grip surface showing pores, roughness, and surface height variation.

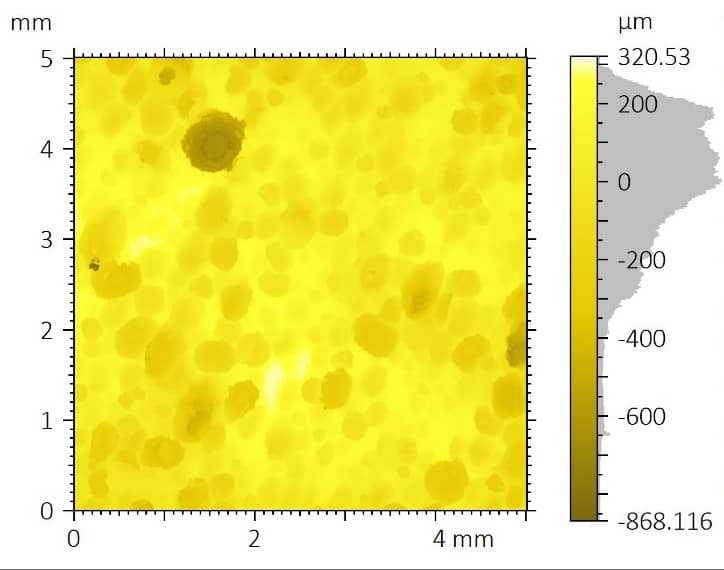
A total least-squares plane was removed to study surface properties. The roughness filters S-Gaussian 2.5 µm was applied following ISO 25178 (1/2 cut-off removed at each side). However, the sharp density of pores and asperities and the elevated average roughness make the use of a Gaussian L-filter (8 mm cut off) inapplicable. Therefore, the primary surface was considered, and the roughness parameters are listed in the table below, alongside the 2D false-color map of the filtered surface.

False-color optical profilometry surface roughness map of the yellow climbing grip sample with ISO 25178 height parameters.
ISO 25178-2 – Primary Surface
S-filter (λs): Gaussian, 2.5 µm, 1/2 cut-off
F-operation: [Workflow] Leveled (TLSPL)
Height Parameters
スク 168.970 µm 二乗平均平方根の高さ
エスケープ -0.927 歪度
スクー 4.117 クルトーシス
Sp 320.530 µm 最大ピーク高さ
エスブイ 868.116 µm Maximum pit depth
エスエス 1188.645 µm 最高高さ
132.953 µm 算術平均身長

The average surface roughness is 132.953 µm, whereas the peak-to-valley roughness, エスエス amounts to 1188.645 µm. The surface morphology is skewed towards deep valleys (エスケープ < 0, エスブイ > Sp), with a leptokurtotic (スクー > 3) distribution of peaks and valleys relative to the average plane.

The following picture shows a 2D photo-simulation of the area under artificial lighting, highlighting the region’s morphology.

2D photo simulation of the yellow climbing grip surface showing pores, roughness, and morphology under artificial lighting.

Pore Morphology Analysis

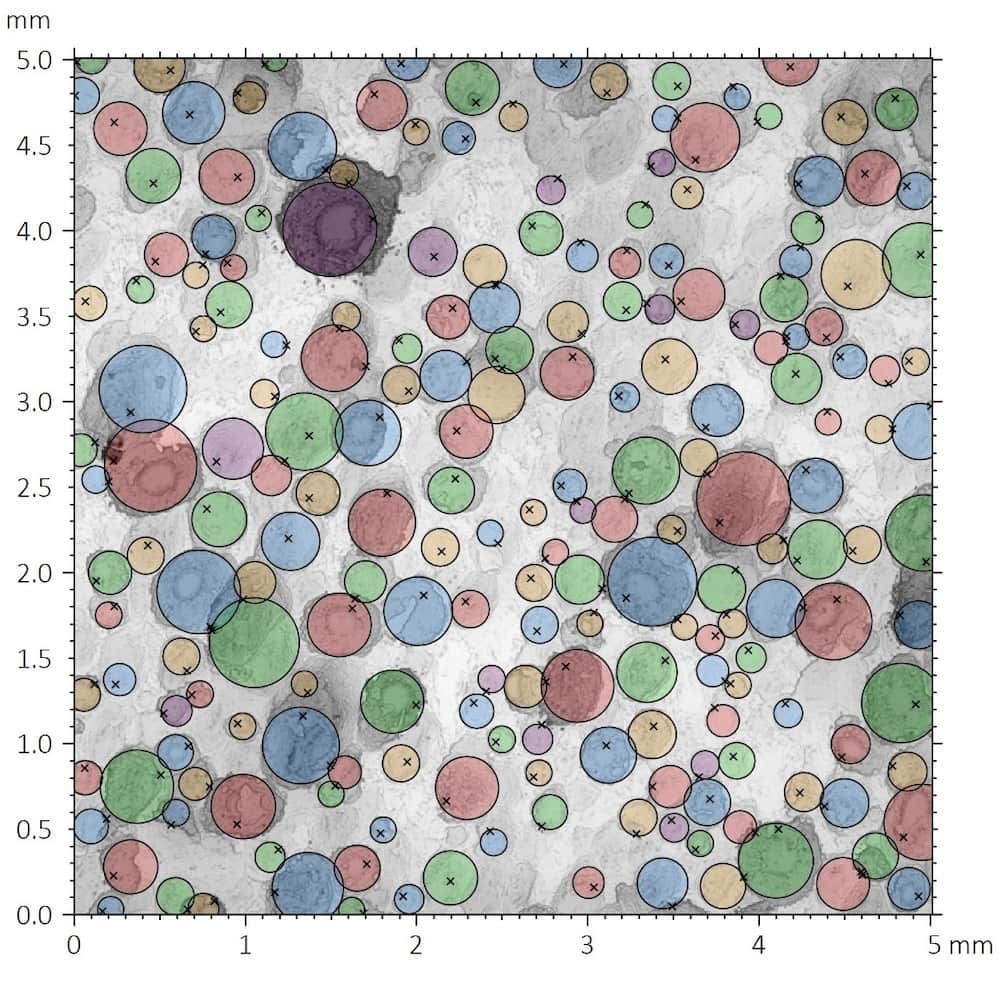
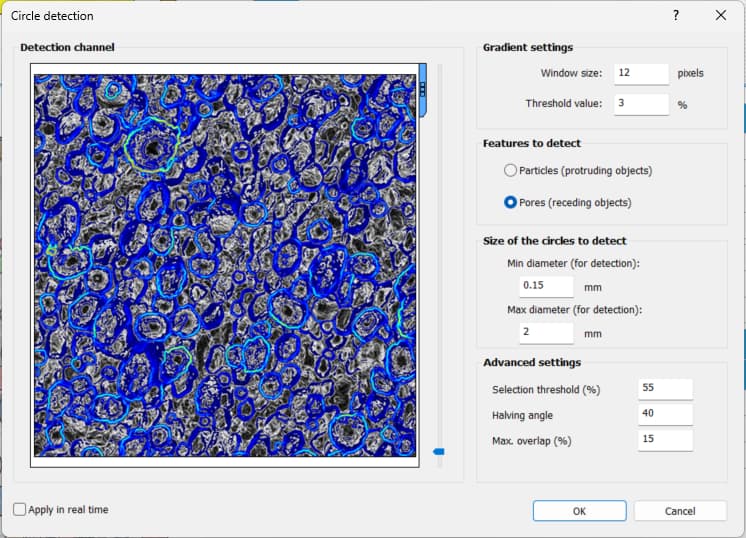
A pore analysis was performed across the full scanned area using a semi-automated edge-detection algorithm. The analysis identified recessed surface features to quantify pore coverage, pore density, radius, void volume, and maximum depth.

Pore detection analysis of the yellow climbing grip surface using semi-automated edge detection to identify recessed surface features.

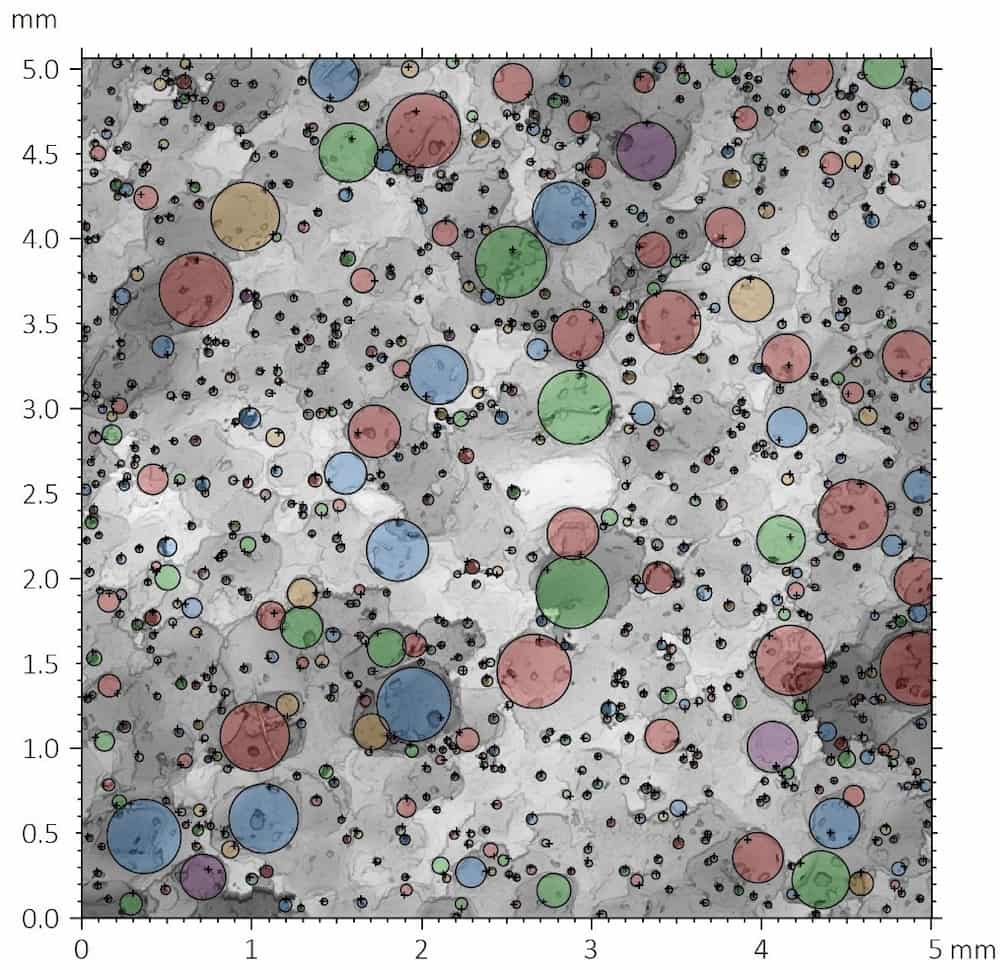
The detected pore locations were then mapped across the scanned 5 mm × 5 mm area to evaluate pore coverage, density, and size distribution.

Pore distribution map of the yellow climbing grip sample showing detected recessed surface features across a 5 mm by 5 mm scanned area.
Information
MethodCircle detection
Features detectedPores, recessed objects
Minimum detection diameter0.150 mm
Maximum detection diameter2.000 mm
Number of detected pores206
Surface coverage47.395%
Pore density8.203 particles/mm²
Global Statistics
ParameterUnitMeanStd. Dev.MinMax
半径ミリメートル0.1270.0490.0760.275
Void volumeµm³4,724,770.7056,748,143.92523,594.1724.422 × 10⁷
Maximum depthµm173.72994.94228.153716.480

Pores covered nearly half of the yellow grip’s scanned surface, with a measured coverage of 47.395% and a pore density of 8.203 particles/mm². The detected pores and cracks were highly heterogeneous in size, volume, and depth, ranging from large crater-like features with a maximum radius of 0.275 mm and void volume above 4.4 × 10⁷ µm³ to smaller pores with a minimum radius of 0.076 mm and void volume of 23,594.172 µm³. This uneven pore distribution is reflected in the large standard deviation measured for void volume and maximum depth.

Functional Surface Parameters (Abbott-Firestone curve)

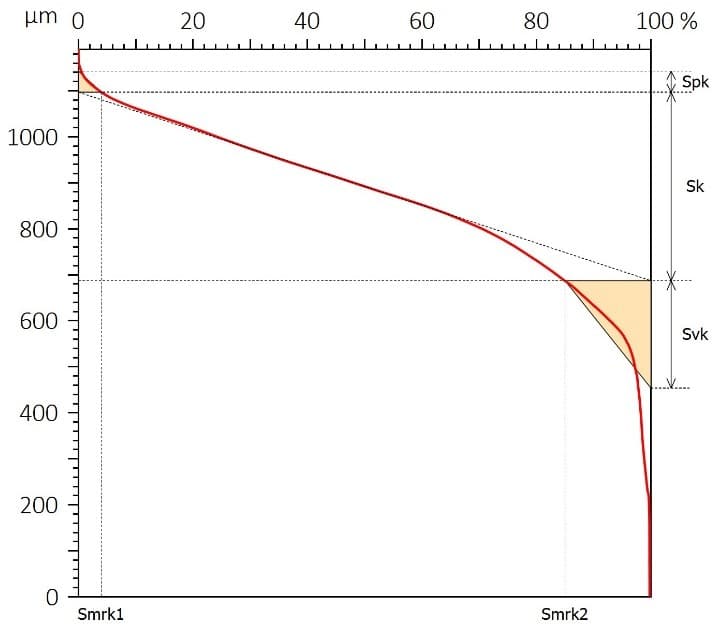
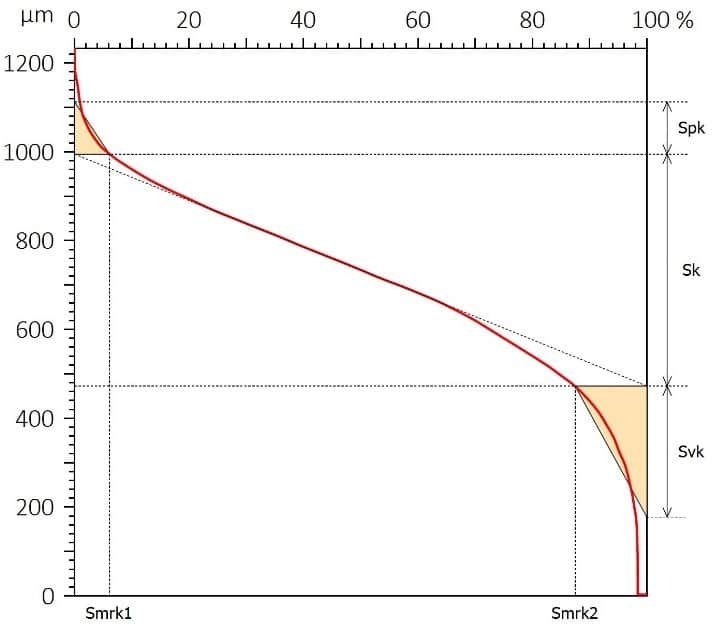
The Abbott-Firestone curve shows the cumulative areal material distribution of the yellow climbing grip sample. This analysis defines functional surface parameters including Sk, Spk, and Svk according to ISO 25178-2.

Abbott-Firestone curve for the yellow climbing grip sample showing cumulative areal material distribution and functional surface parameters.
Information
標準 ISO 25178-2
Parameter Value Unit
Sk 409.738 µm
Spk 45.480 µm
SVK 233.446 µm
Smrk1 3.976 %
Smrk2 85.005 %

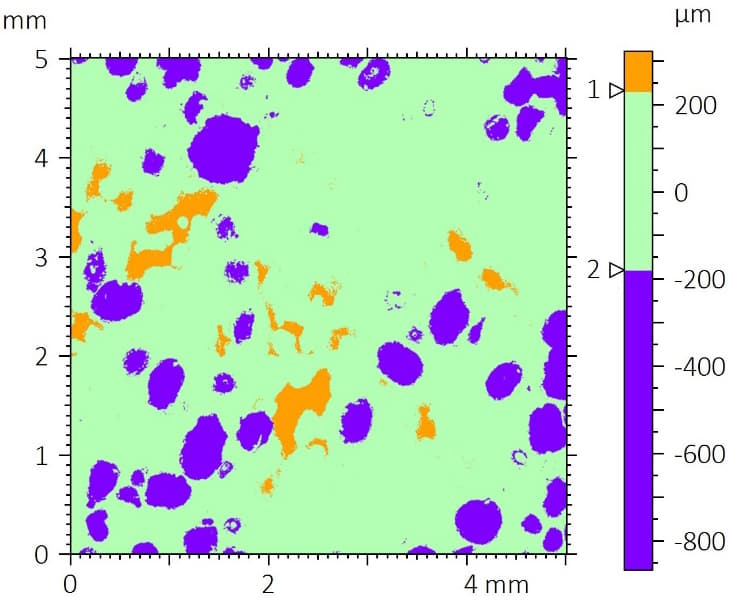
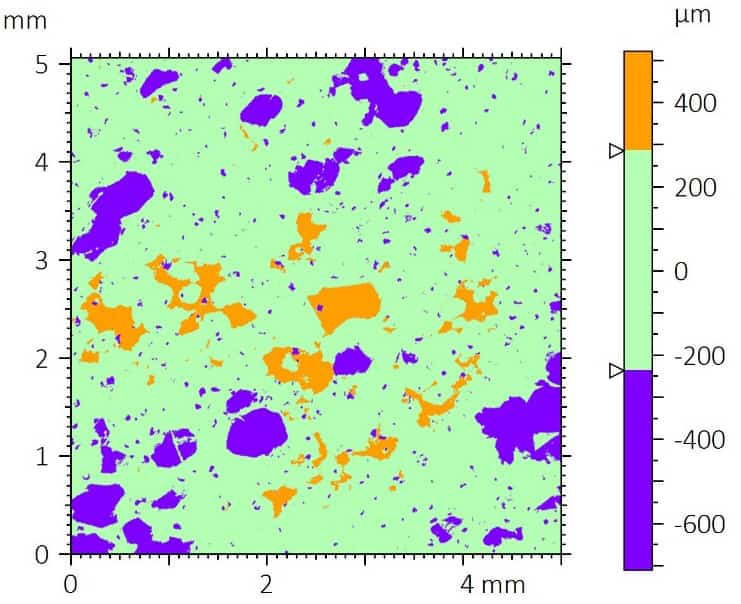
The chart below shows the peak-valley distribution from the mean plane based on the functional parameters derived from the Abbott-Firestone curve. Valleys are shown in purple, the mean plane in green, and peaks in orange.

Peak-valley distribution map of the yellow climbing grip sample showing valleys, mean plane regions, and peaks derived from Abbott-Firestone functional parameters.
Information
1st threshold Height – c1: 229.209 µm
2nd threshold Height – c2: -180.424 µm
Parameters Unit
Projected area (in %) % 14.995 81.029 3.976
Projected area mm² 3.772 20.381 1.000
Volume of material (in %) % 97.451 48.100 0.973
Volume of material µm³ 1.684 × 10¹⁰ 4.956 × 10⁹ 2.275 × 10⁷

The yellow grip sample shows a dominant mean-plane region with scattered recessed pores and a smaller population of raised peaks. This indicates a surface texture characterized mainly by average-sized pores distributed across the scanned area.

Blue Grip Sample

Surface Roughness Analysis

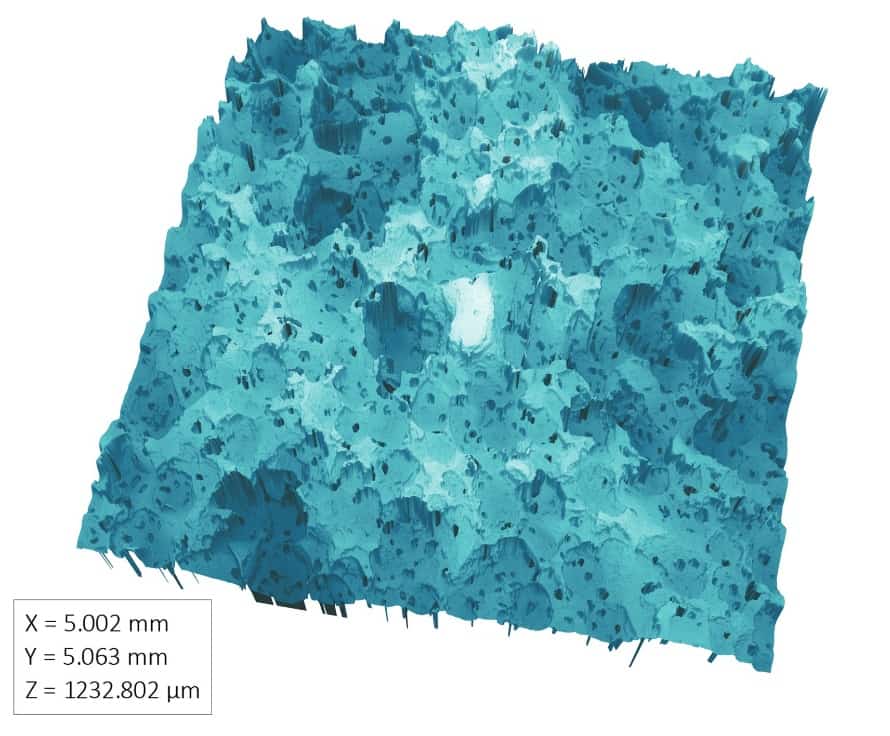
The 3D rendering below shows the reconstructed surface topography of the blue climbing grip sample.

3D optical profilometry reconstruction of the blue climbing grip surface showing roughness, pores, asperities, and surface height variation.

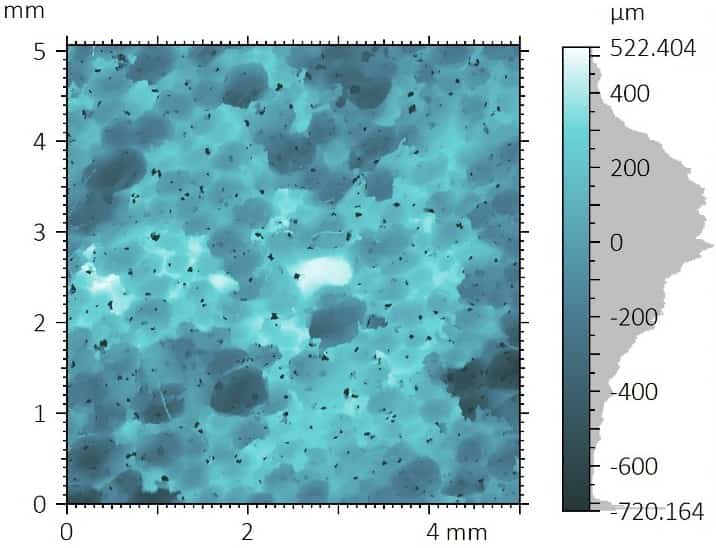
A total least-squares plane was removed to evaluate the blue grip’s surface properties. An S-Gaussian 2.5 µm roughness filter was applied following ISO 25178, with 1/2 cut-off removed at each side.

Because of the dense pores, asperities, and elevated average roughness, a Gaussian L-filter with an 8 mm cut-off was not applied. The primary surface was used for roughness analysis, with the roughness parameters listed alongside the 2D false-color map of the filtered surface.

False-color optical profilometry surface roughness map of the blue climbing grip sample with ISO 25178 height parameters.
ISO 25178-2 – Primary Surface
S-filter (λs): Gaussian, 2.5 µm, 1/2 cut-off
F-operation: [Workflow] Leveled (TLSPL)
Height Parameters
スク 211.440 µm 二乗平均平方根の高さ
エスケープ -0.682 歪度
スクー 3.672 クルトーシス
Sp 522.404 µm 最大ピーク高さ
エスブイ 720.164 µm Maximum pit depth
エスエス 1242.568 µm 最高高さ
166.719 µm 算術平均身長

The blue grip sample had an average surface roughness, Sa, of 166.719 µm and a peak-to-valley roughness, Sz, of 1242.568 µm. The negative skewness value, Ssk &lt; 0, indicates that the surface morphology is skewed toward deep valleys, while Sv &gt; Sp shows that the maximum pit depth exceeded the maximum peak height.

The kurtosis value, Sku &gt; 3, indicates a leptokurtotic height distribution, meaning the blue grip surface contains sharper or more extreme peaks and valleys relative to the average plane.

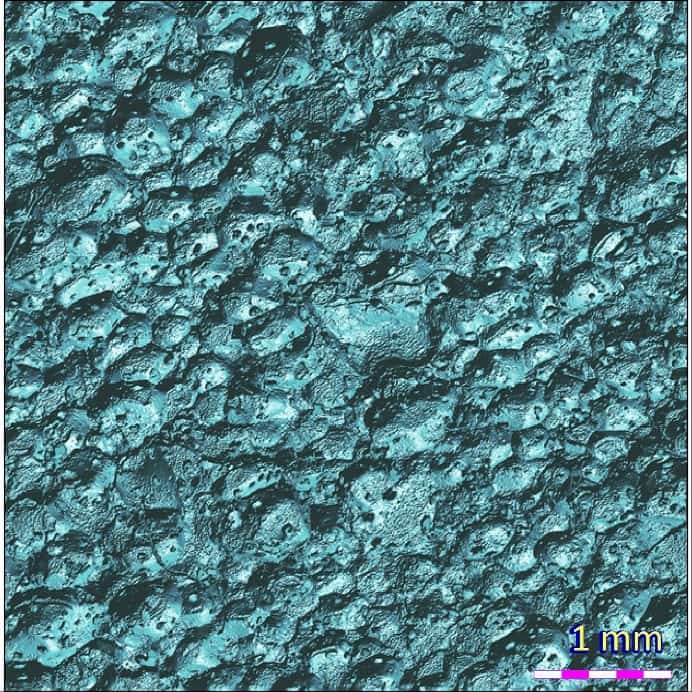
The 2D photo simulation below highlights the blue climbing grip’s surface morphology under artificial lighting.

2D photo simulation of the blue climbing grip surface showing pores, roughness, and morphology under artificial lighting.

Pore Morphology Analysis

A pore analysis was performed across the full scanned area using a semi-automated edge-detection algorithm. The analysis identified recessed surface features to quantify pore coverage, pore density, radius, void volume, and maximum depth.

Pore detection analysis of the blue climbing grip surface using semi-automated edge detection to identify recessed surface features.

The detected pore locations were mapped across the scanned 5 mm × 5 mm area to evaluate pore coverage, density, and size distribution.

Pore distribution map of the blue climbing grip sample showing detected recessed surface features across a 5 mm by 5 mm scanned area.
Information
Method Circle detection
Features detected Pores, recessed objects
Minimum detection diameter 0.040 mm
Maximum detection diameter 2.000 mm
Number of detected pores 794
Surface coverage 24.208%
Pore density 31.355 particles/mm²
Global Statistics
Parameter Unit Mean Std. Dev. Min Max
半径 ミリメートル 0.035 0.035 0.020 0.218
Void volume µm³ 821,872.849 2,495,310.021 11,009.819 2.929 × 10⁷
Maximum depth µm 476.053 305.830 16.132 1044.045

Pores covered 24.208% of the blue grip’s scanned surface, with a pore density of 31.355 particles/mm². The detected pores and cracks were highly heterogeneous in size, volume, and depth, ranging from large crater-like features with a maximum radius of 0.218 mm and void volume greater than 2.9 × 10⁷ µm³ to small pores with a minimum radius of 0.020 mm and void volume of approximately 1.1 × 10⁴ µm³.

This uneven distribution is reflected in the large standard deviation measured for void volume and maximum depth. The pore distribution is bimodal, with one population of fine, deep pores and another population of larger crater-like valleys.

Functional Surface Parameters (Abbott-Firestone curve)

The Abbott-Firestone curve shows the cumulative areal material distribution of the blue climbing grip sample. This analysis defines functional surface parameters including Sk, Spk, and Svk according to ISO 25178-2.

Abbott-Firestone curve for the blue climbing grip sample showing cumulative areal material distribution and functional surface parameters.
Information
標準 ISO 25178-2
Parameter Value Unit
Sk 522.359 µm
Spk 117.670 µm
SVK 295.209 µm
Smrk1 6.122 %
Smrk2 87.456 %

The chart below shows the peak-valley distribution from the mean plane based on the functional parameters derived from the Abbott-Firestone curve. Valleys are shown in purple, the mean plane in green, and peaks in orange.

Peak-valley distribution map of the blue climbing grip sample showing valleys, mean-plane regions, and peaks derived from Abbott-Firestone functional parameters.
Information
1st threshold Height – c1: 283.646 µm
2nd threshold Height – c2: -238.619 µm
Parameters Unit
Projected area (in %) % 12.544 81.334 6.122
Projected area mm² 3.182 20.629 1.553
Volume of material (in %) % 96.079 48.546 1.514
Volume of material µm³ 1.151 × 10¹⁰ 6.431 × 10⁹ 9.142 × 10⁷

The blue grip sample shows a dominant mean-plane region with fine, deep pores distributed across the surface and localized peak features. Compared with the yellow grip, the blue grip contains a higher projected peak area and a bimodal pore structure, combining fine recessed pores with larger crater-like valleys.

結論

In this application, the NANOVEA JR25 Non-Contact Optical Profiler was used to measure the surface roughness, topography, and pore morphology of yellow and blue bouldering grip samples.

Topographic analysis showed that both grip samples had high surface roughness, with Sa values above 100 µm and Sz values above 1000 µm. Both surfaces also showed an asymmetric height distribution skewed toward valleys, indicating that recessed features played a major role in the measured surface morphology.

The yellow grip sample showed higher pore coverage, with pores covering 47.395% of the scanned surface. Its surface was mainly characterized by average-sized pores distributed across the measured area.

The blue grip sample showed lower pore coverage at 24.208%, but a much higher pore density of 31.355 particles/mm². Its pore distribution was bimodal, with a population of fine, deep pores and a separate population of larger crater-like valleys.

These results show how non-contact 3D optical profilometry can quantify climbing hold surface features that are difficult to evaluate from visual inspection alone, including roughness, pore coverage, pore depth, surface height distribution, and functional topography. The blue grip’s higher porosity and bimodal pore structure make it more likely to absorb moisture and chalk at the contact interface, while its elevated roughness and surface morphology support stable friction for shoe rubber and finger contact. The yellow grip’s lower roughness and flatter profile suggest it is better suited for use as a foothold in slab climbing, where broad surface contact matters more than deep textural engagement.

Frequently Asked Questions About Climbing Hold Surface Roughness

What is climbing hold surface roughness?

Climbing hold surface roughness describes the height variation, texture, pores, asperities, and valleys present on the surface of a climbing grip. These features can influence contact behavior between the hold, shoe rubber, skin, chalk, and moisture.

How can climbing hold surface roughness be measured?

Climbing hold surface roughness can be measured using non-contact 3D optical profilometry. This method reconstructs the surface topography and calculates areal roughness parameters such as Sa, Sz, Sp, Sv, Ssk, and Sku without touching or deforming the sample.

Why use non-contact optical profilometry for climbing hold analysis?

Non-contact optical profilometry is useful for climbing hold analysis because climbing grips can contain deep pores, sharp valleys, rough asperities, and irregular surface texture. A contact stylus may lose contact, fail to reach recessed features, or introduce artifacts on complex surfaces.

What does Sa mean in surface roughness analysis?

Sa is the arithmetic mean height of a surface and is commonly used to describe average areal surface roughness. In this app note, both climbing grip samples showed high Sa values above 100 µm, indicating strongly textured surfaces.

What does Sz mean in optical profilometry results?

Sz is the maximum height of the measured surface, calculated from the highest peak to the deepest valley. In climbing hold surface roughness analysis, Sz helps describe the full vertical range of the grip’s surface texture.

Why is pore morphology important for climbing grips?

Pore morphology can affect how a climbing grip interacts with chalk, sweat, humidity, skin, and shoe rubber. Measuring pore coverage, density, depth, and volume helps quantify surface features that are difficult to evaluate by visual inspection alone.

stent coating adhesion testing failure analysis drug eluting stent coating

Stent Coating Adhesion and Delamination Analysis Using Nano Scratch Testing

Application Note | Stent Coating Adhesion Testing

Stent Coating Adhesion and Delamination Analysis Using Nano Scratch Testing

Quantifying Coating Failure and Adhesion Performance on Drug-Eluting Stents

stent coating adhesion testing nano scratch delamination critical load

Research & Experimental Testing

Duanjie Li, PhD

Visual Design & Editorial

アンドリュー・ショア

はじめに

Blood is carried through arteries from the heart to the rest of the body. Any weakening or blockage of these vessels can pose significant health risks and may become life-threatening. A stent is a small mesh tube inserted into the lumen of a blood vessel to treat narrowed or weakened arteries. Stent implantation is now a widely used procedure to support the arterial wall and restore blood flowᶦ.

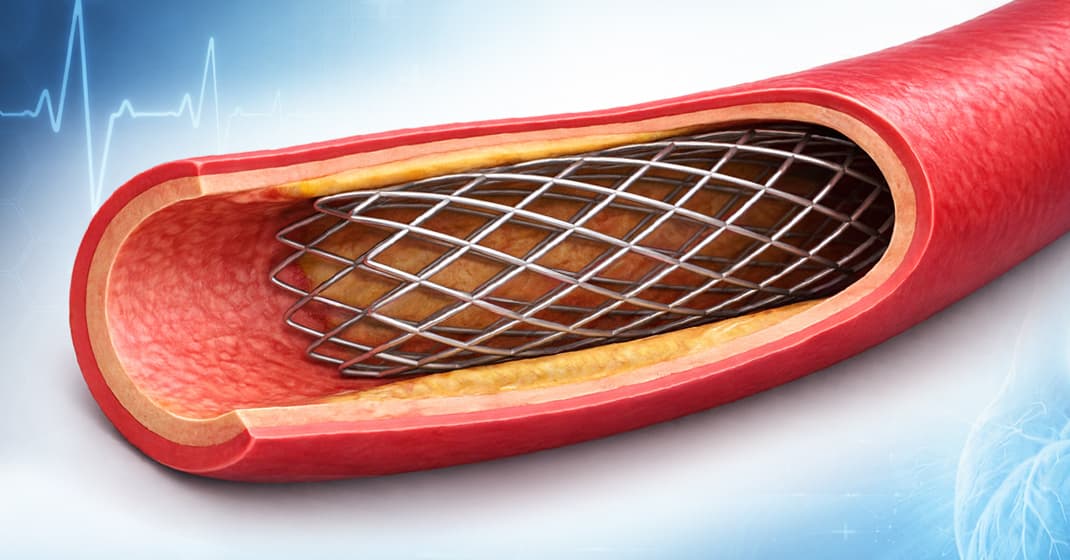
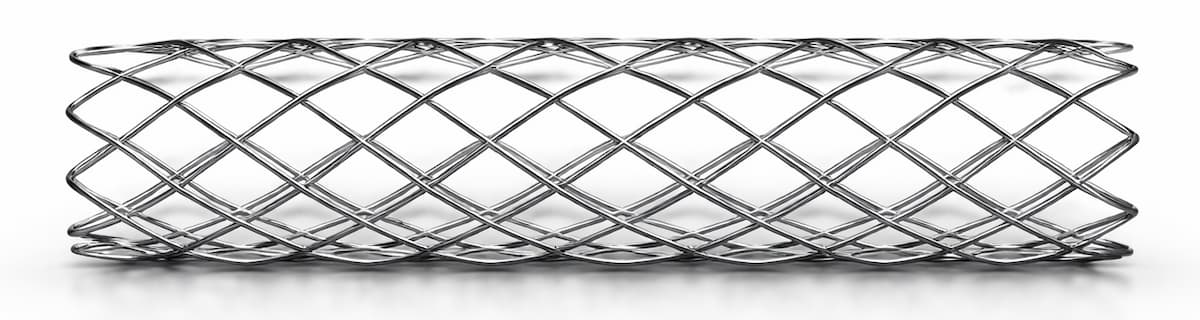
Metal stent mesh geometry illustrating the structural complexity of vascular implant design.

Why coating adhesion matters in drug-eluting stents

Drug-eluting stents represent a major advancement in stent technology. They incorporate a biodegradable, biocompatible polymer coating that enables controlled drug release at the arterial site, helping to inhibit intimal thickening and reduce the risk of restenosisᶦᶦ.

A critical concern in these systems is the delamination of the polymer coating from the metallic stent substrate. This coating carries the drug-eluting layer, and its adhesion directly impacts device performance and reliability.

To improve coating adhesion, stents are often designed with complex geometries. In this study, the polymer coating is located at the bottom of grooves within the stent mesh. This configuration presents a significant challenge for adhesion measurement.

A reliable method is required to quantitatively evaluate the interfacial strength between the polymer coating and the metal substrate. The small diameter of the stent mesh, comparable to a human hair, combined with its three-dimensional geometry, requires:

  • ultrafine X-Y positioning accuracy
  • precise control of applied load
  • accurate depth measurement during testing

Measurement Method

Nano scratch testing is performed using the NANOVEA PB1000 メカニカルテスター, in Nano Scratch Mode, to evaluate the cohesive and adhesive strength of the polymer coating on the metal mesh of stent samples.

Controlled scratch measurements are carried out on stent geometries with dimensions comparable to a human hair, enabling precise evaluation of coating adhesion on complex stent structures.

ナノビア PB1000 Advanced

メカニカルテスター

テスト条件

1. Regular Stent Samples

The stent is fixed on the sample stage, with a support wire inserted inside the stent tube to ensure stability during nano scratch testing. The NANOVEA Mechanical Tester is used to perform nano scratch measurements using the parameters summarized in Table 1, to evaluate the cohesive and adhesive strength of the polymer coating on the metal substrate.

ParameterValue
Load typeプログレッシブ
Initial load0.05 mN
Final load300 and 100 mN
Sliding speed0.5 mm/min
Sliding distance0.5 mm
Indenter geometry円錐形(コニカル)
Indenter material (tip)ダイヤモンド
圧子先端半径20 µm
温度24°C (room)

表1: Test parameters for nano scratch measurements on regular stent samples

2. Grooved Stent Samples

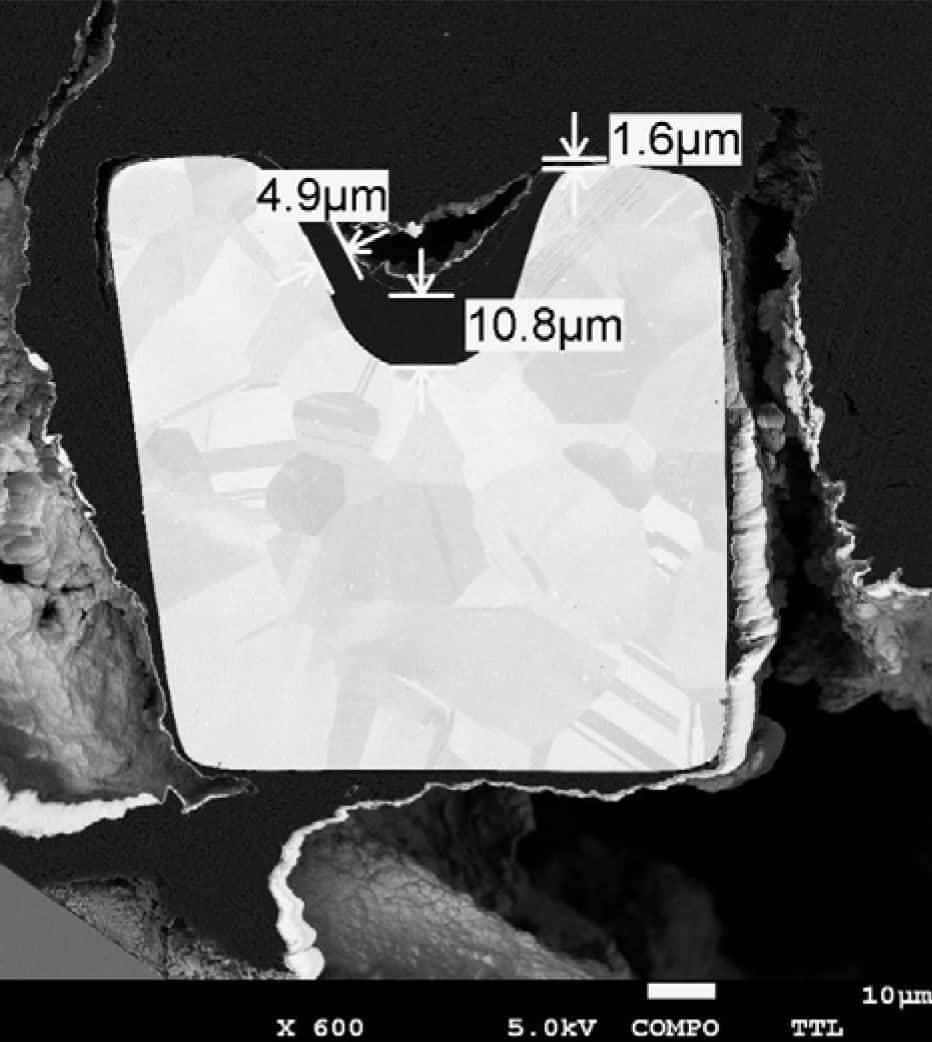
The SEM image in Fig. 1 shows the cross-section of the stent sample. The stent features a groove with a depth of approximately 30 µm. The polymer coating, with a thickness of 10.8 µm, is located at the bottom of the groove.

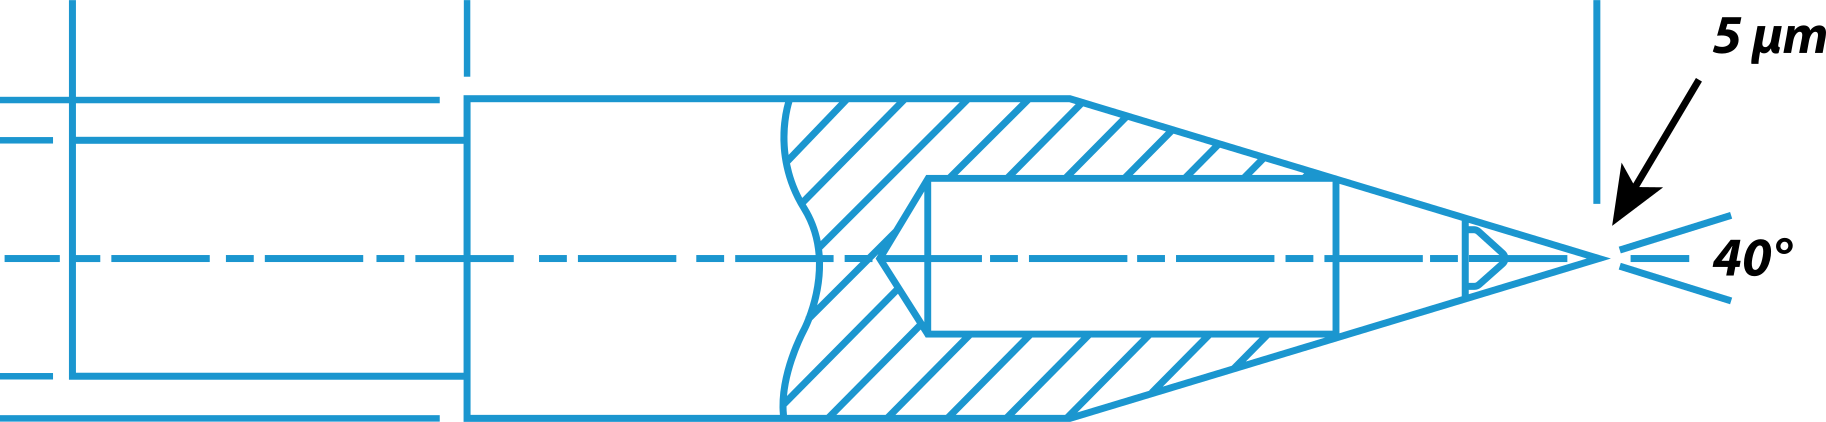
Standard 60° conical diamond tips are not sharp enough to reach the bottom of the groove without contacting the sidewalls. Therefore, a sharper 40° conical diamond tip is used in this study (Fig. 2).

Nano scratch measurements are performed using the parameters summarized in Table 2.

Parameter Value
Load type プログレッシブ
Initial load 0.1 mN
Final load 300 mN
積載率 300 mN/min
Scratch length 0.25 mm
Scratch speed 0.25 mm/min
Indenter geometry 40° cone
Indenter material (tip) ダイヤモンド
圧子先端半径 5 µm

Table 2: Test parameters for nano scratch measurements on grooved stent samples

stent groove cross section polymer coating thickness adhesion analysis nano scratch testing

Fig. 1: SEM cross-section of a grooved stent showing polymer coating located at the bottom of the groove, highlighting the challenge of coating adhesion measurement in recessed geometries.

nano scratch diamond tip 40 degree stent groove coating adhesion testing schematic

Fig. 2: Schematic of a 40° conical diamond tip designed for nano scratch testing inside stent grooves, enabling accurate adhesion measurement without sidewall interference.

結果および考察

The stent mesh has a diameter of approximately 100 μm, comparable to a human hair. Precise positioning is therefore critical to ensure the scratch test is performed at the center of the stent mesh. The NANOVEA Mechanical Tester provides X–Y positioning accuracy down to 0.25 μm, enabling accurate test placement under the integrated optical microscope.

1. Regular Stent Samples

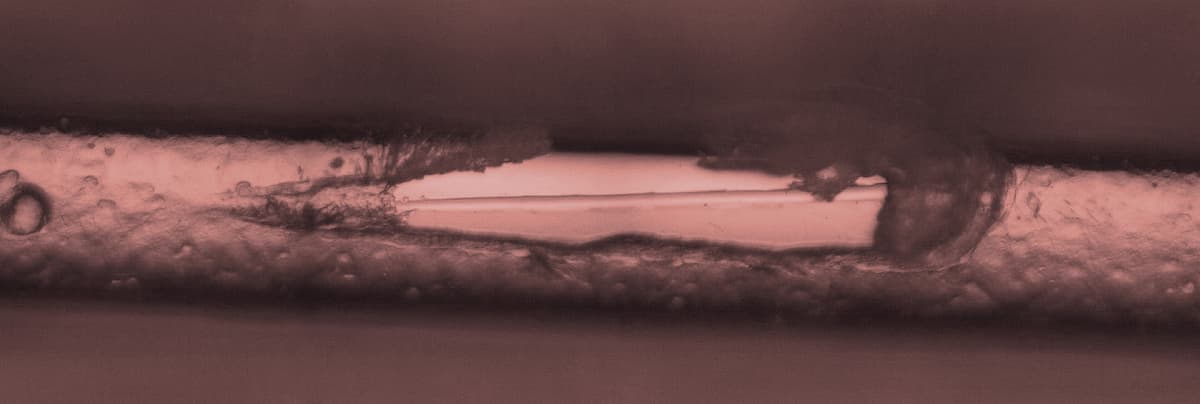
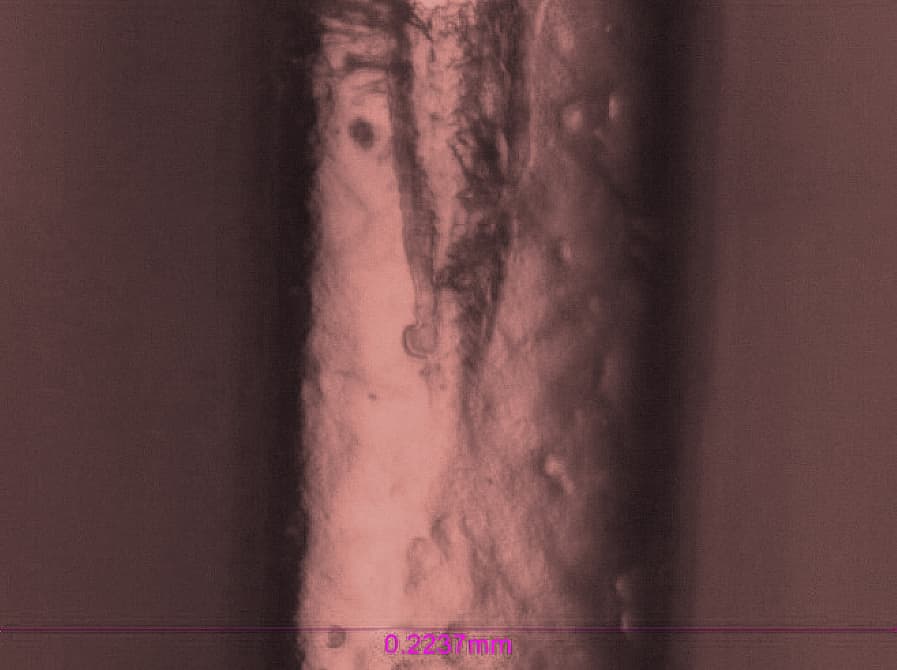
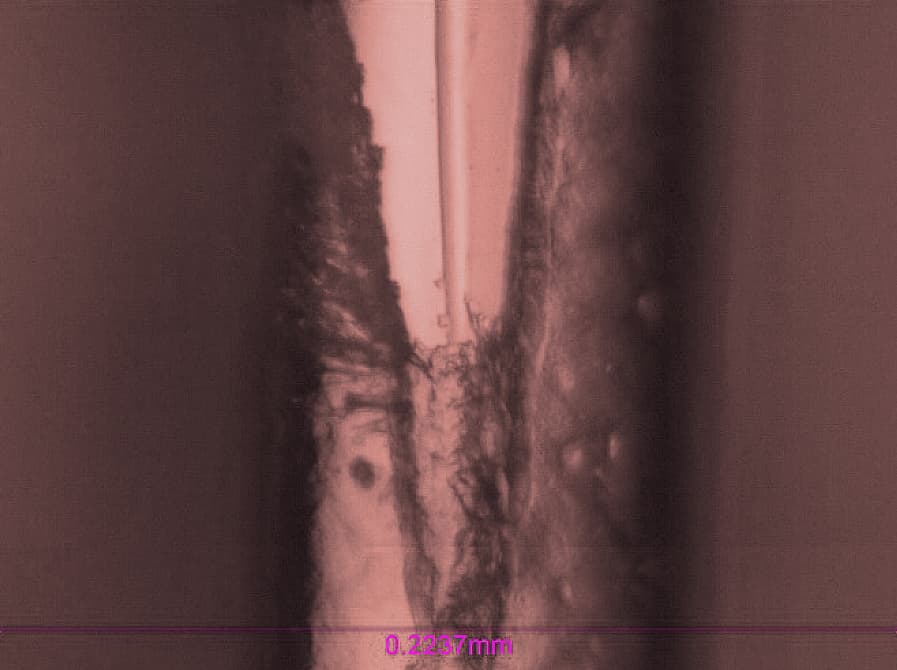
Nano scratch testing is performed with a progressively increasing load up to 300 mN. The full scratch track on the stent is shown in Fig. 3a, while failure behavior at different stages is presented in Fig. 3b and 3c.

Two critical loads are identified:

  • Lc1: the load at which the first visible damage appears on the coating
  • Lc2: the load at which the coating is fully removed and the substrate is exposed

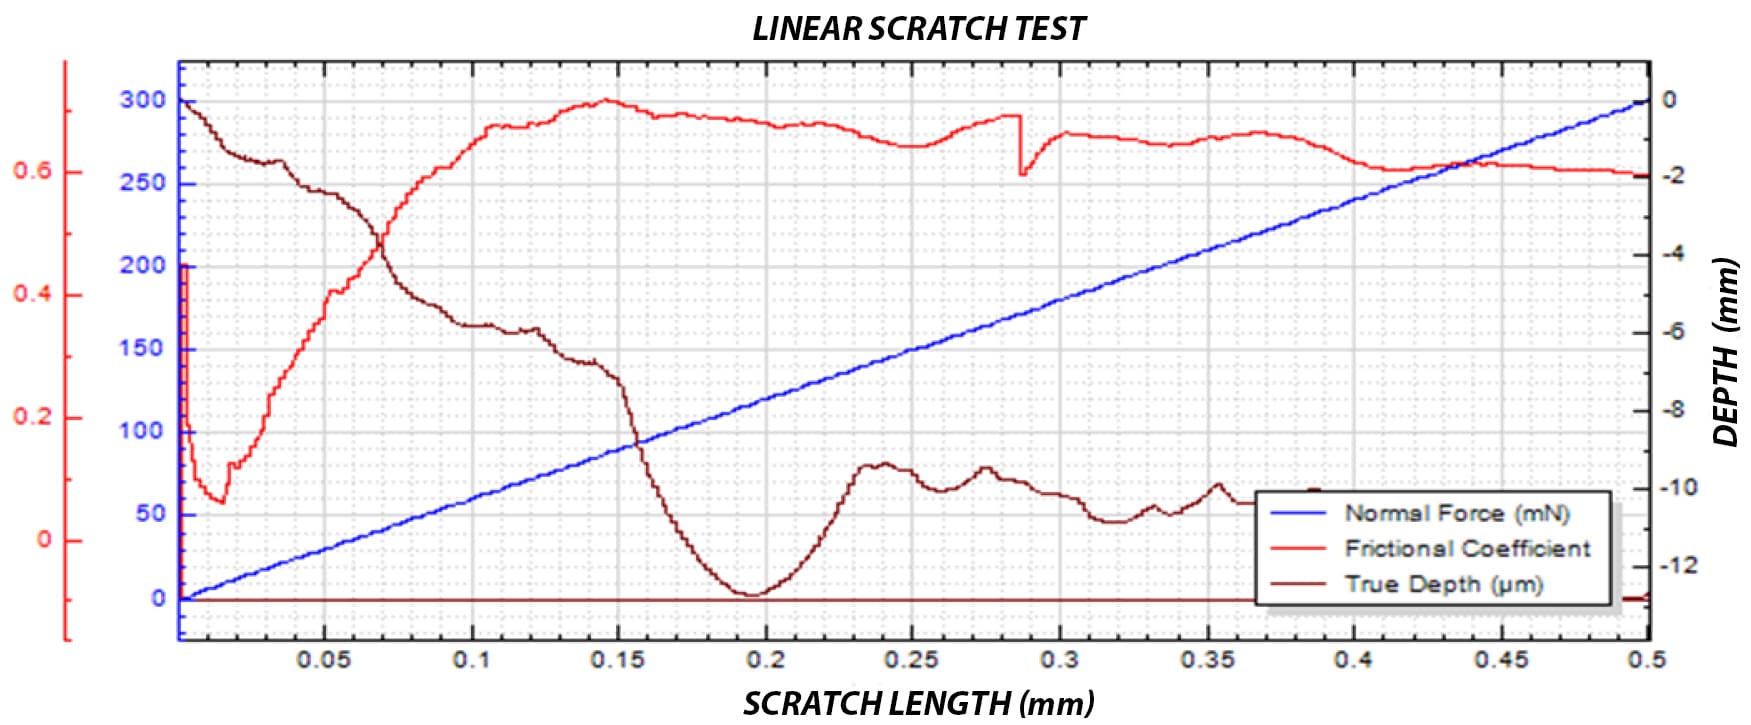
The evolution of coefficient of friction (COF) and penetration depth is shown in Fig. 4, providing insight into the progression of coating failure during the test.

The first signs of coating damage appear at Lc1 ≈ 14.5 mN. As the applied load increases, the diamond tip progressively penetrates the polymer coating, resulting in a wider and deeper scratch track. During this phase, the COF increases from approximately 0.05 to 0.7.

At Lc2 ≈ 78.1 mN, the coating is fully delaminated from the metal substrate. Beyond this point, as the load continues to increase, both COF and penetration depth remain relatively stable due to the mechanical support of the underlying metal substrate.

nano scratch track stent coating progressive load adhesion testing

(a) Full Scratch Track

(b) Lc1 ≈ 14.5 mN

stent coating delamination lc2 nano scratch 78.1 mN adhesion testing

(c) Lc2 ≈ 78.1 mN

Fig. 3: Nano scratch track on a stent coating under progressively increasing load, showing (a) full scratch path, (b) initial coating failure at Lc1 ≈ 14.5 mN, and (c) complete coating delamination at Lc2 ≈ 78.1 mN.

nano scratch testing stent coating coefficient of friction depth progression adhesion failure

Fig. 4: Evolution of coefficient of friction (COF) and penetration depth during nano scratch testing of a stent coating under progressively increasing load, showing the progression of coating failure and transition to substrate support.

Failures during nano scratch testing up to a maximum load of 300 mN occur at critical loads below 100 mN. To enable a more quantitative comparison of coating performance, additional tests are performed with a maximum load of 100 mN on two stent samples, referred to as Sample 1 and Sample 2.

Fig. 5 compares the scratch tracks of Sample 1 and Sample 2 after nano scratch testing. Sample 1 exhibits the first sign of coating damage at a critical load of Lc1 ≈ 13.2 mN, while Sample 2 shows initial failure at a higher load of Lc1 ≈ 21.1 mN.

Coating delamination occurs at 62.5 mN for Sample 1. In contrast, the coating on Sample 2 remains intact throughout the test, continuing to protect the metal substrate under the same loading conditions.
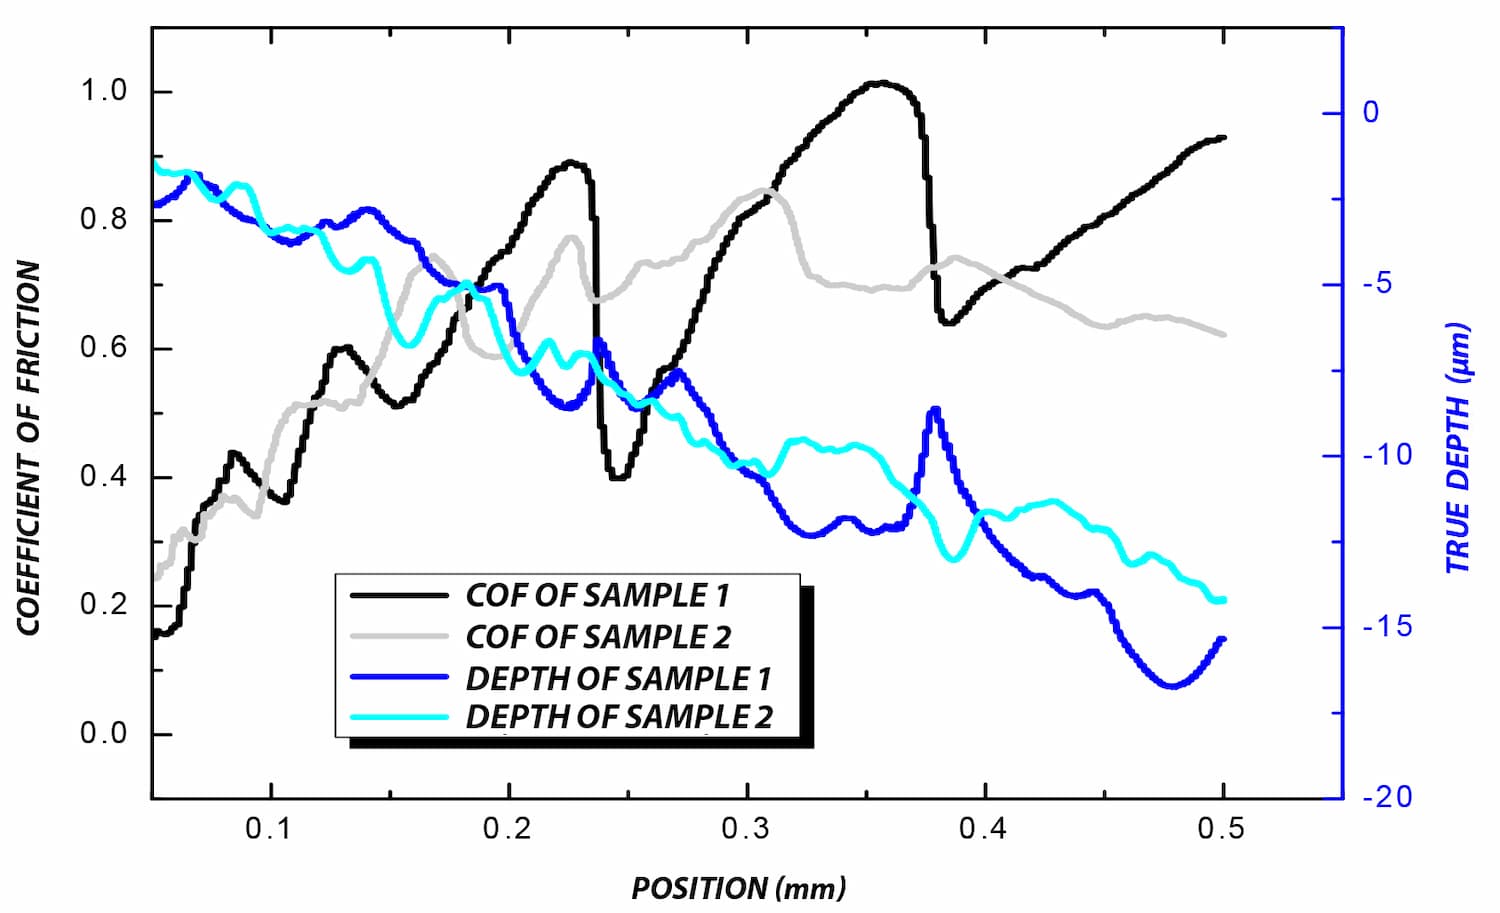
This behavior is further reflected in the evolution of coefficient of friction (COF) and penetration depth, as shown in Fig. 6. When the diamond tip penetrates through the coating and contacts the metal substrate in Sample 1, the COF reaches a peak while the penetration depth decreases due to the increased stiffness of the underlying substrate.

stent coating sample 1 early failure nano scratch track delamination adhesion testing

(a) Sample 1 – Early Coating Failure

stent coating sample 2 high adhesion nano scratch track minimal damage testing

(b) Sample 2 – Improved Coating Integrity

Fig. 5: Comparison of nano scratch tracks for two stent coatings, showing (a) early coating failure and delamination in Sample 1, and (b) improved coating integrity in Sample 2 under the same loading conditions.
nano scratch testing stent coating COF depth comparison sample 1 sample 2 adhesion performance

Fig. 6: Comparison of coefficient of friction (COF) and penetration depth for Sample 1 and Sample 2 during nano scratch testing, showing earlier substrate contact and higher friction response in Sample 1, indicating weaker coating adhesion.

2. Grooved Stent Samples

As shown in Fig. 1 and Fig. 7, the grooved stent mesh has a diameter of approximately 90 μm, comparable to a human hair. The groove has a width of ~50 μm and a depth of 30 μm. This geometry presents a significant challenge for nano scratch testing, particularly for evaluating coating adhesion at the bottom of the groove.

Precise positioning is critical to locate the scratch test within the groove. The nano scratch test is performed with a progressively increasing load up to 300 mN. The full scratch tracks of grooved stent Samples 3 and 4 are compared in Fig. 7.

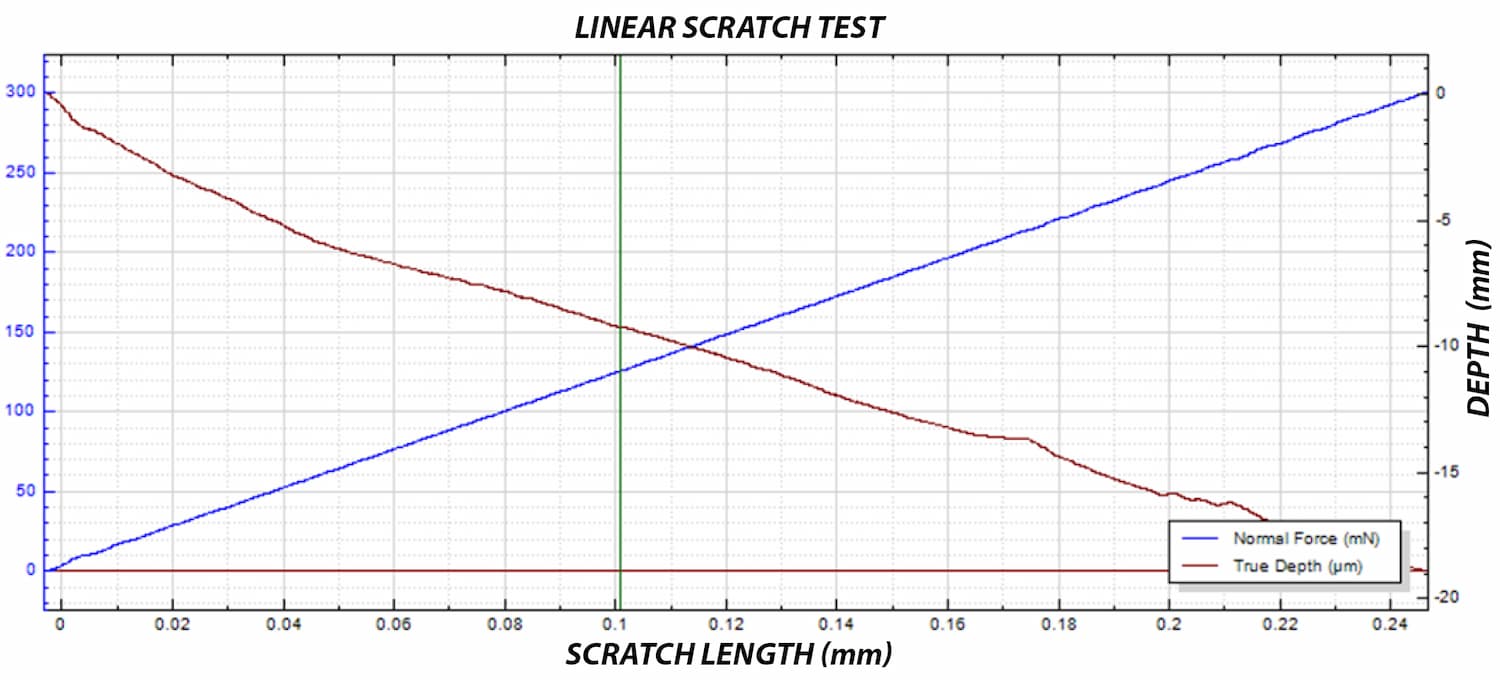
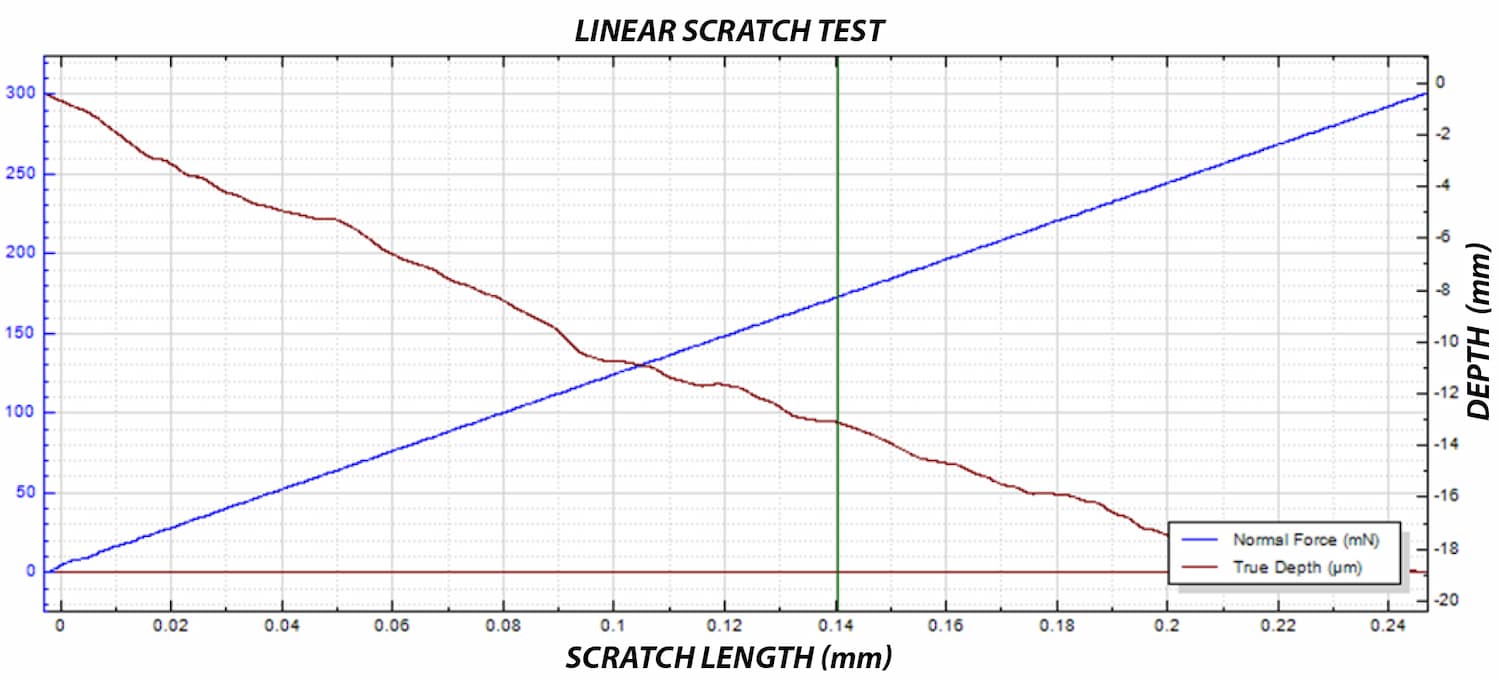
The critical load Lc is defined as the load at which the coating fails and the substrate becomes exposed. The evolution of normal load and penetration depth, shown in Fig. 8, provides further insight into the progression of coating failure during testing.

As the applied load increases, the diamond tip progressively penetrates the polymer coating, resulting in a deeper scratch track. When the critical load Lc is reached, the coating delaminates from the metal substrate.

Sample 3 exhibits coating failure at Lc ≈ 126 mN, while Sample 4 fails at a higher load of Lc ≈ 173 mN. This difference indicates stronger adhesion of the coating in Sample 4.

The measured critical loads enable quantitative comparison of coating adhesion performance. Under the same testing conditions, the coating on Sample 4 demonstrates higher resistance to delamination, making it the better-performing candidate in this study.

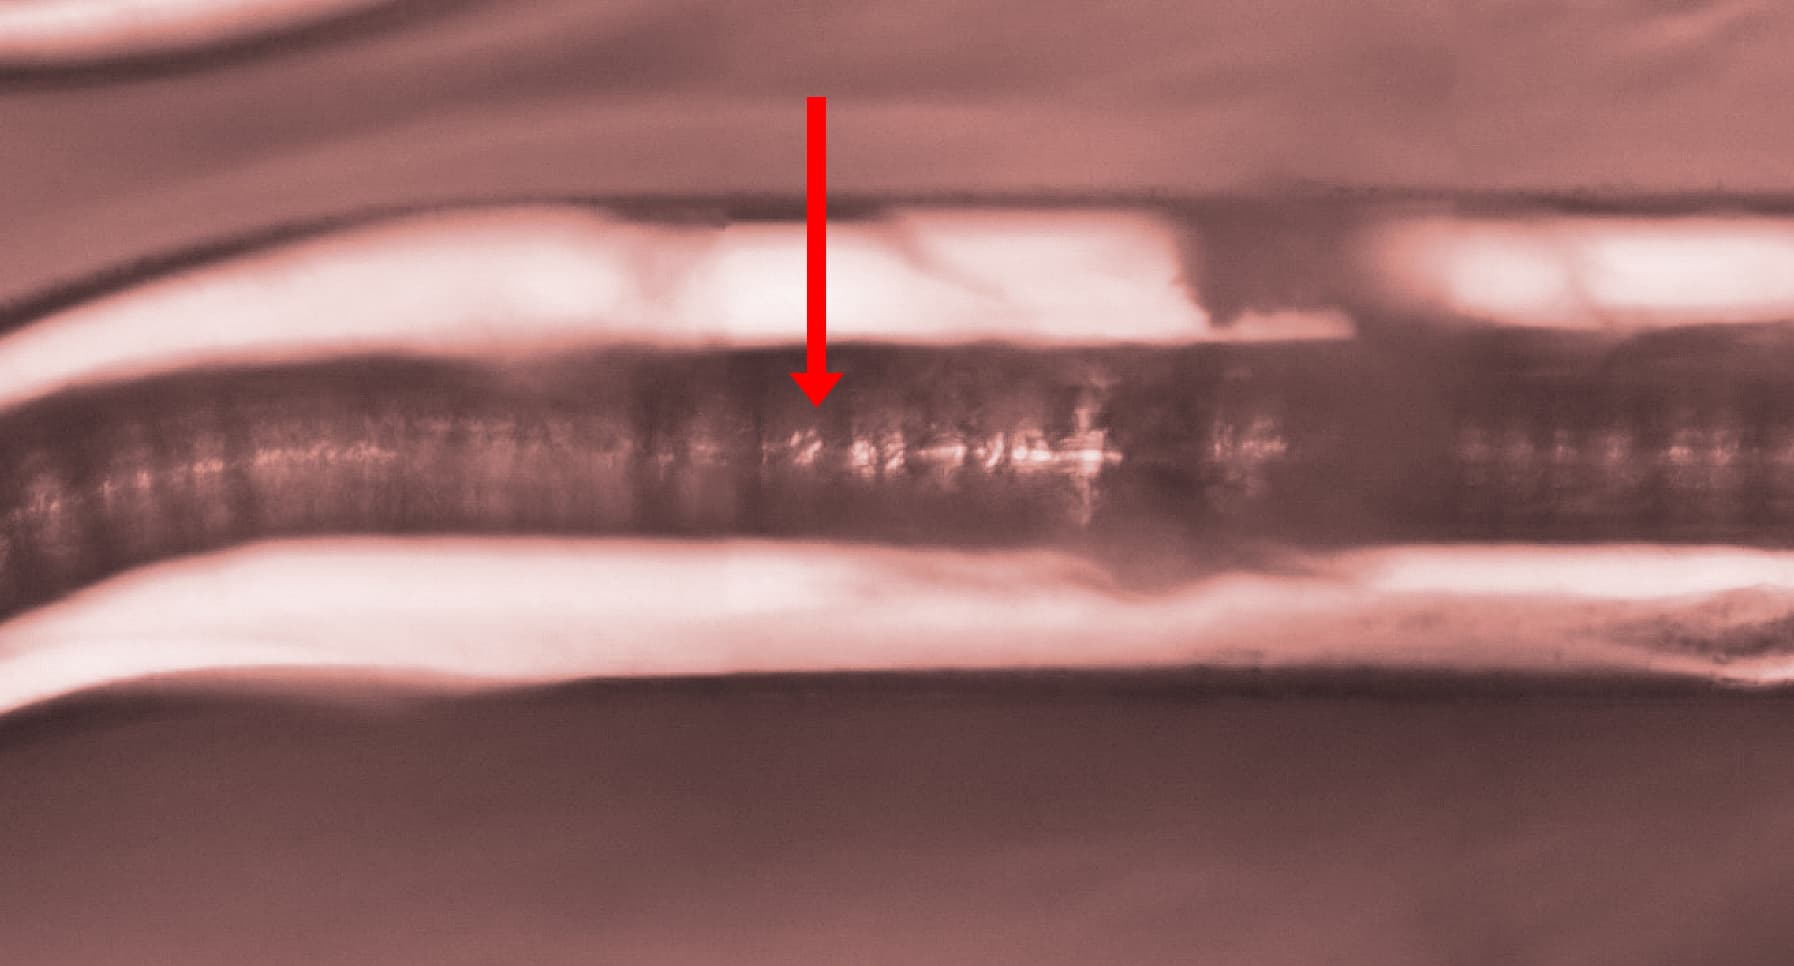
stent groove coating failure sample 3 nano scratch 126 mN adhesion testing

(c) Sample 3 – Coating Failure in Groove (Lc ≈ 126 mN)

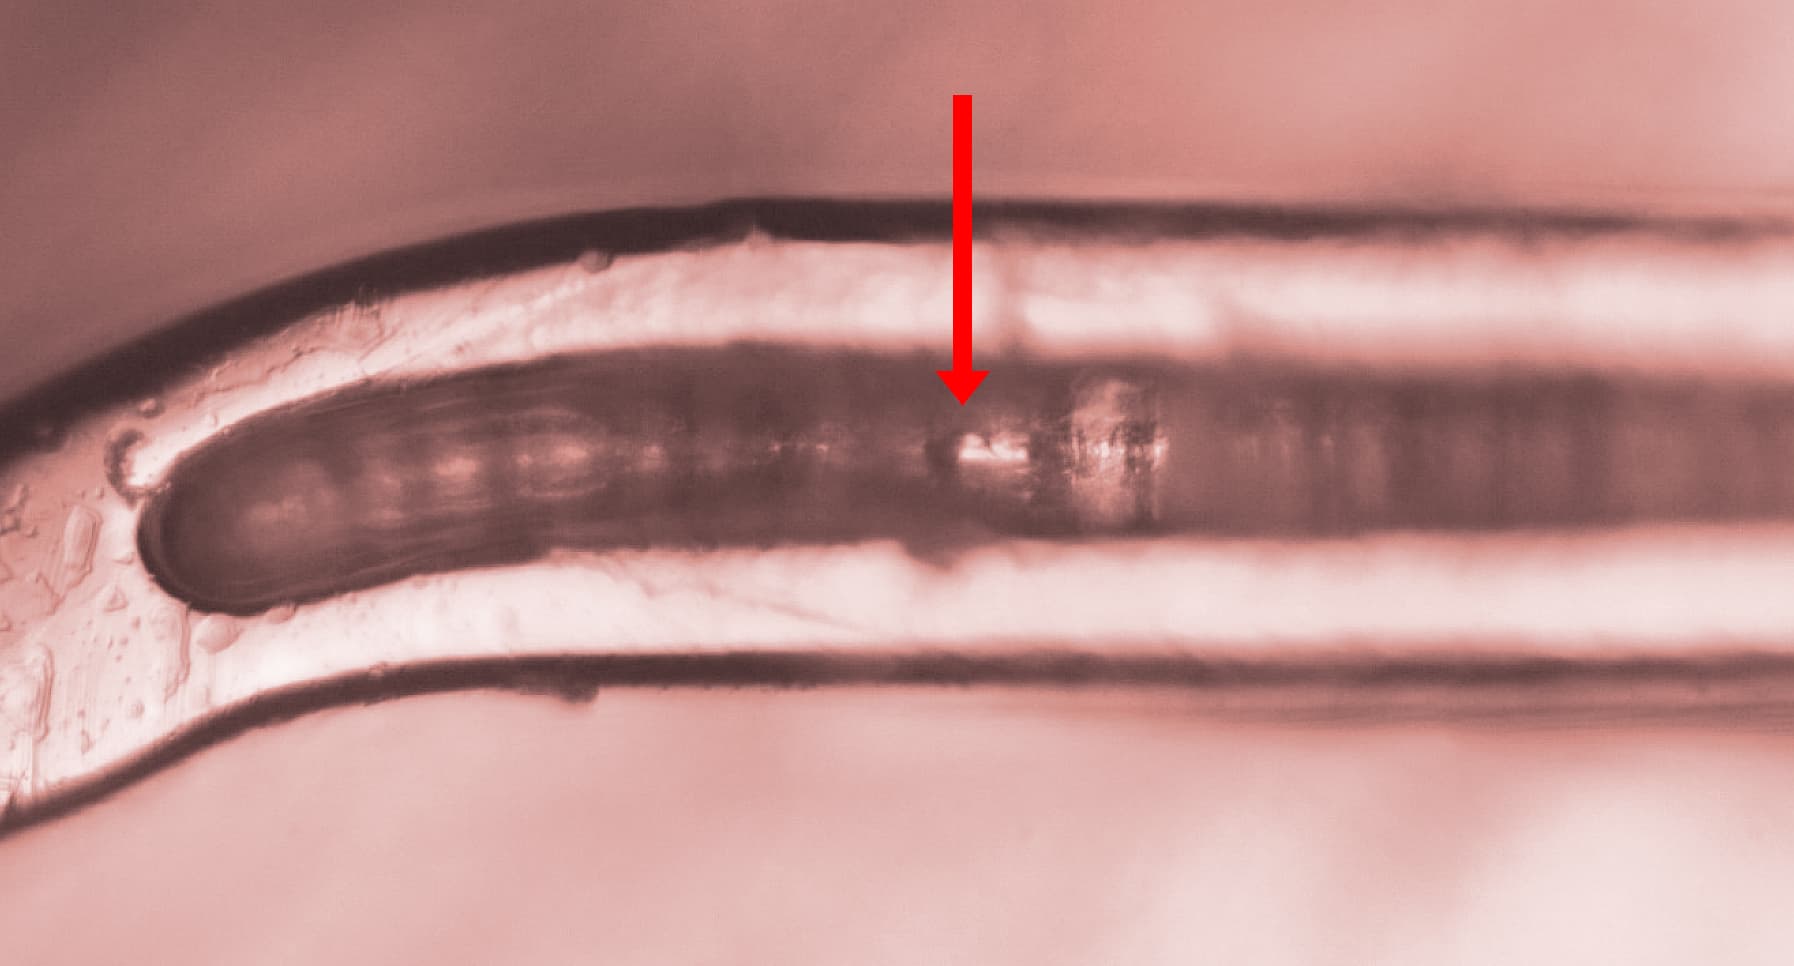
stent groove coating adhesion sample 4 nano scratch 173 mN minimal failure testing

(d) Sample 4 – Higher Adhesion in Groove (Lc ≈ 173 mN)

Fig. 7: Nano scratch tracks inside stent grooves for Samples 3 and 4, showing (c) coating failure at Lc ≈ 126 mN in Sample 3 and (d) higher adhesion with delayed failure at Lc ≈ 173 mN in Sample 4.

(a) Sample 3 – Earlier Coating Failure (Lc ≈ 126 mN)

(b) Sample 4 – Delayed Failure and Higher Adhesion (Lc ≈ 173 mN)

Fig. 8: Evolution of normal load and penetration depth during nano scratch testing inside stent grooves for Samples 3 and 4, showing earlier coating failure in Sample 3 and delayed failure at higher load in Sample 4. The vertical green line indicates the critical load (Lc) where coating delamination occurs.

結論

This study demonstrates the ability of the NANOVEA Mechanical Tester to quantitatively evaluate the cohesive and adhesive strength of polymer coatings on both regular and grooved stent geometries using nano scratch testing.

The recessed geometry of the stent grooves, approximately 50 μm wide and 30 μm deep, presents a significant challenge for coating adhesion measurement. The high X–Y positioning accuracy of 0.25 μm enables precise placement of the scratch test within these confined regions, allowing direct evaluation of coating performance where failure is most critical.

By applying a controlled, progressively increasing load, critical loads associated with coating failure can be identified and compared across samples. This approach enables reliable differentiation of coating adhesion performance and interfacial integrity, even on small, complex stent structures.

参考文献

[I] http://www.nhlbi.nih.gov/health/health-topics/topics/stents
[II] http://www.scielo.org.mx/scielo.php?script=sci_arttext&pid=S1405-99402006000300008

Frequently Asked Questions About Stent Coating Adhesion Testing

What is stent coating adhesion testing?

Stent coating adhesion testing evaluates how strongly a polymer coating is bonded to the metal substrate of a stent. Techniques such as nano scratch testing quantify the load at which coating damage and delamination occur, providing measurable indicators of adhesion strength.

What is critical load (Lc) in nano scratch testing?

Critical load (Lc) is the applied load at which a coating fails during a scratch test.

  • Lc1 corresponds to the first visible damage in the coating
  • Lc2 indicates complete coating removal and exposure of the substrate

These values are used to quantify and compare coating adhesion performance.

Why is coating adhesion important in drug-eluting stents?

Coating adhesion directly affects the reliability of drug-eluting stents. Poor adhesion can lead to coating delamination, which may compromise controlled drug release and increase the risk of device failure.

How do you measure coating adhesion inside stent grooves?

Measuring adhesion inside stent grooves requires high positioning accuracy and appropriate indenter geometry. Nano scratch testing with sharp diamond tips allows access to recessed coating regions, enabling direct evaluation of adhesion within complex stent geometries.

What does coefficient of friction (COF) indicate in scratch testing?

The coefficient of friction (COF) reflects changes in surface interaction during the scratch test. A sudden increase in COF often indicates coating failure and contact between the indenter and the underlying metal substrate.

How can nano scratch testing compare different coating formulations?

Nano scratch testing enables direct comparison of coatings by measuring critical loads under controlled conditions. Higher critical loads indicate stronger adhesion and improved resistance to delamination, allowing selection of better-performing coating systems.
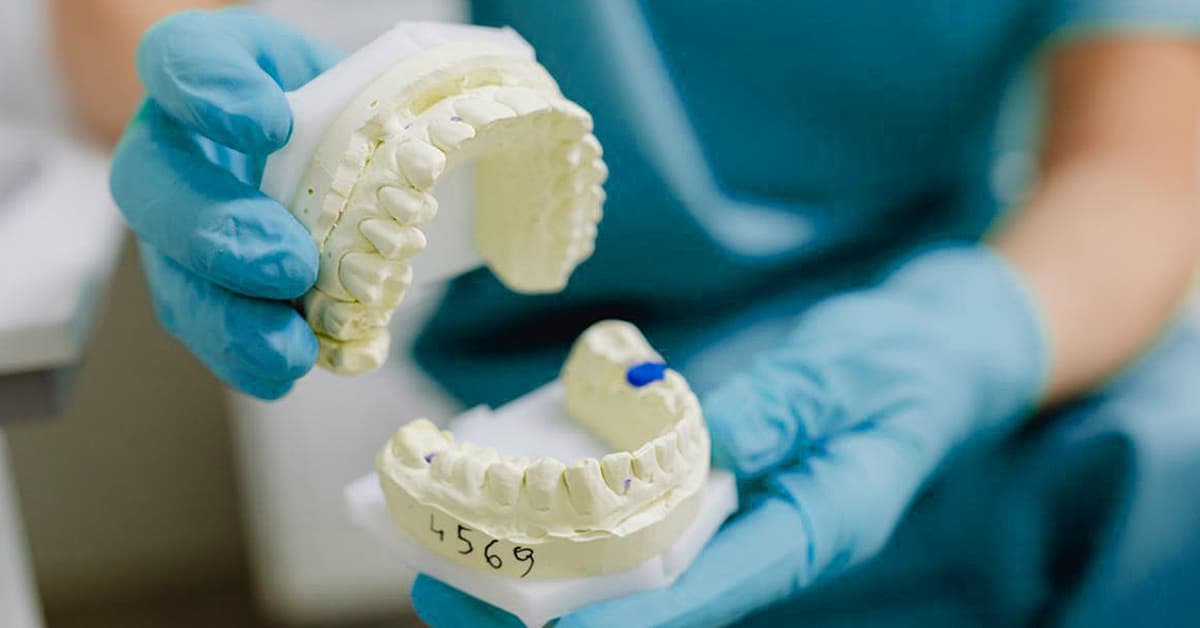
Dentist holding dental model for tooth surface roughness analysis and 3D reconstruction

Dental Surface Roughness Measurement & 3D Tooth Topography

Application Note | Dental Surface Characterization

Dental Surface Roughness Measurement and Full 3D Tooth Topography

Surface Roughness Analysis Using Non-Contact Optical Profilometry

Dental surface roughness measurement and 3D molar reconstruction using optical profilometry

作成者

Walter Alabiso, PhD; Davide Morrone, MPhys; Andrew Shore, MA

はじめに

The ability to accurately characterize tooth surfaces, including micro-roughness and 3D surface topography at the nanometer scale, enables advanced research and applications in orthodontics and dental materials science. Non-contact optical profilometry provides a precise method for measuring dental surface roughness and analyzing tooth surface morphology without damaging delicate structures. These measurements support the development of composite dental materials that replicate the natural surface roughness of enamel, as well as the design and fabrication of patient-specific dental casts and restorative components.

Low surface roughness plays a primary role in limiting bacterial adhesion and plaque formation, thereby reducing the risk of cavities. An increase in average roughness (Ra) above 2 µm leads to a steep increase in biofilm formation in vivo.¹ An Ra of 0.2 µm is considered the threshold value below which no further reduction in bacterial adhesion can be expected.²

Reconstruction of the tooth’s 3D surface topography enables the fabrication of dental casts, which are essential for accurate diagnosis, treatment planning, and the fabrication of dental appliances.

Non-Contact Optical Profilometry for Dental Surface Analysis

The present study illustrates the potential of NANOVEA’s high-precision non-contact optical profilometers for dental surface roughness measurement and 3D tooth topography analysis. Chromatic Light technology offers significant advantages over classical touch probe techniques. It acquires data points from deep crevices and complex geometries without introducing measurement errors or artifacts caused by local plastic deformation and without requiring extensive data manipulation.

Compared to focus variation systems, single-point optical sensing provides superior lateral and height accuracy, with X/Y resolution below 0.5 µm, maximum vertical resolution of 1.9 nm, and the ability to measure surface angles up to 87°. The technique is effective on transparent, opaque, specular, diffusive, polished, and rough dental surfaces, making it well suited for comprehensive dental surface characterization.

Measurement Method

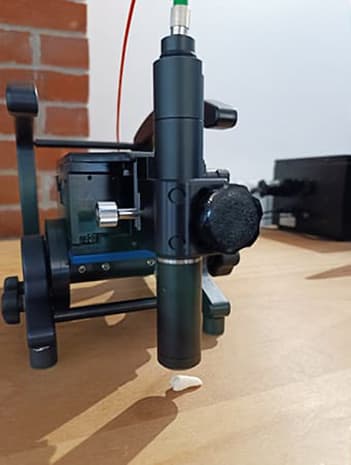
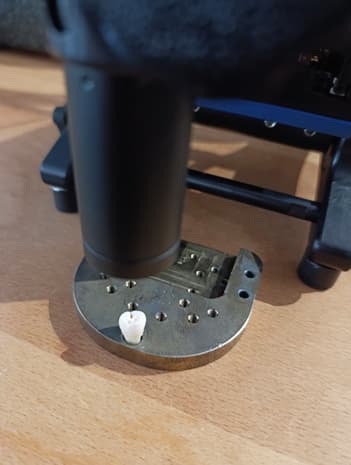
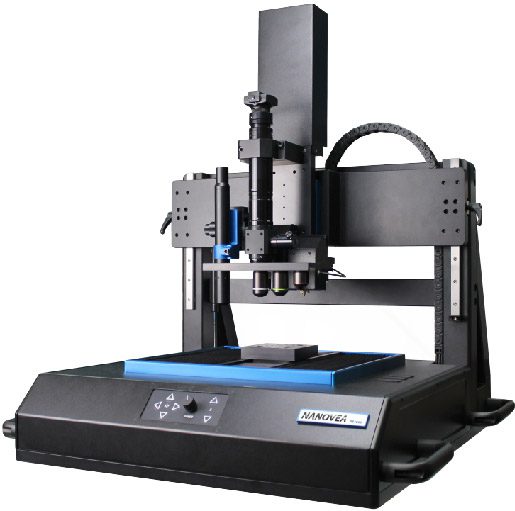
このアプリケーションでは NANOVEA JR25 Non-Contact Optical Profiler was used to analyze the surface roughness and 3D surface topography of an adult human molar previously affected by tooth decay. The side of the tooth was scanned using a PS2–MG140 single-point optical sensor to measure surface roughness parameters over a defined region of interest and along multiple line profiles.

The crown of the tooth was then scanned and reconstructed using a PS5–MG35 single-point optical sensor, which is suited for larger-area acquisition and full 3D tooth topography measurement.


ナノビア JR25 Portable
光学式表面形状計

Surface Measurement Using NANOVEA Optical Profilometer

Surface roughness measurements were performed on the lateral side of the molar crown, followed by full 3D reconstruction of the crown surface. Separate single-point optical sensors were used to optimize measurement accuracy for both localized roughness analysis and large-area surface topography acquisition.

PS2 – MG140

Surface roughness analysis by area and parallel line profiles on the side of the tooth’s crown.

PS5 – MG35

Full 3D surface reconstruction of the tooth’s crown.

測定パラメータ

The following measurement parameters were used for localized surface roughness analysis and full 3D surface reconstruction of the molar crown using NANOVEA single-point optical sensors.

Parameter Roughness Analysis (Area) Roughness Analysis (Profiles) Full 3D Reconstruction
Optical Pen PS2-MG140 PS2-MG140 PS5-MG35
Z-Range [µm] 300 300 10000
X-Distance [mm] 2.00 3.00 7.50
X-Step Size [µm] 1.70 1.70 10.00
Y-Distance [mm] 2.00 1.00 7.00
Y-Step Size [µm] 1.70 100.00 10.00
Averaging (Avg) 1 1 1
Measurement Type Direct Direct Direct
Acquisition Mode Single Frequency Single Frequency Dual Frequency
Acquisition Rate [Hz] 200 200 100–400
Light Intensity [%] 100 100 100

Optical Profilometry Results

Surface Roughness Analysis (Area)

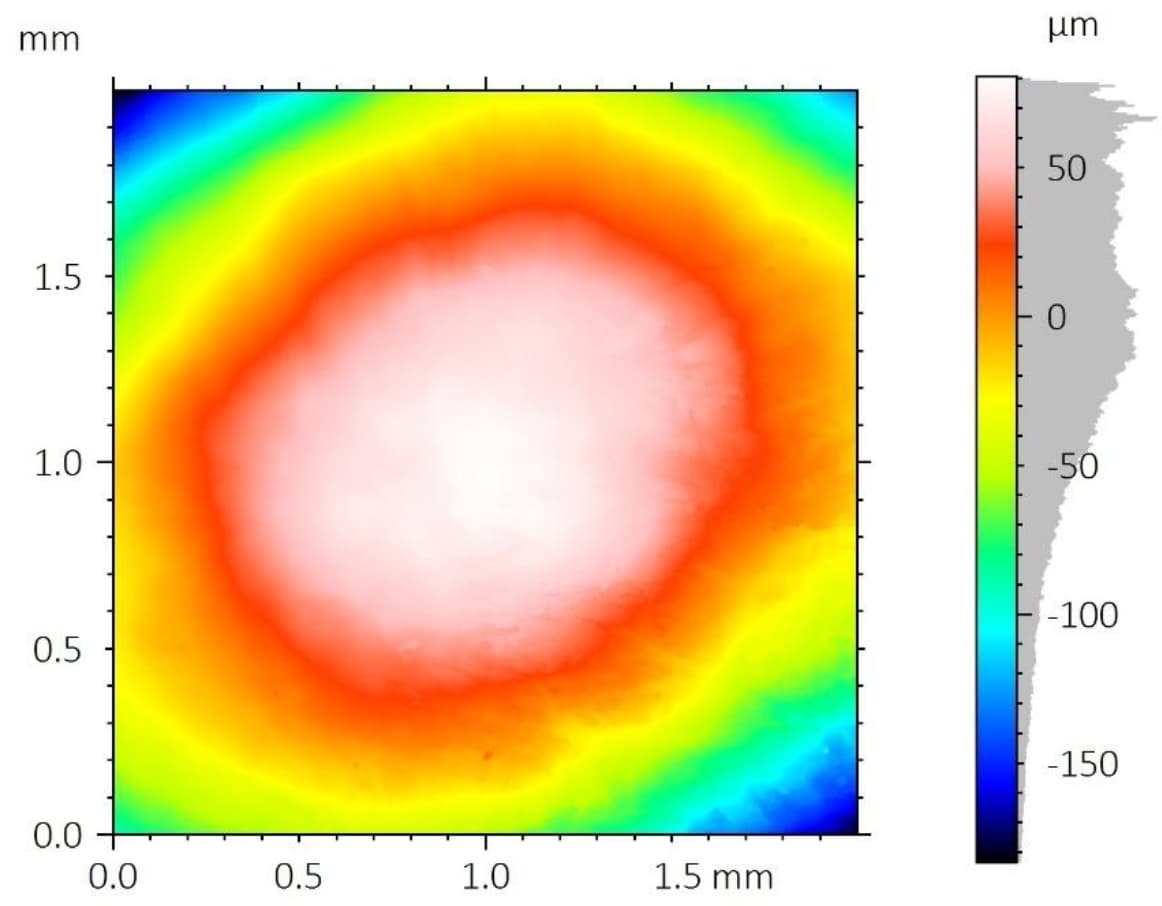
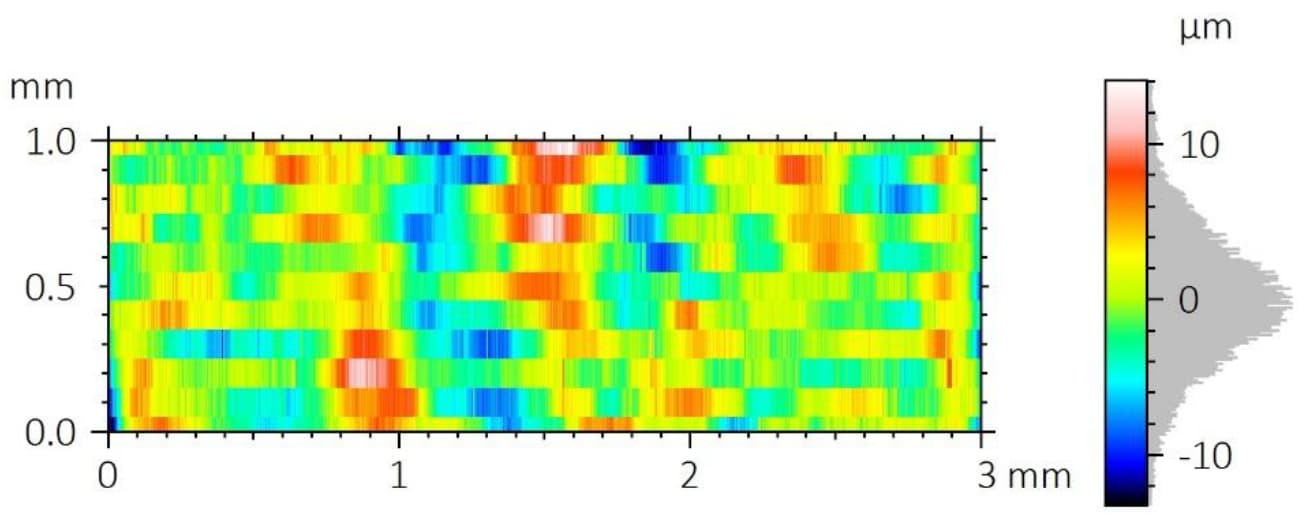
The PS2 single-point optical sensor was used to investigate fine surface features on the side of the tooth. The image below shows a false-color 2D surface map of the scanned region obtained by non-contact optical profilometry.

False-color 2D height map of scanned tooth surface region

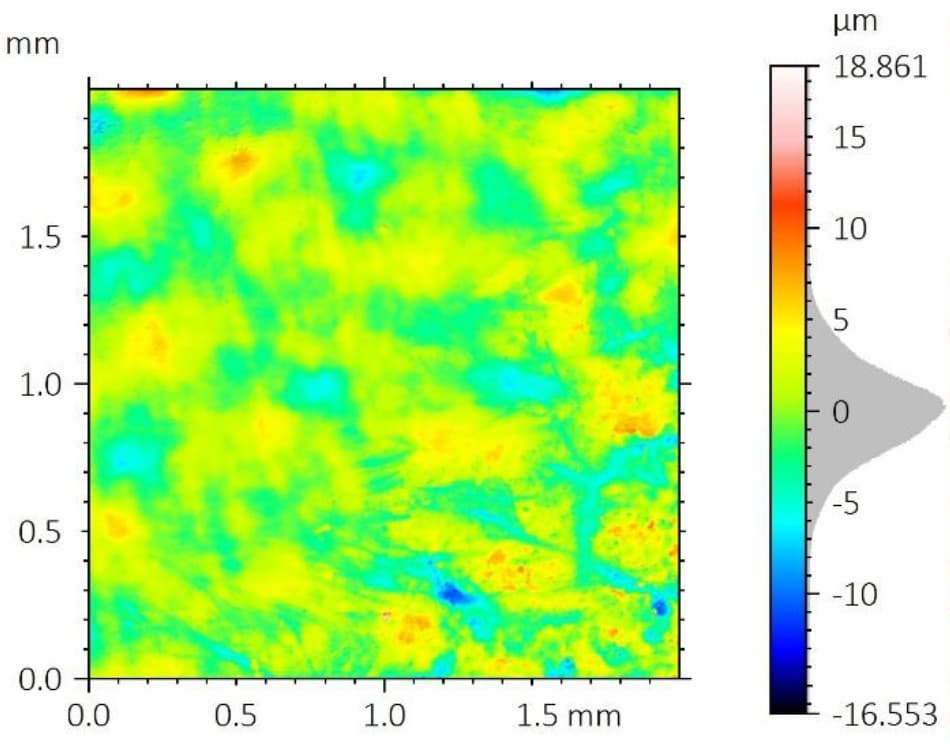
A least-squares degree-8 polynomial form removal was applied to isolate the surface roughness component. The roughness filters S-Gaussian 2.5 µm and L-Gaussian 0.8 mm were then applied according to ISO 25178. The resulting filtered surface and corresponding roughness parameters are presented below.

ISO 25178 – Roughness (S-L)
S-filter (λs): Gaussian, 2.5 µm
F: [Workflow] Form removed (LS-poly 8)
L-filter (λc): Gaussian, 0.8 mm
Height Parameters
スク2.433µm二乗平均平方根の高さ
エスケープ-0.102 歪度
スクー3.715 クルトーシス
Sp18.861µm最大ピーク高さ
エスブイ16.553µmMaximum pit depth
エスエス35.414µm最高高さ
1.888µm算術平均身長

The average surface roughness Sa is 1.888 µm, while the peak-to-valley height Sz reaches 35.414 µm.

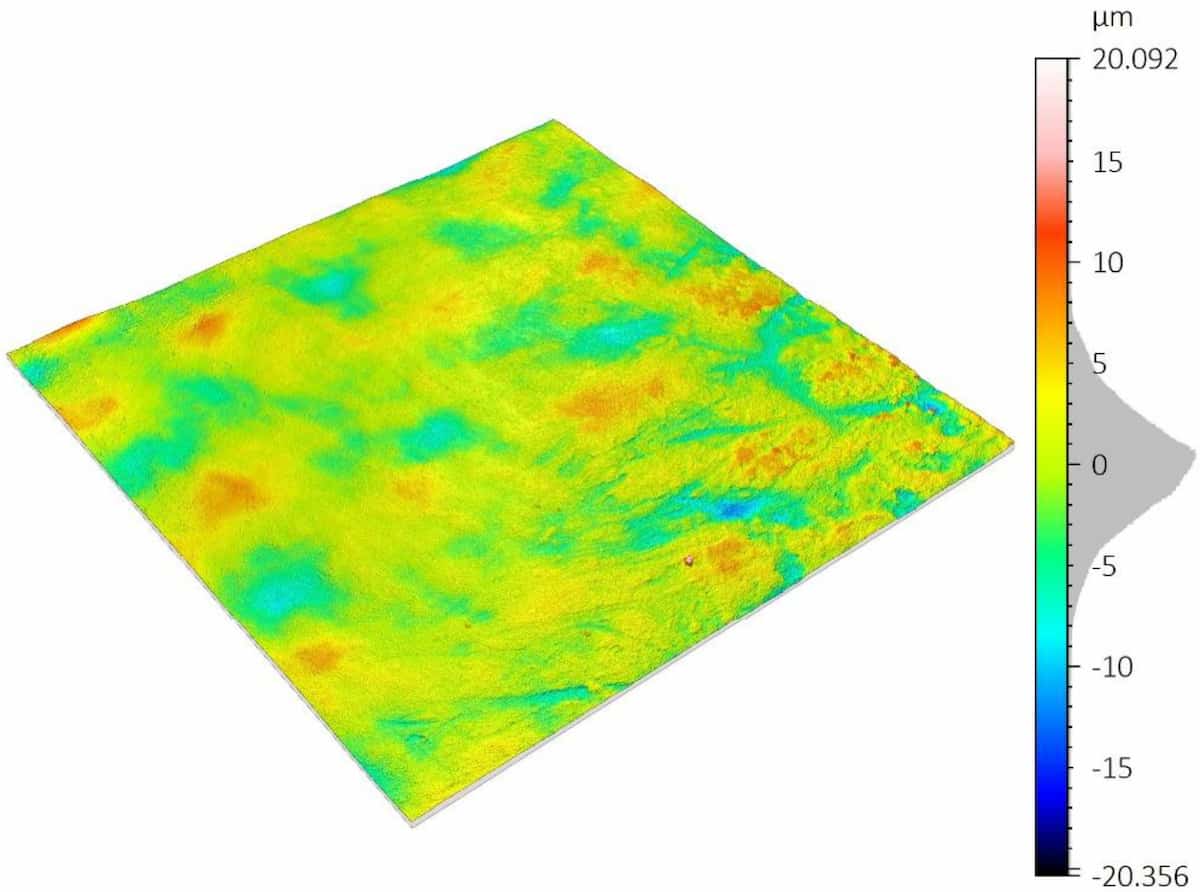
A 3D surface rendering of the filtered area is shown below for visualization.

3D rendering of ISO 25178 filtered tooth surface roughness

Roughness Analysis (Profiles)

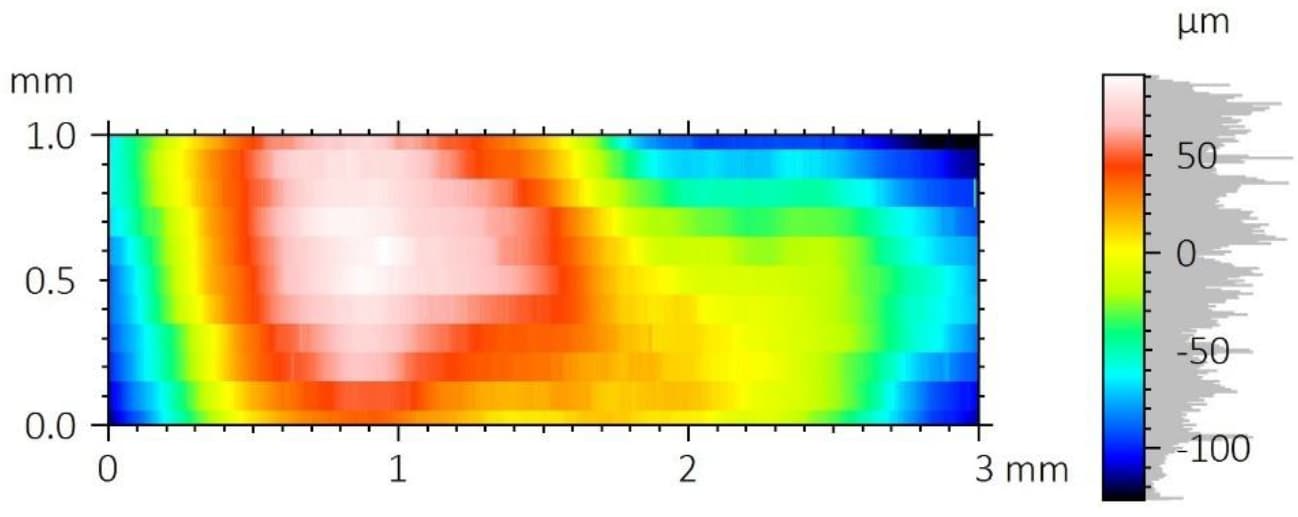
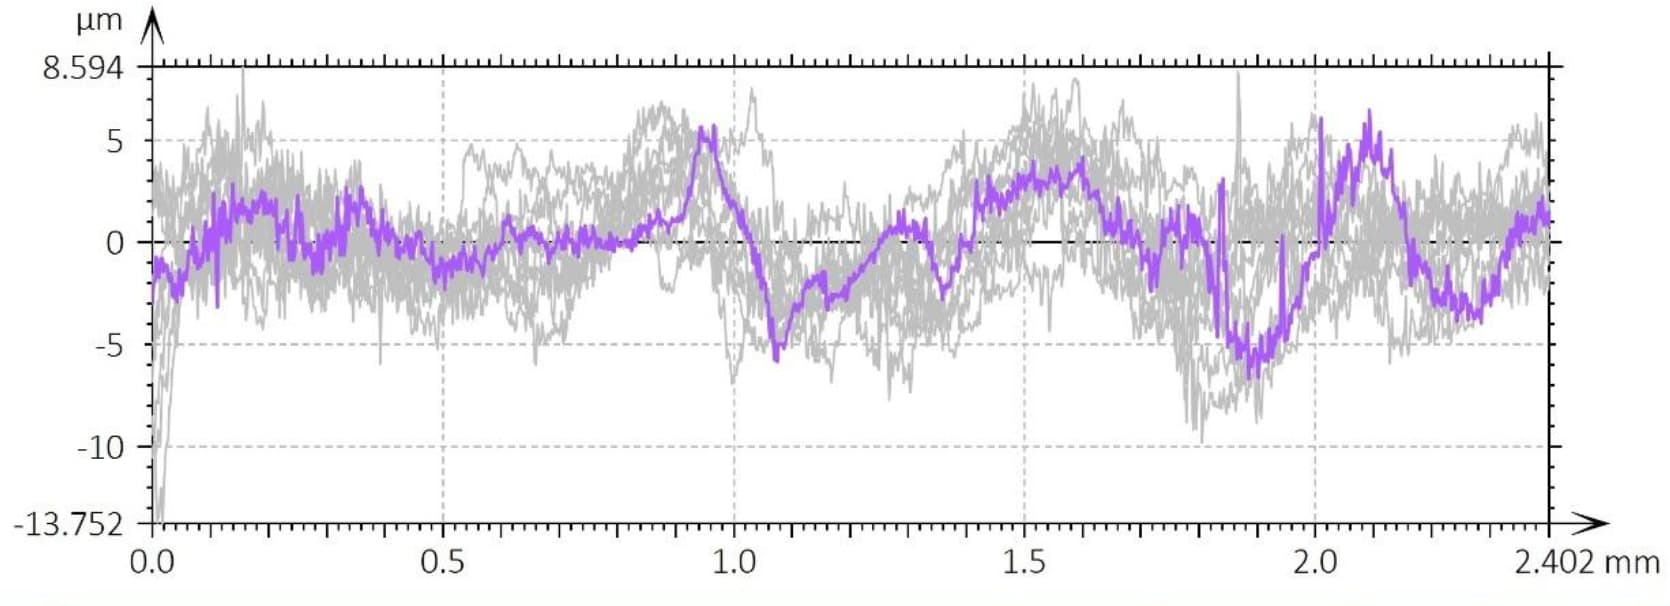
Surface roughness profiles were measured using a series of 11 parallel line scans along the X direction on the side of the tooth. The false-color 2D surface map of the raw scan is shown below.

False-color 2D raw scan of tooth surface for line roughness profiles

The surface form was removed using a least-squares 8-degree polynomial prior to applying the metrological filters, leaving the residual surface shown below.

A statistical analysis of the measured surface roughness profiles reveals the following line roughness parameters.

Overlay of multiple tooth surface roughness profiles for statistical analysis

ISO 4287 – Roughness (S-L)
F: なし
S-filter (λs): Gaussian, 2.5 µm
L-filter (λc): Gaussian, 0.8 mm
Evaluation length: All λc (3)
Amplitude Parameters – Roughness Profile
  DescriptionMeanStd devMinMax
RpµmMaximum peak height of the roughness profile5.6830.7614.3156.610
RvµmMaximum valley depth of the roughness profile6.2421.0094.7018.438
RzµmMaximum height of roughness profile11.9251.6769.12315.048
RaµmArithmetic mean deviation of the roughness profile2.0630.2971.7102.629
RqµmRoot-mean-square (RMS) deviation of the roughness profile2.5230.3612.0573.175

ISO 4287 – Roughness (S-L)
F: なし
S-filter (λs): Gaussian, 2.5 µm
L-filter (λc): Gaussian, 0.8 mm
Evaluation length: All λc (3)
Amplitude Parameters – Roughness Profile
Rpµm
Maximum peak height of the roughness profile
Mean5.683
Std dev0.761
Min4.315
Max6.610
Rvµm
Maximum valley depth of the roughness profile
Mean6.242
Std dev1.009
Min4.701
Max8.438
Rzµm
Maximum height of roughness profile
Mean11.925
Std dev1.676
Min9.123
Max15.048
Raµm
Arithmetic mean deviation of the roughness profile
Mean2.063
Std dev0.297
Min1.710
Max2.629
Rqµm
Root-mean-square (RMS) deviation of the roughness profile
Mean2.523
Std dev0.361
Min2.057
Max3.175

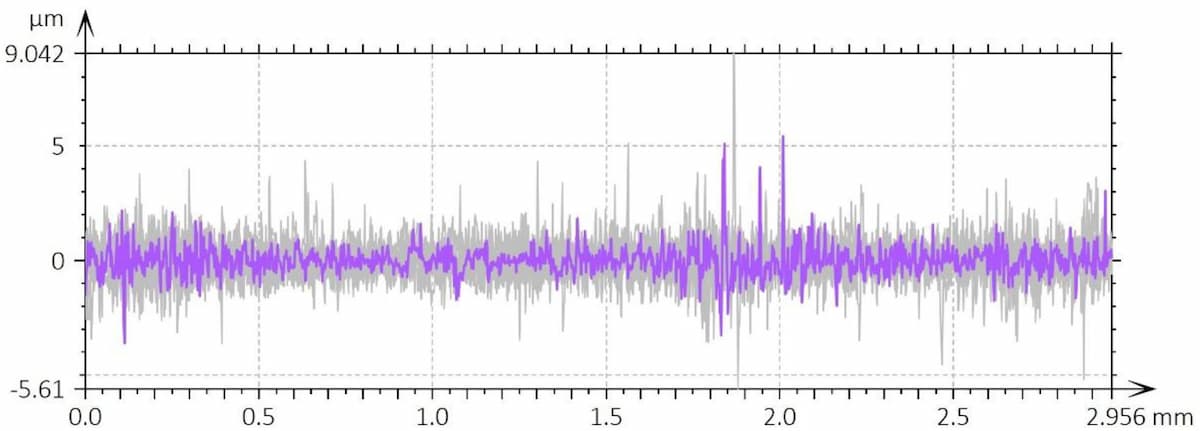
The value of Ra is consistent with the Sa value extracted from the surface area measurement.

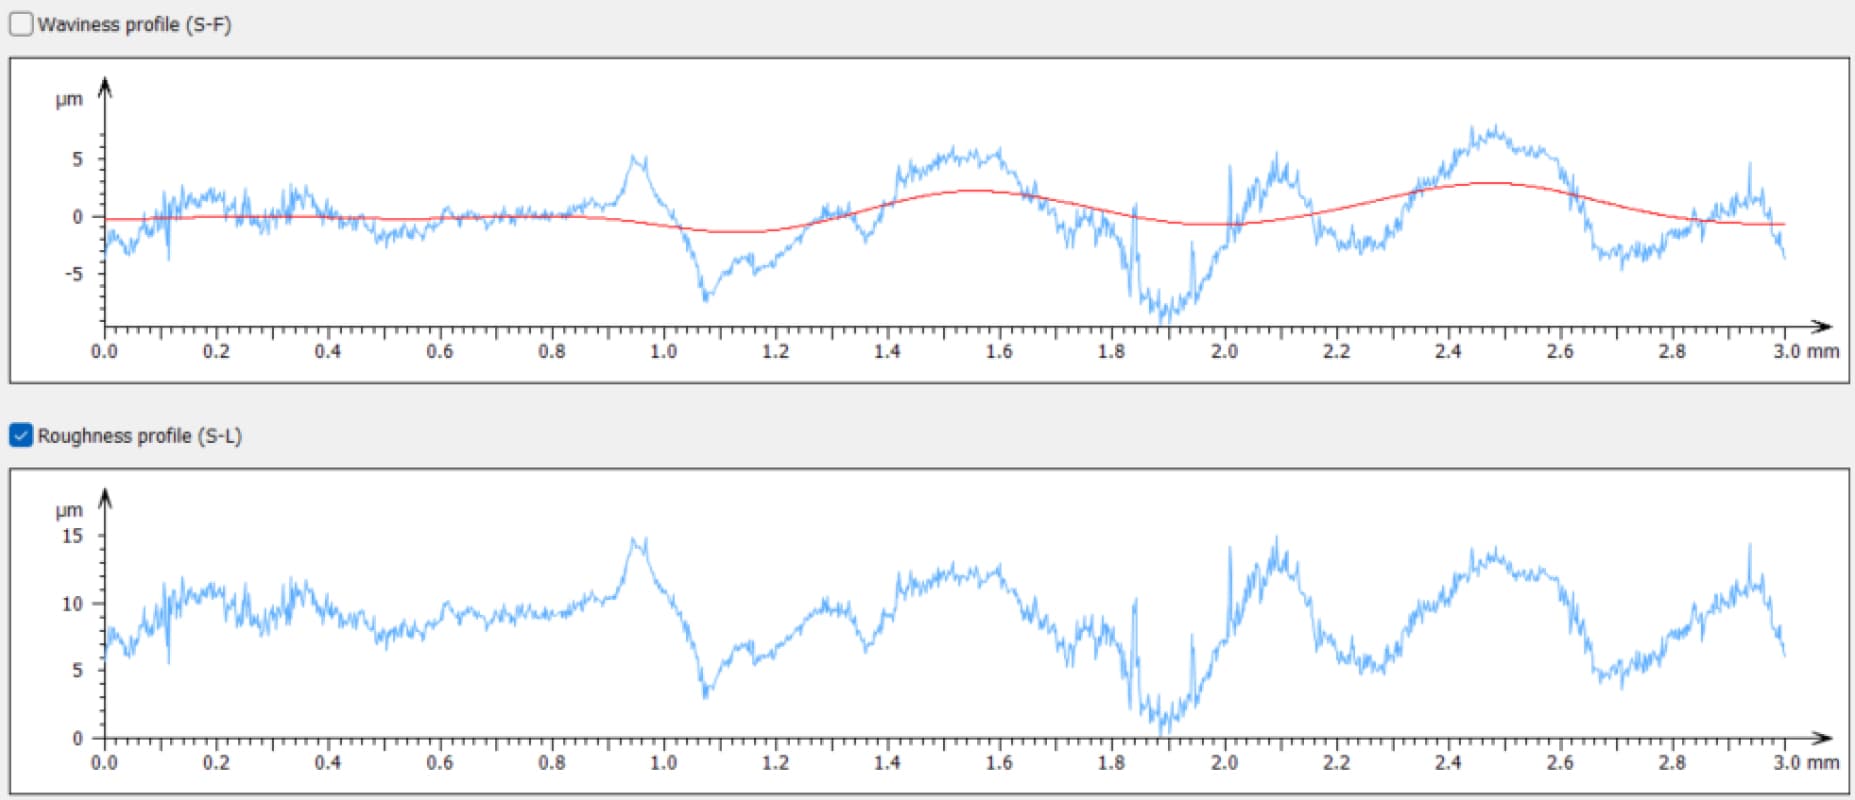
Different metrological filters can be applied to distinguish between macroscopic waviness and microscopic surface roughness. For example, a coarser filter cut-off, such as the 8 mm cut-off used with the Robust Gaussian order-2 filter, produces a smoother waviness profile (red) that is less sensitive to sharp local variations and follows the original surface profile more loosely.

Comparison of waviness and roughness profiles on tooth surface using coarse filter

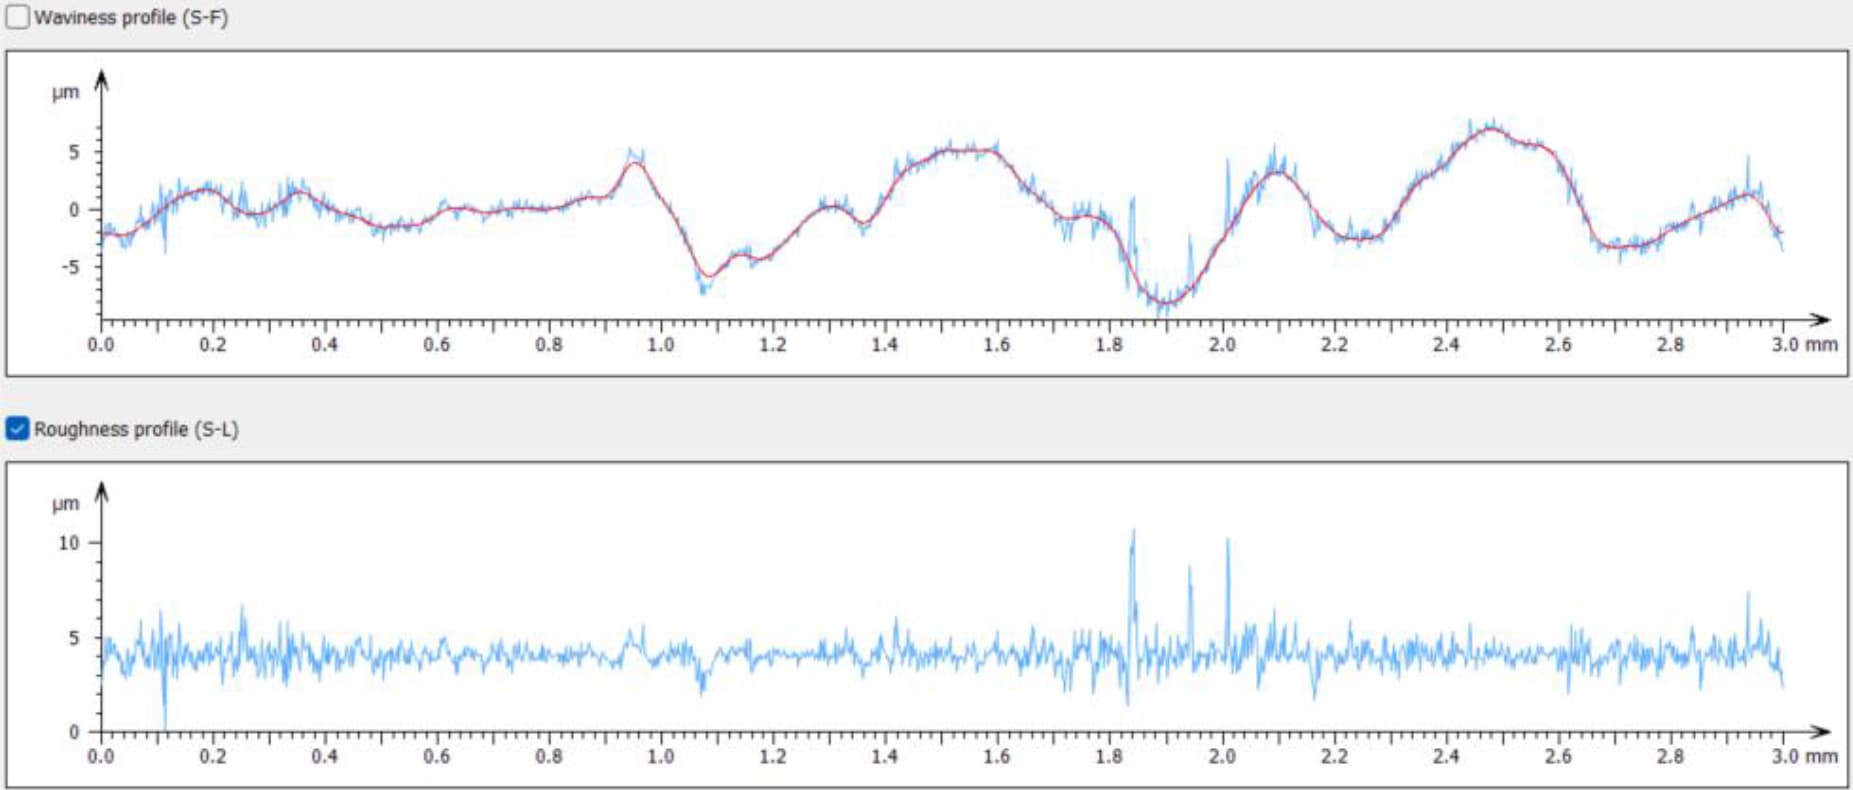
Alternatively, a finer cut-off (e.g., 0.08 mm) enables the analysis of micro-roughness by removing the waviness component that follows the original profile at a larger scale, leaving the finer surface roughness features of the tooth visible.

The microroughness analysis obtained using a 0.08 mm L-Gaussian filter is presented below.

Final microroughness profile of tooth surface after filtering

ISO 4287 – Roughness (S-L)
F: なし
S-filter (λs): Gaussian, 2.5 µm
L-filter (λc): Gaussian, 0.08 mm
Evaluation length: All λc (37)
Amplitude Parameters – Roughness Profile
  DescriptionMeanStd devMinMax
RpµmMaximum peak height of the roughness profile1.5820.1221.3421.748
RvµmMaximum valley depth of the roughness profile1.4660.1191.2541.661
RzµmMaximum height of roughness profile3.0490.1962.8203.409
RaµmArithmetic mean deviation of the roughness profile0.4950.0470.4230.597
RqµmRoot-mean-square (RMS) deviation of the roughness profile0.6430.0560.5620.762

ISO 4287 – Roughness (S-L)
F: なし
S-filter (λs): Gaussian, 2.5 µm
L-filter (λc): Gaussian, 0.8 mm
Evaluation length: All λc (3)
Amplitude Parameters – Roughness Profile
Rpµm
Maximum peak height of the roughness profile
Mean5.683
Std dev0.761
Min4.315
Max6.610
Rvµm
Maximum valley depth of the roughness profile
Mean6.242
Std dev1.009
Min4.701
Max8.438
Rzµm
Maximum height of roughness profile
Mean11.925
Std dev1.676
Min9.123
Max15.048
Raµm
Arithmetic mean deviation of the roughness profile
Mean2.063
Std dev0.297
Min1.710
Max2.629
Rqµm
Root-mean-square (RMS) deviation of the roughness profile
Mean2.523
Std dev0.361
Min2.057
Max3.175

Full 3D Tooth Surface Topography Reconstruction

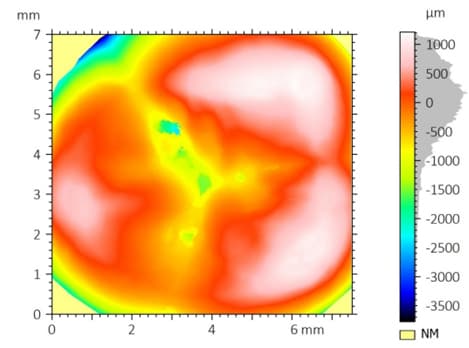
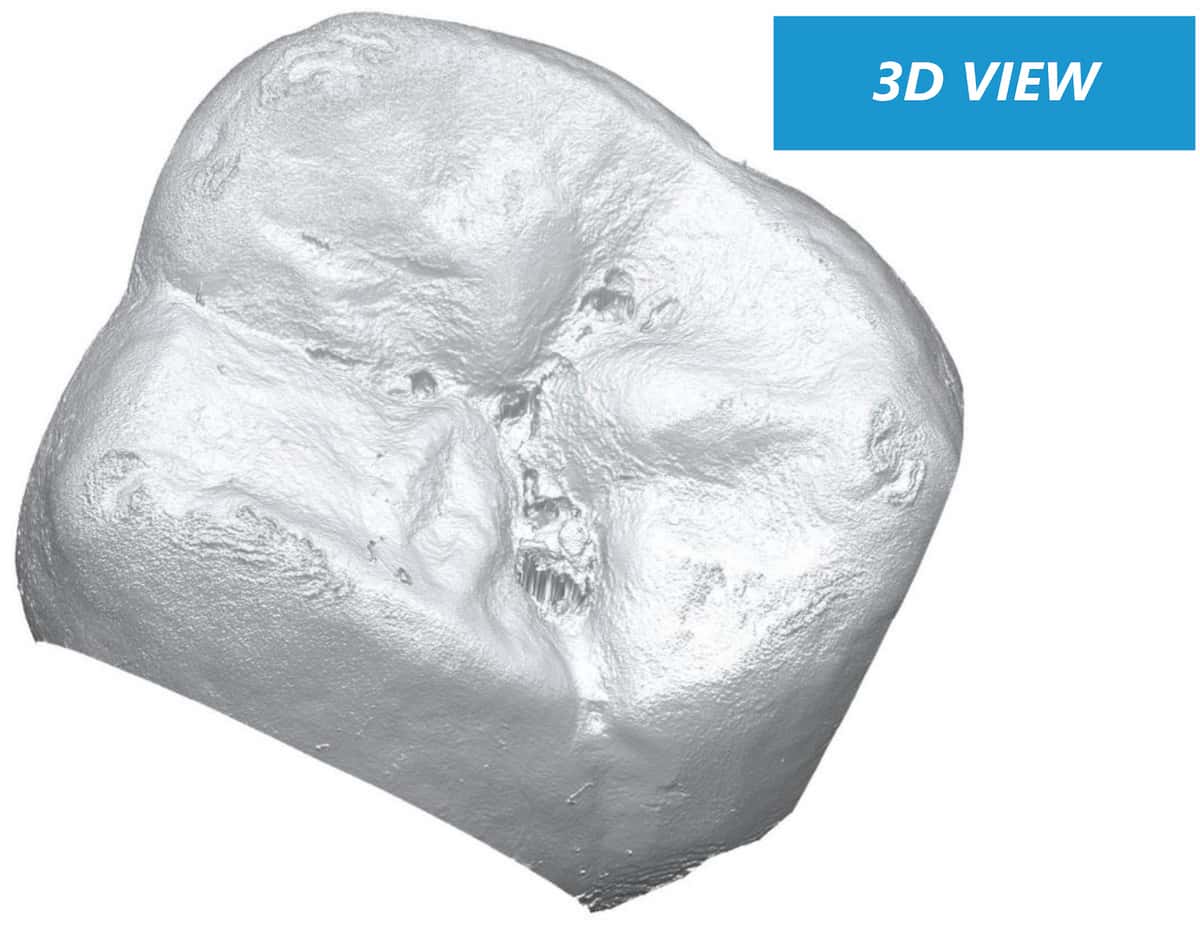
The extended Z-scan range of the PS5 optical sensor enables high-fidelity scanning of the entire tooth crown surface. The resulting 3D surface topography is shown below.

False-color surface topography map of full tooth crown measured with optical profilometer

2D VIEW: 2D surface map of the tooth crown measured with optical profilometry

3D surface reconstruction of molar crown from optical profilometer scan

3D VIEW: High-fidelity 3D rendering of the molar crown surface obtained with optical profilometry

結論

In this application, the NANOVEA JR25 Non-Contact Optical Profiler was used to measure the surface roughness and 3D surface topography of an adult human molar.

Both the area scan and the line profile analysis revealed a roughness Rq of approximately 2.5 µm and an Ra of about 1.9–2.0 µm. These values are consistent with results reported in the literature.³ The use of a narrower L-Gaussian filter with an 80 µm cut-off enabled further investigation of micro-roughness, revealing an Rq of 0.643 µm and an Ra of 0.495 µm.

The full 3D surface topography of the molar crown was reconstructed with high fidelity. The high measurement resolution allows detection of fine surface features and crevices. The resulting surface data can be easily processed and exported as STL files, enabling the design and fabrication of customized dental devices and restorative components.

参考文献

[1] Shin, B.W., et al. Surface Roughness of Prefabricated Pediatric Zirconia Crowns Following Simulated Toothbrushing. Pediatric Dentistry 44.5 (2022): 363–367.
[2] Bollen, C.M.L., Paul Lambrechts, and Marc Quirynen. Comparison of surface roughness of oral hard materials to the threshold surface roughness for bacterial plaque retention: A review of the literature. Dental Materials 13.4 (1997): 258–269.
[3] Suputtamongkol, K., et al. Surface roughness resulting from wear of lithia-disilicate-based posterior crowns. Wear 269.3–4 (2010): 317–322.

Frequently Asked Questions About Dental Surface Roughness Measurement

What is dental surface roughness measurement?

Dental surface roughness measurement quantifies the microscopic texture of tooth surfaces using parameters such as Ra, Rq, and Sa. Optical profilometers measure these features without contacting the surface, allowing accurate analysis of enamel, restorative materials, and dental crowns.

Why use optical profilometry to measure tooth roughness?

Optical profilometry provides non-contact surface measurement with nanometer-scale vertical resolution. It captures 2D surface maps and full 3D surface topography of dental structures without damaging soft or polished surfaces.

What roughness parameters are used for dental surface analysis?

Common roughness parameters include Ra (arithmetic mean roughness), Rq (root mean square roughness), Sa (areal roughness), and Sz (maximum surface height). These parameters help evaluate enamel wear, plaque adhesion risk, and the performance of restorative materials.

Why is surface roughness important in dentistry?

Surface roughness affects plaque retention, wear resistance, and the long-term performance of dental restorations. Controlling micro-roughness can reduce bacterial adhesion and improve the durability of dental materials.
Need Reliable Surface Roughness Measurement for Dental Materials?

スクリーンプロテクターの耐傷性テストの重要性を示すスマートフォンの画面割れ。

携帯電話スクリーン・プロテクターの耐傷性試験

携帯電話スクリーン・プロテクターの耐傷性試験

作成者

ステイシー・ペレイラ、ジョセリン・エスパルサ、ピエール・ルルー

携帯電話スクリーンプロテクターの耐傷性を理解する

携帯電話のスクリーンの保護コーティングは、耐傷性、接着強度、長期耐久性において重要な役割を果たしています。時間が経つにつれて、傷、マイクロクラック、コーティングの剥離は、特に使用頻度の高い環境において、光学的な透明度と信頼性を低下させます。さまざまなスクリーンプロテクターが機械的な損傷にどのように耐えるかを評価するために、装置によるスクラッチ試験を行うことで、接着、凝集、破壊の挙動など、コーティングの破壊メカニズムに関する定量的な知見が得られます。.
この研究では、, NANOVEA PB1000 メカニカルテスター は、TPUと強化ガラス製スクリーンプロテクターを、制御された進行性負荷の下で比較するために使用されます。精密なアコースティックエミッション検出を使用して、重要な破損荷重を特定し、各材料が機械的応力の増加に対してどのように反応するかを特徴付けました。.
スクリーンプロテクターに耐傷性テストが重要な理由

多くのユーザーは、厚いプロテクターや硬いプロテクターは自動的に性能が向上すると考えていますが、実際の耐久性は、材料が進行性の荷重、表面の変形、局所的な応力のもとでどのような挙動を示すかによって決まります。計装化されたスクラッチ試験により、エンジニアはコーティングの密着性、凝集強度、表面の耐摩耗性、破損が発生または伝播する正確な荷重を測定することができます。.

クラック発生ポイント、剥離挙動、故障モードを分析することで、メーカーは研究開発、品質管理、または比較ベンチマークのためにスクリーンプロテクターの性能を検証することができます。ナノおよびマイクロスクラッチ試験は、従来の硬度評価をはるかに超える、実世界の耐久性に関する反復可能でデータ駆動型の洞察を提供します。.

スクラッチテストの目的
スクリーンプロテクターにおける故障荷重の測定

この研究の目的は、NANOVEA PB1000メカニカルテスターが、ポリマー製とガラス製の両方のスクリーンプロテクターに対して、再現性のある標準化された耐スクラッチ性試験をどのように行うかを実証することである。印加荷重を徐々に増加させることにより、凝集破壊および接着破壊の臨界荷重を検出し、アコースティックエミッション信号を捕らえ、これらの事象をスクラッチ深さ、摩擦力、表面変形と相関させる。.

この方法により、各保護コーティングの完全な機械的プロファイルが得られ、メーカーや研究開発チームは、材料配合、コーティングの接着強度、表面耐久性、製品性能向上のための最適なコーティング厚さを評価することができます。これらのスクラッチ評価は、NANOVEAが提供する以下の製品群の一部です。 機械試験ソリューション 研究開発、品質管理、生産環境におけるコーティング、フィルム、基板の特性評価に使用されます。.

ナノビア PB1000 ラージプラットフォーム
メカニカルテスター

スクラッチ試験のパラメータと装置のセットアップ

TPUおよび強化ガラス製スクリーンプロテクターの耐スクラッチ性評価は、再現性と正確な故障荷重検出を確実にするため、管理された条件下で実施された。以下のパラメータは、NANOVEA PB1000メカニカルテスターで使用した進行荷重スクラッチ試験のセットアップを定義するものです。.

ロードタイプ プログレッシブ
初期荷重 0.1 N
最終荷重 12 N
滑りスピード 3.025mm/分
滑り距離 3mm
圧子ジオメトリー ロックウェル(120°コーン)
圧子材料(先端) ダイヤモンド
圧子先端半径 50 µm
大気 航空
温度 24℃(室温)

表1: スクラッチ試験に使用される試験パラメータ

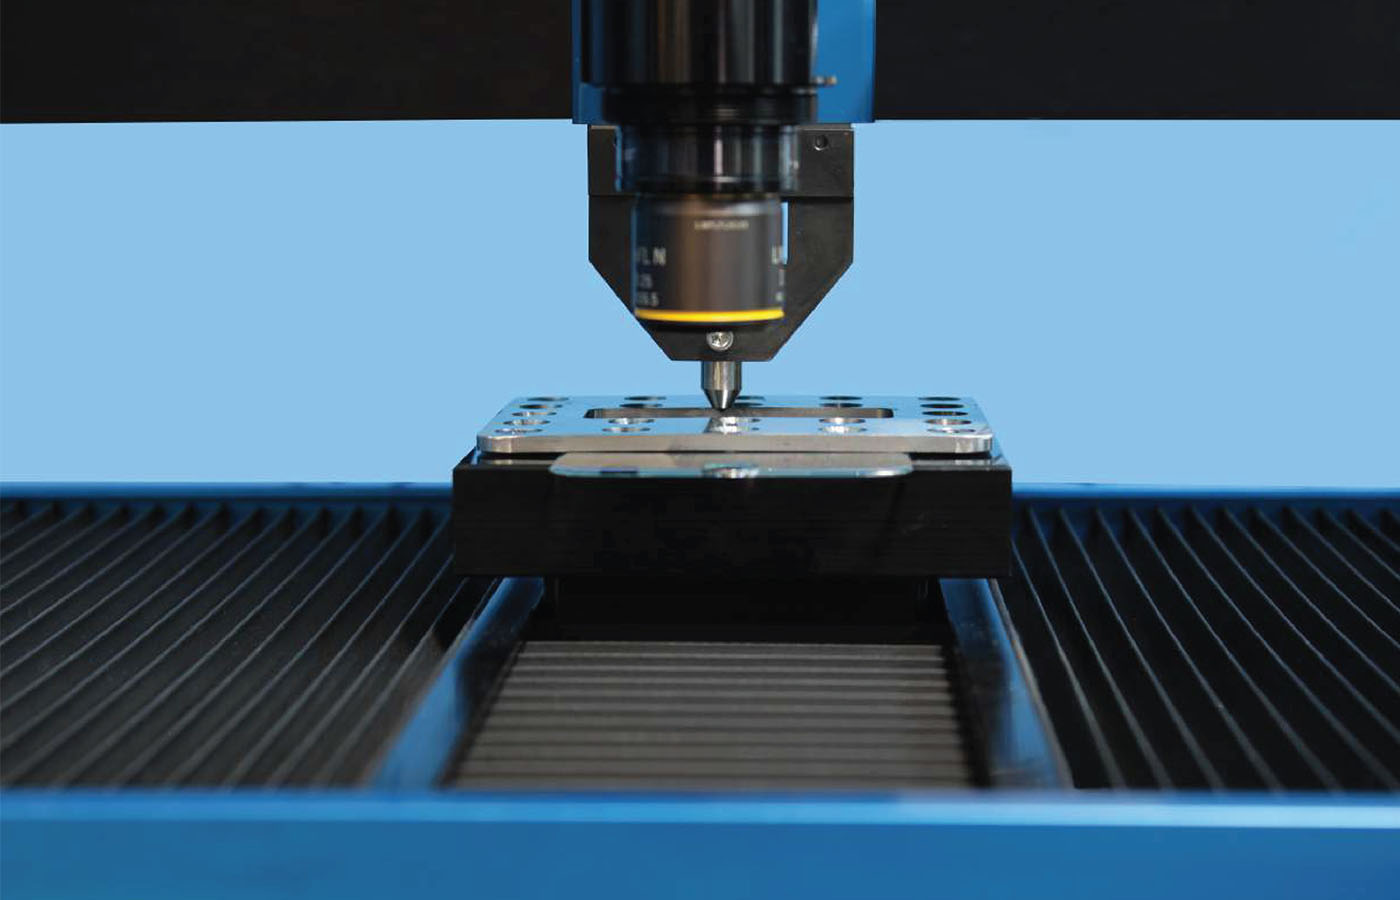
NANOVEA PB1000メカニカルテスターでスクラッチテストを受けるスクリーンプロテクター・サンプル

NANOVEA PB1000メカニカルテスターに取り付けたスクリーンプロテクターのサンプル。.

耐スクラッチ性試験に使用したスクリーンプロテクター・サンプル

スクラッチ耐性、故障挙動、機械的耐久性の違いを比較するため、市販されている2種類のスクリーンプロテクター素材が選択された。両サンプルはNANOVEA PB1000メカニカルテスターにしっかりと取り付けられ、一貫した偏りのない比較を確実にするため、同一の順荷重条件下で評価されました。.

TPUスクリーンプロテクターは、高い弾性を持つが耐摩耗性が低い柔軟なポリマーフィルムであり、強化ガラスプロテクターは、高い硬度と強化された衝撃保護用に設計された硬くて脆い材料である。両方の素材を同じ荷重プロファイルでテストすることで、素材の組成、弾性、硬度がスクラッチの故障モードにどのように影響するかを明確に評価することができます。.

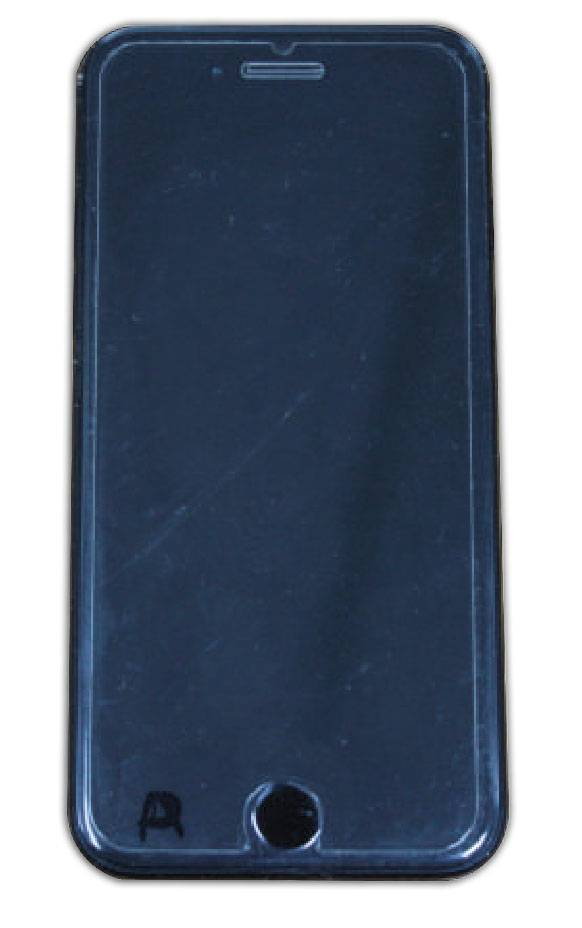
TPUスクリーンプロテクター

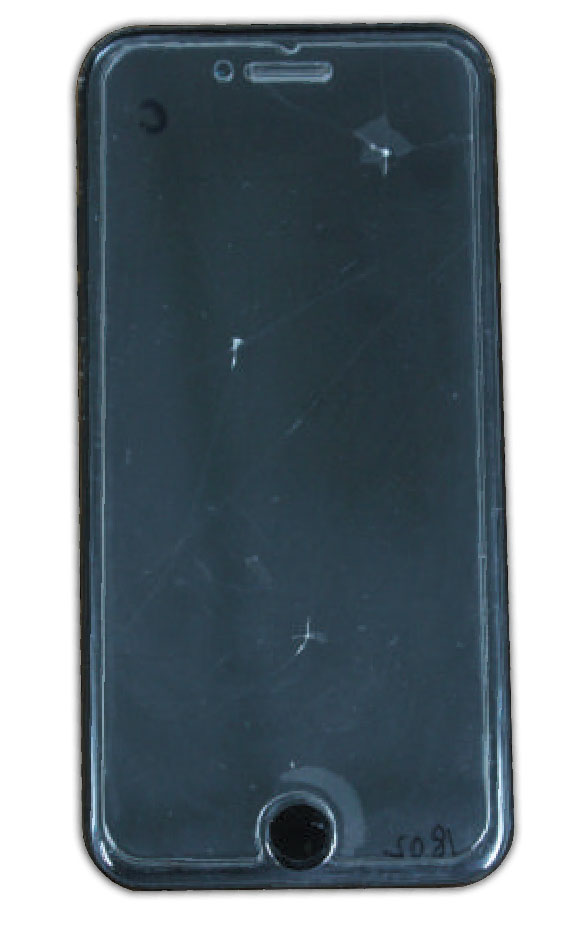
強化ガラス

図1: TPUと強化ガラス製のスクリーンプロテクターは、耐傷性テスト用に準備されている。.

スクラッチテスト結果:TPUスクリーンプロテクターと強化ガラススクリーンプロテクターの故障モード

スクリーンプロテクター臨界負荷 #1 (n)臨界負荷 #2 (n)
TPU該当なし2.004 ± 0.063
テンパード・グラス3.608 ± 0.2817.44 ± 0.995

表2: 各スクリーンプロテクターサンプルの限界荷重のまとめ。.

TPUと強化ガラス製スクリーン・プロテクターは基本的に異なる機械的特性を持つため、各サンプルは進行性荷重スクラッチ試験で明確な破損モードと臨界荷重のしきい値を示しました。表2は、各材料について測定された臨界荷重をまとめたものです。.

臨界荷重#1は、亀裂の発生や半径方向の破壊など、光学顕微鏡で観察可能な凝集破壊の最初の点を示す。.

臨界荷重#2は、アコースティック・エミッション(AE)モニタリングによって検出された最初の大きな事象に相当し、通常、より大きな構造物の破損や貫通事象を表す。.

TPUスクリーンプロテクター - 柔軟な高分子挙動

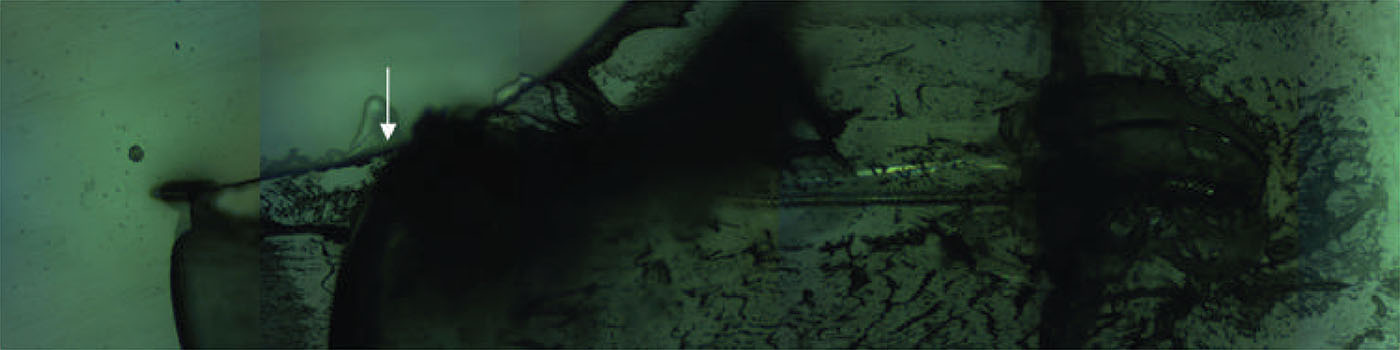
TPUスクリーンプロテクターは、重大なクリティカルイベント(Critical Load #2)を1回だけ発生させた。この荷重は、スクラッチトラックに沿って、フィルムが携帯電話のスクリーン表面から浮き上がったり、剥がれたり、剥離し始めたポイントに相当します。.

臨界荷重#2(≒2.00N)を超えると、圧子は十分に貫通し、試験の残りの時間、携帯電話の画面に直接目に見える傷がつきました。臨界荷重#1は検出されませんでしたが、これは材料の高い弾性と低い凝集強度と一致しています。.

強化ガラススクリーンプロテクター - 脆弱な故障挙動

強化ガラス製スクリーンプロテクターは、脆性材料の特徴である2つの異なる臨界荷重を示した:

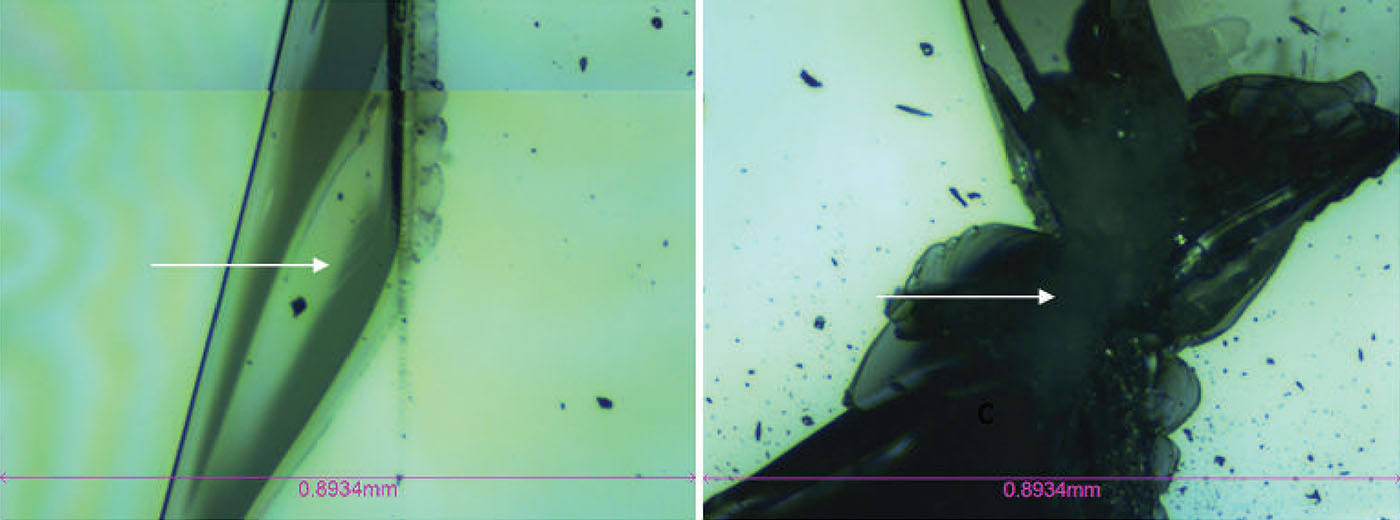
  • 臨界荷重#1(≒3.61N):放射状の破断とクラックの発生が顕微鏡で観察され、ガラス層が早期に凝集破壊したことを示している。.

  • 臨界荷重#2(≒7.44N):大きなAEスパイクとスクラッチ深さの急激な増加は、より高い荷重でのプロテクターの貫通を示した。.

AEの大きさはTPUよりも大きかったが、携帯電話のスクリーンにはダメージが伝わらず、強化ガラス製プロテクターが壊滅的な破壊を起こす前に荷重を吸収・分散する能力を実証した。.

いずれの材料においても、臨界荷重#2は、圧子がスクリーンプロテクターを突き破る瞬間に相当し、各試料の保護限界を確認することができました。.

TPUスクリーンプロテクター:スクラッチテストデータと故障解析

スクラッチ臨界負荷 #2 (n)
12.033
22.047
31.931
アベレージ2.003
標準偏差0.052

表3: TPUスクリーンプロテクターのスクラッチ試験で測定された限界荷重。.

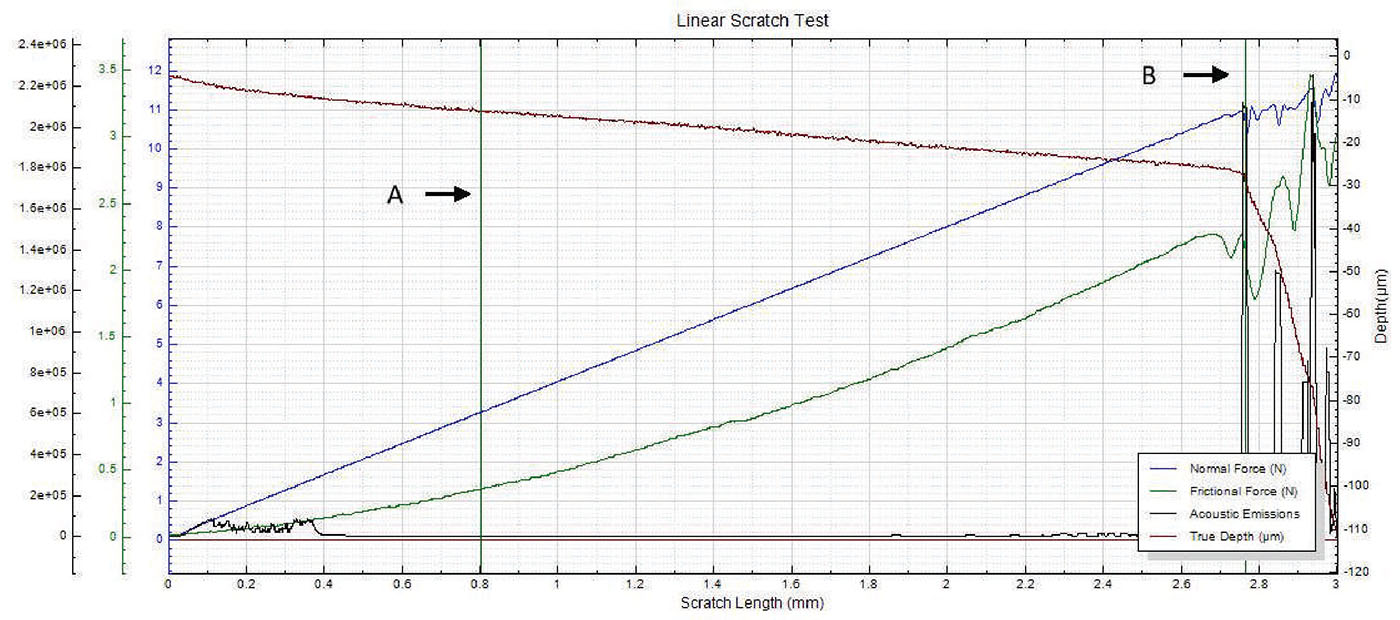
NANOVEAメカニカルテスターでテストしたTPUスクリーンプロテクターの摩擦、法線力、アコースティックエミッション、傷の長さに対する深さを示すグラフ。.

図2: TPUスクリーンプロテクターの摩擦力、法線荷重、アコースティックエミッション(AE)、傷の深さと傷の長さの関係。. (B) クリティカルロード #2

図3: Critical Load #2におけるTPUスクリーンプロテクターの光学顕微鏡画像(倍率5倍、画像幅0.8934mm)。.

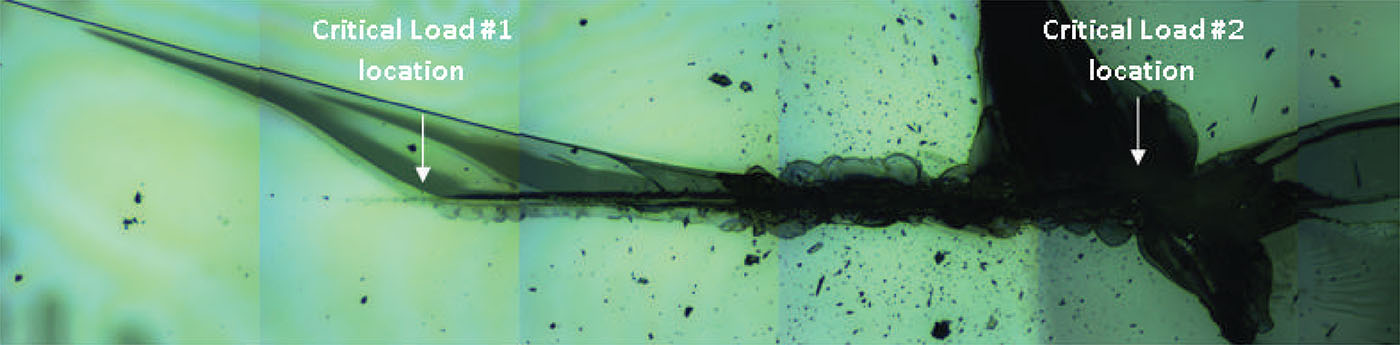
図4: TPUスクリーンプロテクターのスクラッチ後の全長画像で、進行性負荷試験後の完全なスクラッチ跡を示す。.

強化ガラス製スクリーンプロテクター:臨界荷重データと破壊挙動

スクラッチ 臨界負荷 #1 (n) 臨界負荷 #2 (n)
1 3.923 7.366
2 3.382 6.483
3 3.519 8.468
アベレージ 3.653 6.925
標準偏差 0.383 0.624

表4: 強化ガラス製スクリーンプロテクターのスクラッチ試験で測定された臨界荷重。.

ℹ️ 非シリケートポリマーコーティングとの比較については、以下の研究を参照のこと。 PTFEコーティング摩耗試験, これは、同様の進行荷重条件下における低摩擦ポリマーフィルムの破壊挙動を強調している。.

図5: 強化ガラス製スクリーンプロテクターの摩擦力、法線荷重、アコースティックエミッション(AE)、スクラッチ深さとスクラッチ長さの関係。. (A) 臨界負荷 #1 (B) 臨界負荷 #2

NANOVEAメカニカルテスターを使用し、5倍の倍率でスクラッチテストを行った強化ガラススクリーンプロテクターのクリティカルロード#1とクリティカルロード#2の破損箇所を示す光学顕微鏡画像。.

図6: 臨界荷重#1(左)と臨界荷重#2(右)の破損箇所を5倍の倍率で示した光学顕微鏡写真(画像幅:0.8934mm)。.

図7: 試験後の強化ガラス製スクラッチトラックの光学顕微鏡像。進行荷重試験後の破断開始部(CL#1)と最終貫通部(CL#2)を強調している。.

結論TPUスクリーンプロテクターと強化ガラススクリーンプロテクターのスクラッチ性能比較

この研究では、NANOVEA PB1000メカニカルテスターが、プログレッシブ荷重とアコースティックエミッション(AE)検出を使用して、制御された再現性の高い高感度な耐傷性測定を実現することを実証しています。このシステムは、凝集破壊と接着破壊の両方の事象を正確に捉えることで、機械的ストレスが増加した場合のTPUと強化ガラス製スクリーンプロテクターの挙動を明確に比較することができます。.

実験結果は、強化ガラスがTPUよりも著しく高い臨界荷重を示し、優れた耐スクラッチ性、破壊開始の遅延、圧子の貫入に対する確実な保護を提供することを確認した。TPUの低い凝集強度と早期剥離は、高応力環境におけるTPUの限界を浮き彫りにしている。.

故障荷重を特定した後、得られたスクラッチトラックは、以下の方法で分析することができる。 非接触3D光学式形状測定機 溝深さ、残留変形、スクラッチ後のトポグラフィーを測定する。これにより、各材料の機械的プロファイルが完成します。.

NANOVEAメカニカルテスターは、正確で再現性の高い圧痕、スクラッチ、摩耗試験用に設計されており、ISOおよびASTM準拠のナノおよびマイクロモジュールに対応しています。その多用途性により、研究開発、生産、品質管理にわたって、薄膜、コーティング、ポリマー、ガラス、基板のあらゆる機械的特性を評価するための理想的なソリューションとなっています。.

よくある質問
耐傷性試験について

耐スクラッチ性試験とは?

耐スクラッチ性試験は、ダイヤモンドスタイラスで徐々に荷重を増加させたときに、材料やコーティングがどのように反応するかを評価します。この試験では、凝集破壊や接着破壊が発生する臨界荷重を特定し、耐久性、接着強度、表面損傷に対する抵抗力を定量的に測定します。.

凝集破壊と接着破壊の違いは?

凝集破壊の発生 ひび割れ、裂け目、内部破壊など、コーティングや材料に生じる。.
接着不良は、コーティングが基材から剥離することで起こり、接着強度が不十分であることを示す。.

NANOVEA PB1000は、アコースティック・エミッションの同期モニタリング、スクラッチ深さトラッキング、摩擦分析を用いて、その両方を検出する。.

なぜ手作業ではなく機械式試験機を使うのですか?

NANOVEA PB1000のようなメカニカル・テスターは、正確で再現性のある標準化された測定を提供し、研究開発、生産検証、品質管理のための信頼性の高いデータを保証します。また、アコースティックエミッションの検出やリアルタイムの深さモニタリングなど、手作業では実現できない高度な機能も備えています。.

高温下での磨耗測定

その場磨耗測定 高温時

トライボメータを用いた

現場での磨耗測定 航空宇宙用トライボメータ

作成者

Duanjie Li, PhD

はじめに

LVDT(Linear Variable Differential Transformer)は、直線変位の測定に使用される堅牢な電気変圧器の一種である。電力タービン、油圧、オートメーション、航空機、人工衛星、原子炉など、さまざまな産業用途で広く使われている。

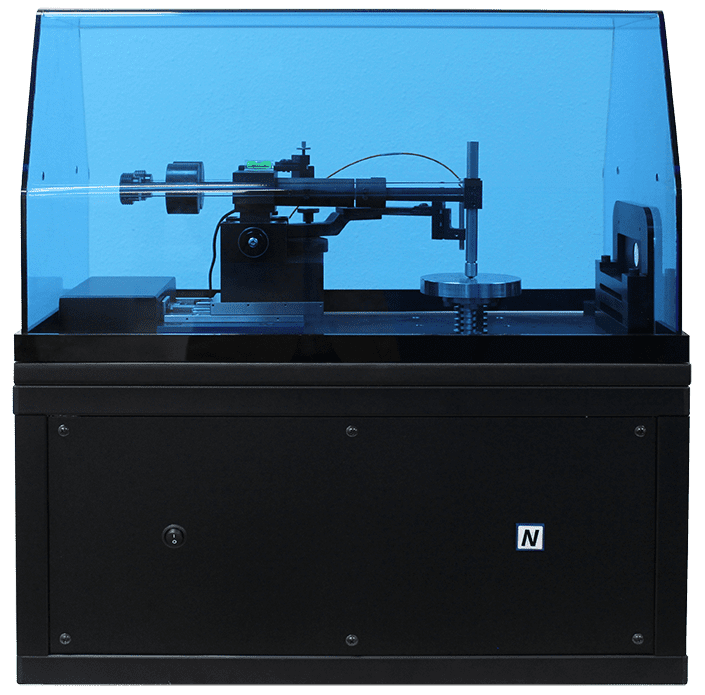
この研究では、LVDT と NANOVEA の高温モジュールのアドオンを取り上げます。 トライボメータ これにより、高温での摩耗プロセス中に、試験サンプルの摩耗トラック深さの変化を測定できるようになります。これにより、ユーザーは摩耗プロセスのさまざまな段階を COF の進化と関連付けることができます。これは、高温用途における材料の摩耗メカニズムとトライボロジー特性の基本的な理解を向上させる上で重要です。

測定目的

本研究では、高温下における材料の摩耗過程の変化をその場で観察できるNANOVEA T50トライボメーターの能力を紹介したいと思います。

アルミナシリケートセラミックスの異なる温度での摩耗過程を、制御・監視しながらシミュレートしています。

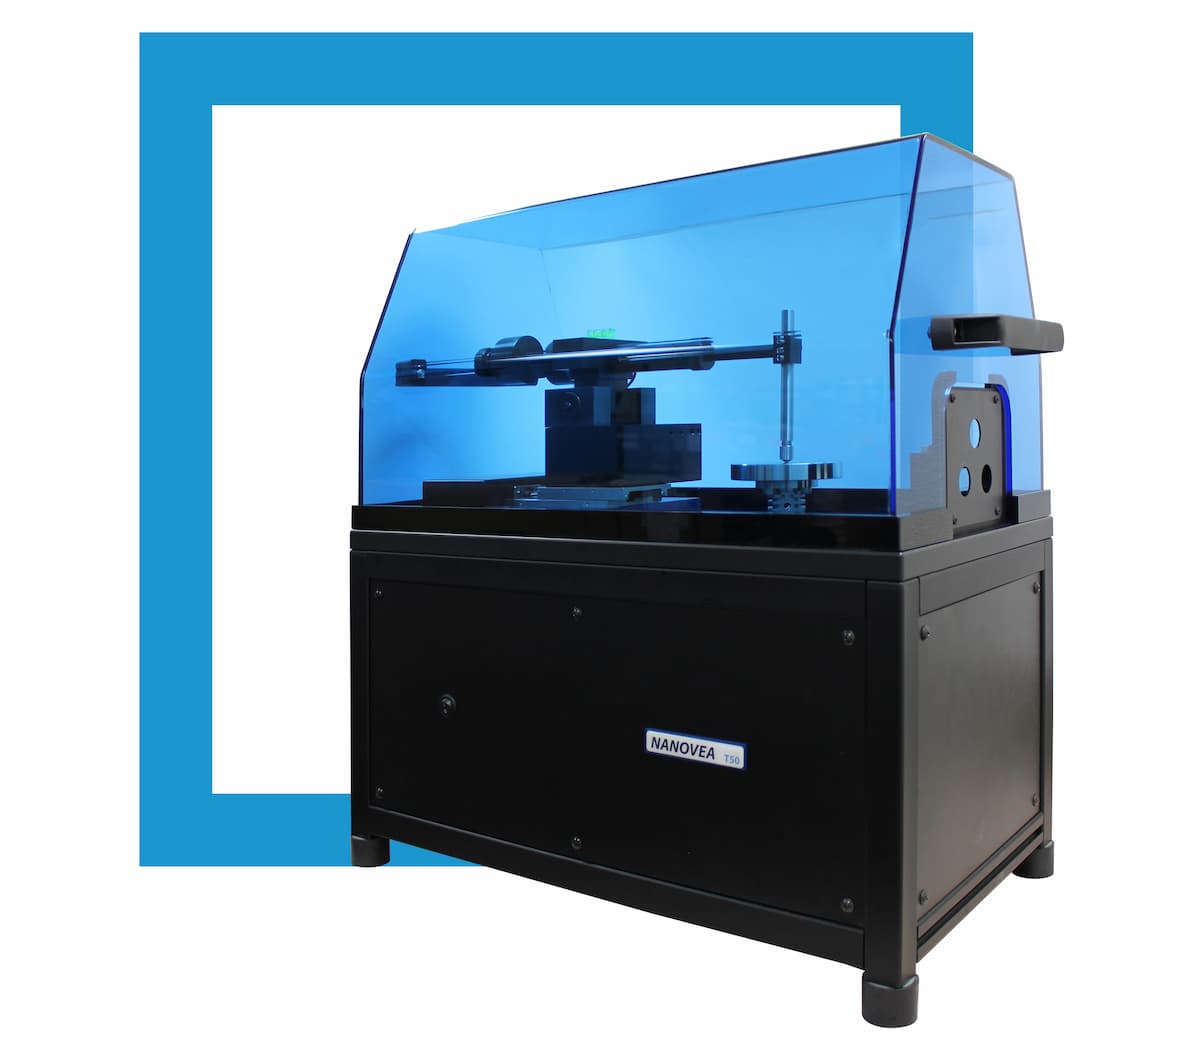
ナノビア

T50

試験方法

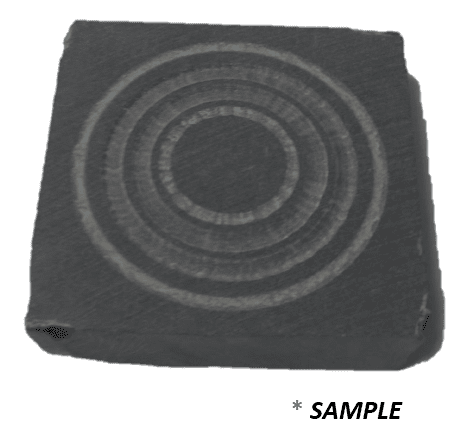
NANOVEAトライボメータを用いて、アルミナシリケートセラミック板の摩擦係数(COF)および耐摩耗性などのトライボロジー挙動を評価した。アルミナシリケートセラミック板を室温(RT)から高温(400℃および800℃)まで炉で加熱し、その温度で摩耗試験を行った。 

比較のため,800℃から400℃まで冷却し,さらに室温まで冷却した状態で摩耗試験を実施した。AI2O3ボールチップ(直径6mm,グレード100)を試験片にあてがった。COF,摩耗深さ,温度はその場でモニターした。

テストパラメーター

ピンオンディスク測定の

トライボメータ LVDT サンプル

摩耗率Kは,Vを摩耗体積,Fを法線荷重,sを摺動距離,Aを摩耗痕の断面積,nを回転数とし,K=V/(Fxs)=A/(Fxn)の式で評価された.表面粗さと摩耗痕のプロファイルはNANOVEA光学式プロファイラで評価し,摩耗痕の形態は光学顕微鏡で観察した。

結果・考察

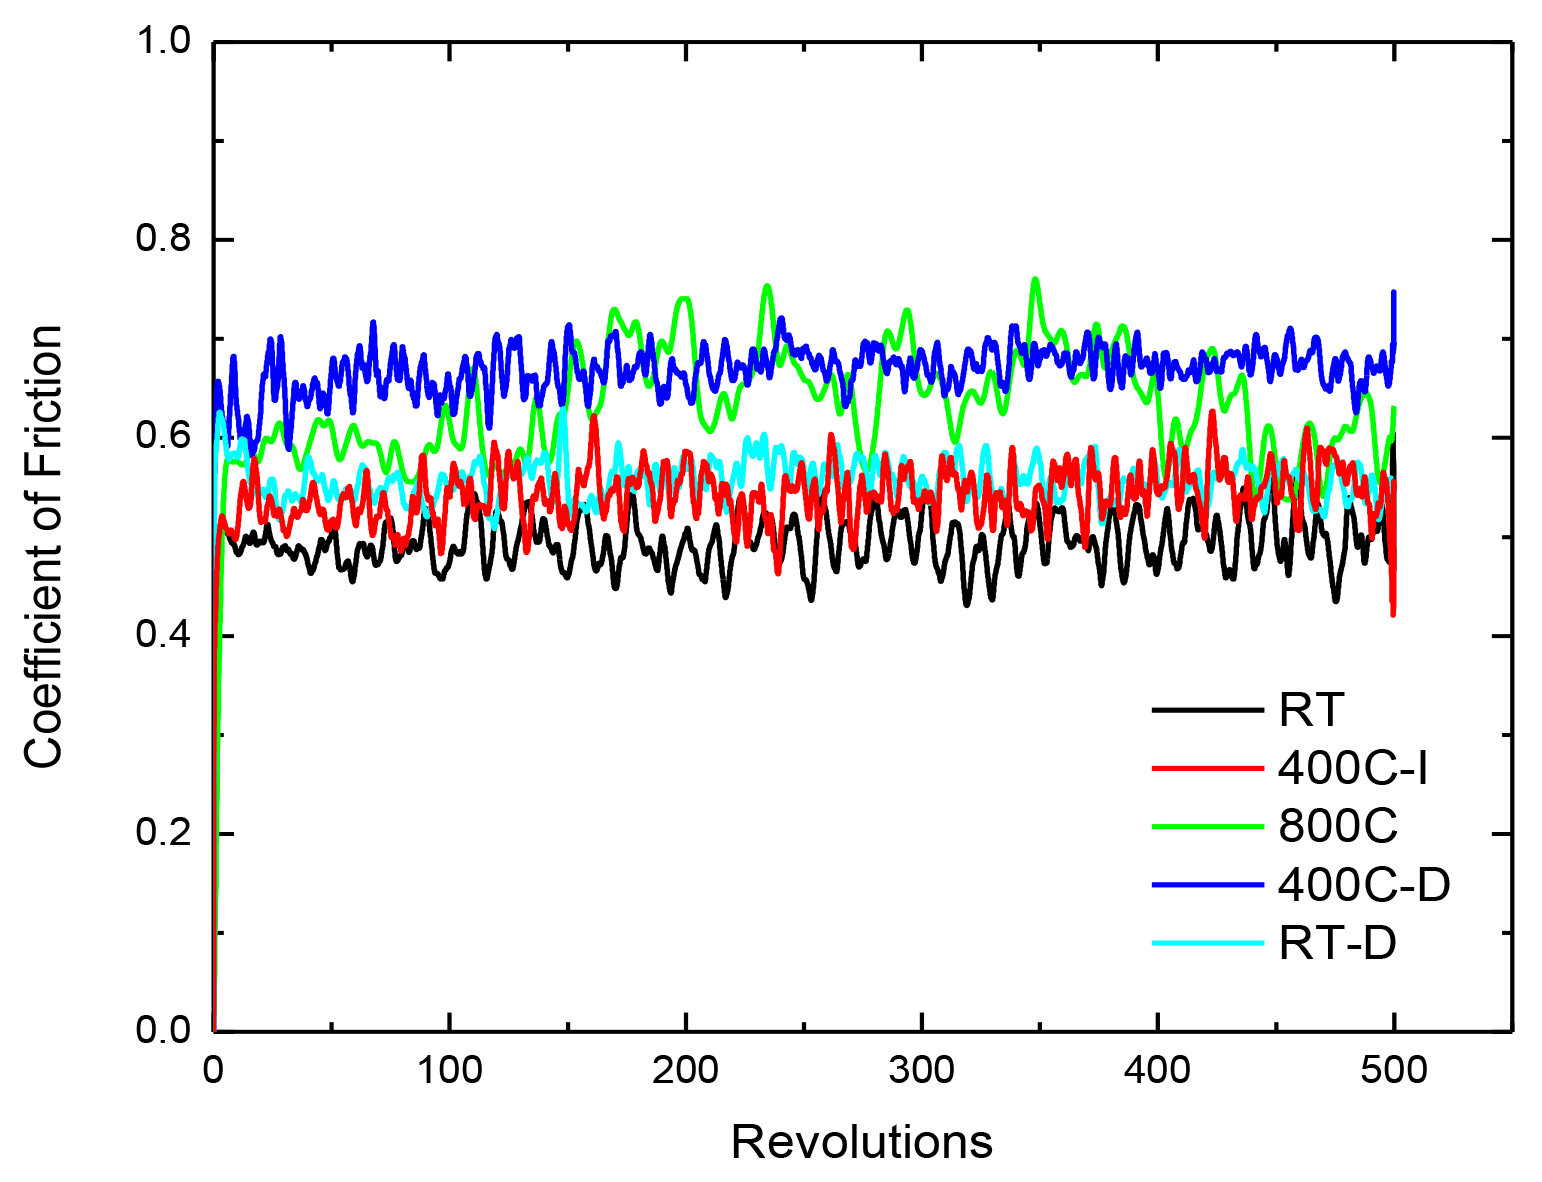
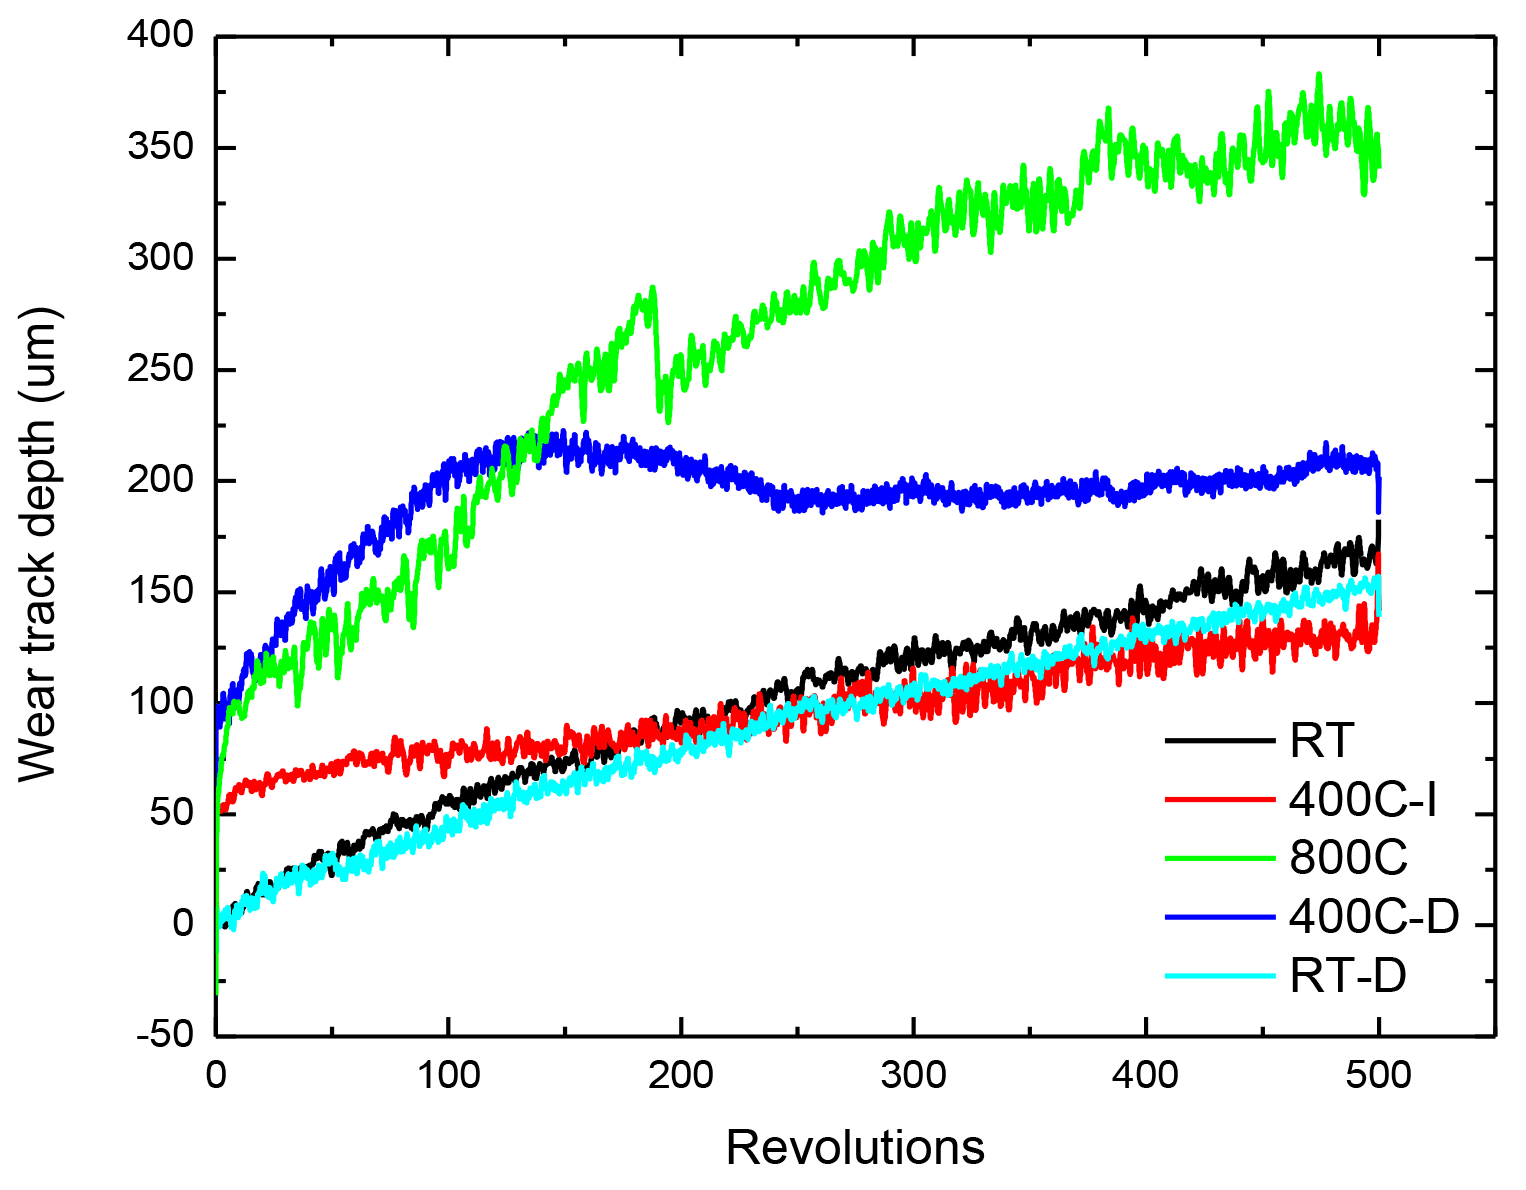
その場で記録された COF と摩耗痕深さをそれぞれ図 1 と図 2 に示す。図1において、"-I "は、温度が常温から高温まで上昇したときに行われた試験を表す。"-D "は、800℃の高温から温度を下げた場合を示す。

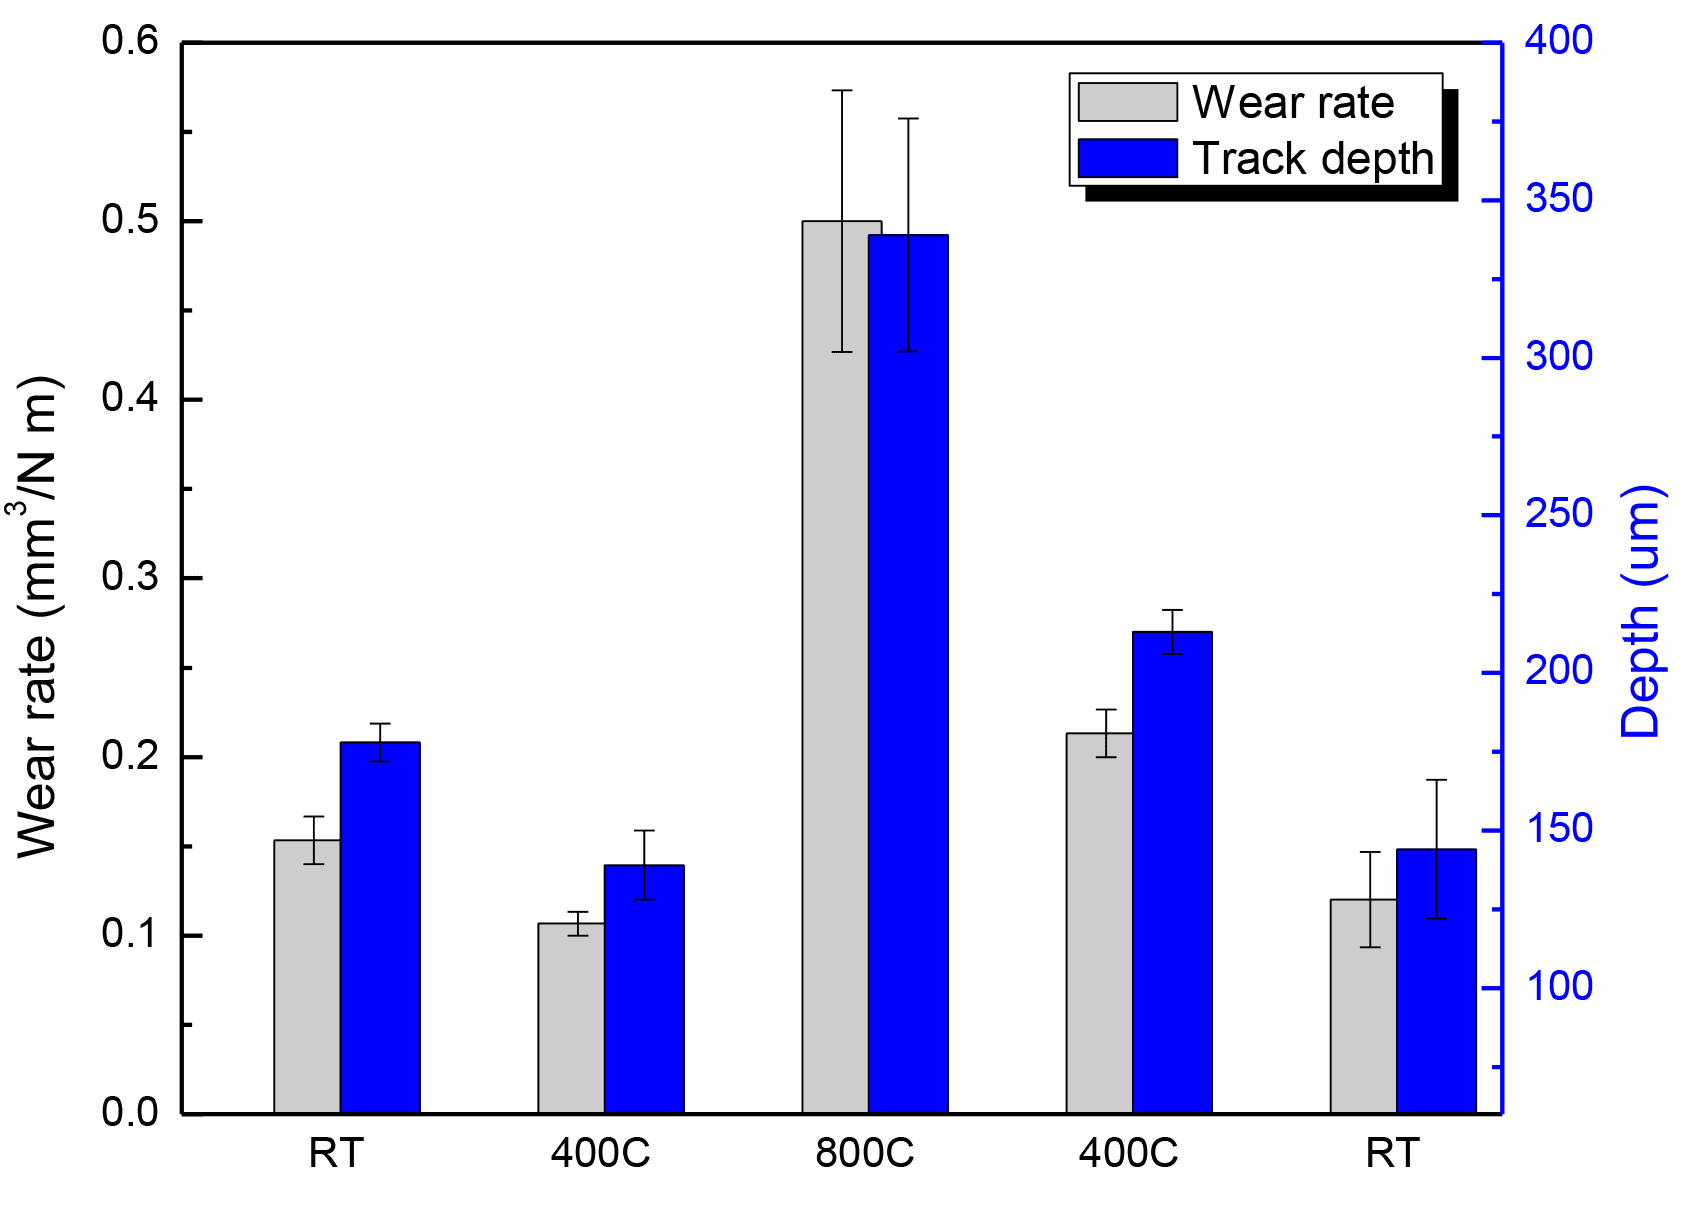
図 1 に示すように、異なる温度で試験したサンプルは、測定中、同等の COF ~ 0.6 を示しました。このような高いCOFは、相当量の破片を発生させる摩耗プロセスの加速につながります。摩耗痕の深さは、図2に示すように、摩耗試験中にLVDTによってモニターされました。室温での試料加熱前と試料冷却後の試験から、アルミナシリケートセラミックプレートは常温で進行性の摩耗プロセスを示し、摩耗痕深さは摩耗試験を通じて徐々に増加し、それぞれ~170μmと~150μmになりました。 

これに対して,高温(400°C と 800°C)での摩耗試験 では,摩耗痕深さが摩耗プロセスの初期に急速に増加し, 試験を継続するにつれて遅くなるという,異なる摩耗挙動を示 した.400℃-I,800℃,400℃-Dで行った試験の摩耗痕深さは,それぞれ〜140μm,〜350μm,〜210μmであった。

異なる温度でのピンオンデスクテスト時のCOF

図1. 各温度におけるピンオンディスク試験時の摩擦係数

アルミナシリケートセラミック板の各温度における摩耗痕深さ

図2. アルミナシリケートセラミック板の各温度における摩耗痕深さの変化

を用いて、アルミナシリケートセラミック板の各温度における平均摩耗量と摩耗痕深さを測定した。 ナノビア にまとめたオプティカルプロファイラー。 図3.摩耗痕の深さは、LVDTを用いて記録したものと一致している。アルミナシリケートセラミックプレートは、400℃以下の温度では0.2mm3/N以下の摩耗率であるのに対し、800℃では〜0.5mm3/Nと大幅に増加した。アルミナシリケートセラミックプレートは、短時間の加熱処理では機械的/トライボロジー的特性が著しく向上せず、熱処理前と後で同等の摩耗率を有していることがわかった。

アルミナシリケートセラミックは、溶岩や不思議石とも呼ばれ、加熱処理前は軟らかく、機械加工が可能です。1093℃までの高温で長時間焼成することで、硬度と強度が大幅に向上し、その後、ダイヤモンド加工が必要となります。このようなユニークな特性を持つアルミナシリケートセラミックは、彫刻に最適な素材といえます。

本研究では、焼成に必要な温度よりも低い温度で短時間の熱処理(800℃ vs 1093℃)を行っても、アルミナシリケートセラミックスの機械的およびトライボロジー特性が向上しないことを示し、この材料にとって、実際の用途に使用する前の適切な焼成が不可欠なプロセスであることを示した。

 
各温度における試料の摩耗量と摩耗痕深さ 1

図3. 各温度における試料の摩耗量と摩耗痕深さ

まとめ

本研究の総合的なトライボロジー解析に基づき、アルミナシリケートセラミックプレートは、室温から800℃までの異なる温度で同等の摩擦係数を示すことを示しました。しかし、800℃では0.5mm3/Nmと大幅に摩耗量が増加しており、このセラミックの適切な熱処理が重要であることを示しています。

ナノベーストライボメータは、1000℃までの高温で使用される材料のトライボロジー特性を評価することが可能です。COFと摩耗痕の深さをその場で測定する機能により、ユーザーは摩耗プロセスの異なる段階とCOFの変化を関連付けることができます。これは、高温で使用される材料の摩耗メカニズムとトライボロジー特性の基本的理解を深める上で非常に重要なことです。

ナノベーストライボメータは、ISO および ASTM に準拠した回転モードとリニアモードによる精密で再現性の高い摩耗・摩擦試験を提供し、オプションで高温摩耗、潤滑、トライボコロージョンを 1 つの統合済みシステムで利用することができます。ナノベアの比類なき製品群は、薄手または厚手、軟質または硬質のコーティング、フィルム、基材のあらゆるトライボロジー特性を測定するための理想的なソリューションです。

オプションの3D非接触プロファイラを使用すると、粗さなどの他の表面測定に加えて、摩耗痕の高解像度3Dイメージングが可能です。

その場磨耗測定

同じようなアプリケーションをお持ちですか?

3D光学プロファイラによる魚鱗表面解析

3D光学プロファイラによる魚鱗表面解析

詳細はこちら

魚鱗面解析

3D OPTICAL PROFILERを使用して

魚鱗形状測定装置

作成者

アンドレア・ノビツキー

はじめに

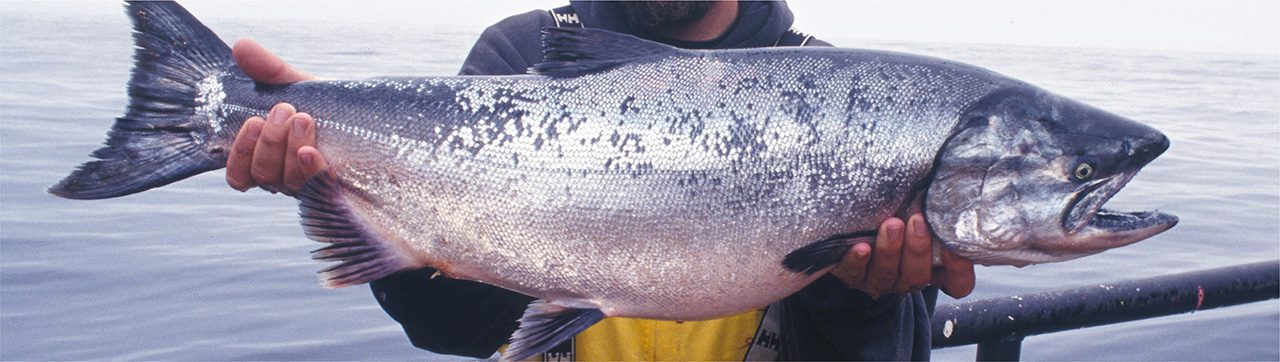
NANOVEAを用いて魚鱗の形態や模様などを研究 3D非接触オプティカルプロファイラー。この生体サンプルの繊細な性質と、その非常に小さく角度の高い溝も、プロファイラーの非接触技術の重要性を強調しています。鱗の溝は環状と呼ばれ、これを研究することで魚の年齢を推定したり、木の年輪と同様に成長速度の異なる時期を区別したりすることもできます。これは乱獲を防ぐために野生の魚の個体数を管理する上で非常に重要な情報です。

3D非接触プロフィロメトリの生物学的研究への重要性

タッチプローブや干渉計などの他の技術とは異なり、軸色法を用いた3D非接触光学式プロファイラでは、ほぼすべての表面を測定することができます。サンプルサイズは、オープンステージのため大きく変化し、サンプルの前処理は必要ありません。ナノからマクロレンジの表面形状を、試料の反射や吸収の影響を受けずに測定することができます。この装置では、ソフトウェアで結果を操作することなく、高い表面角度を測定できる高度な機能を備えています。透明、不透明、鏡面、拡散、研磨、粗面など、どのような材料でも簡単に測定することができます。この技術は、2Dおよび3D機能を組み合わせた利点とともに、表面研究を最大限に活用するための理想的で幅広い、使いやすい機能を提供します。

測定目的

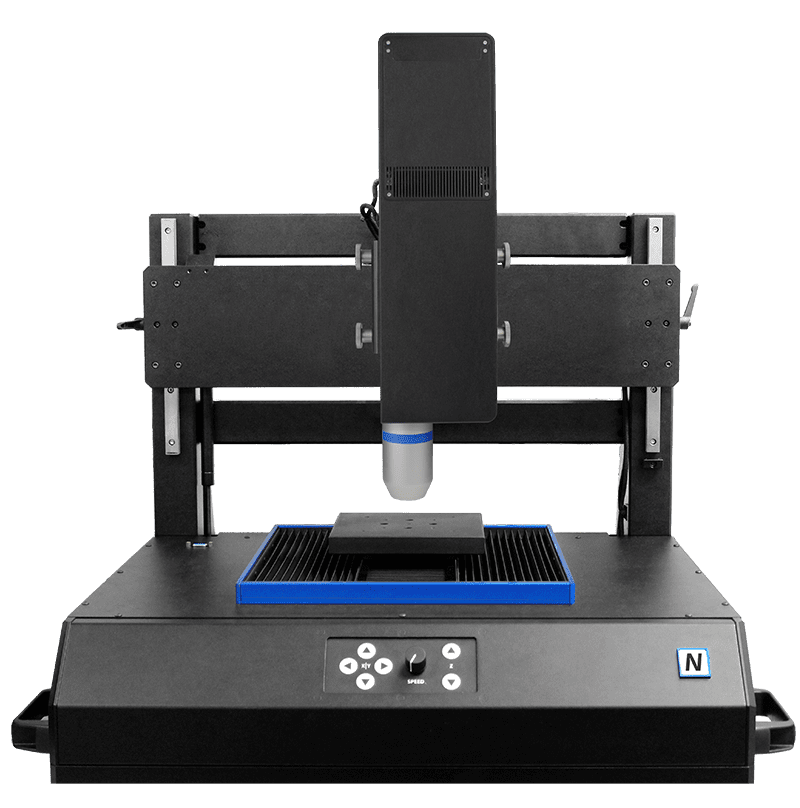
このアプリケーションでは、高速センサーを搭載し、スケールの表面を総合的に解析する3D非接触プロファイラー、NANOVEA ST400を紹介します。

この装置では、中央部の高解像度スキャンとともに、サンプル全体をスキャンしています。比較のため、スケールの外側と内側の表面粗さも測定されました。

ナノビア

ST400

外枠の3D&2D表面キャラクタリゼーション

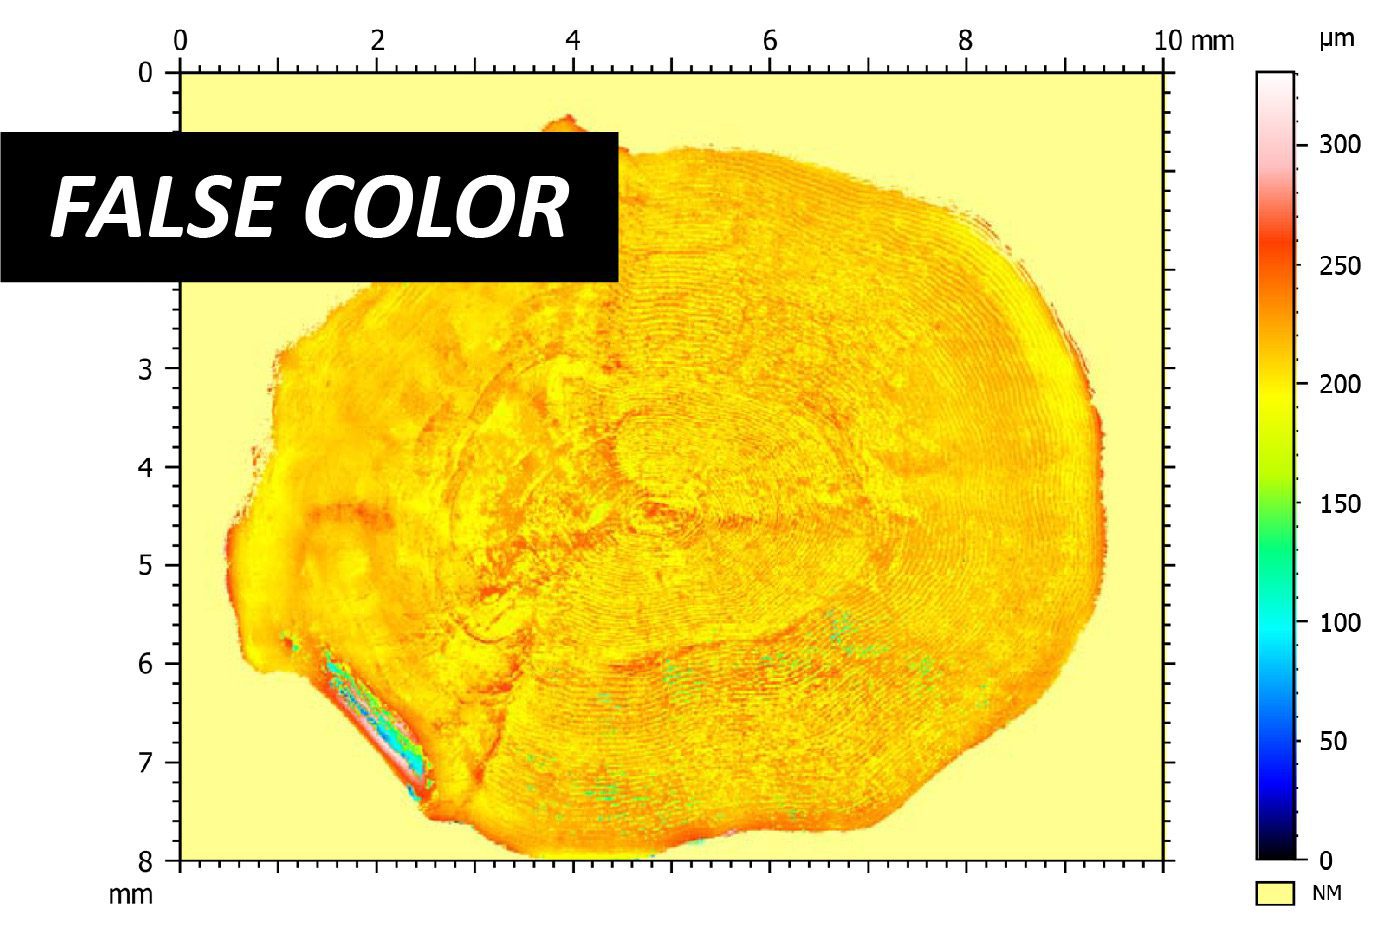
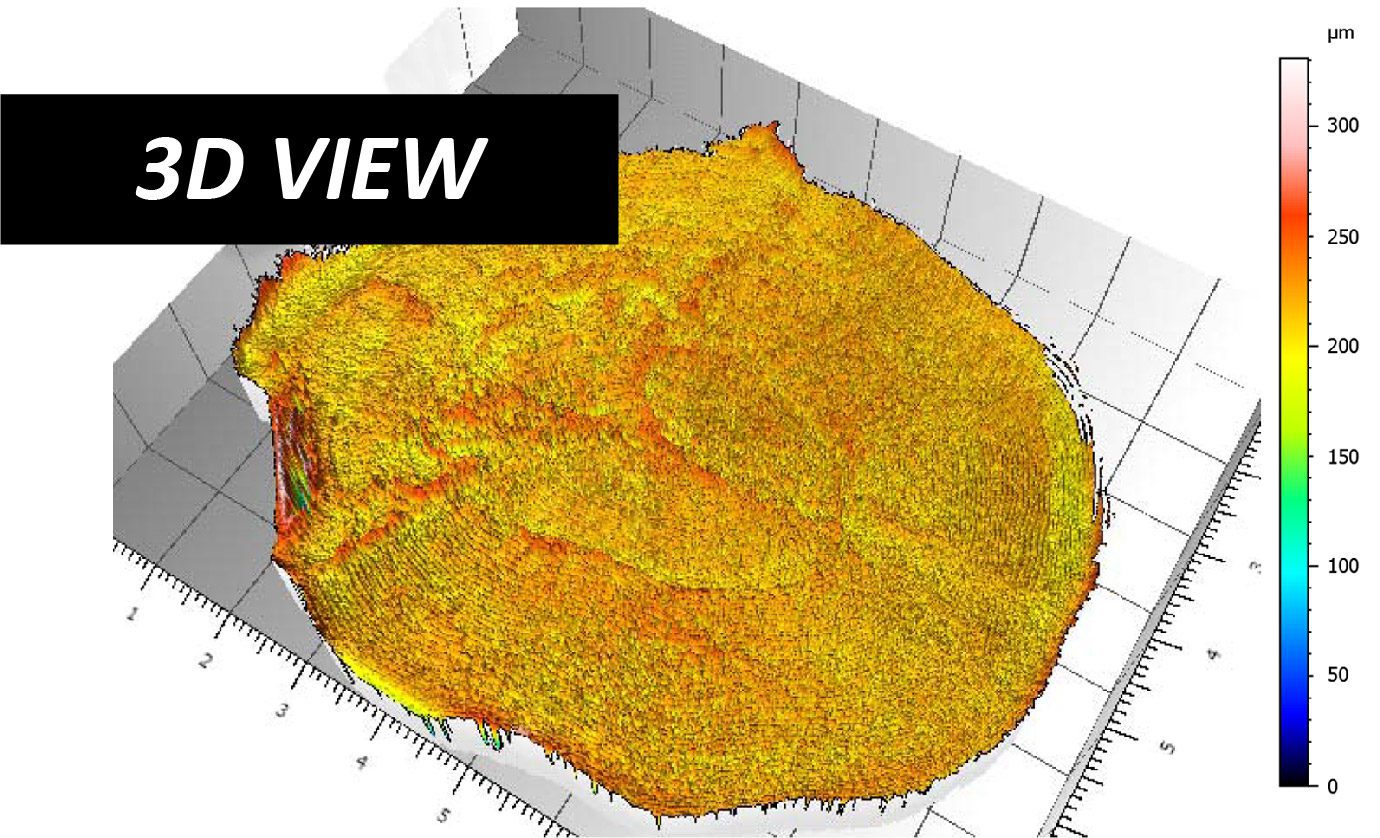
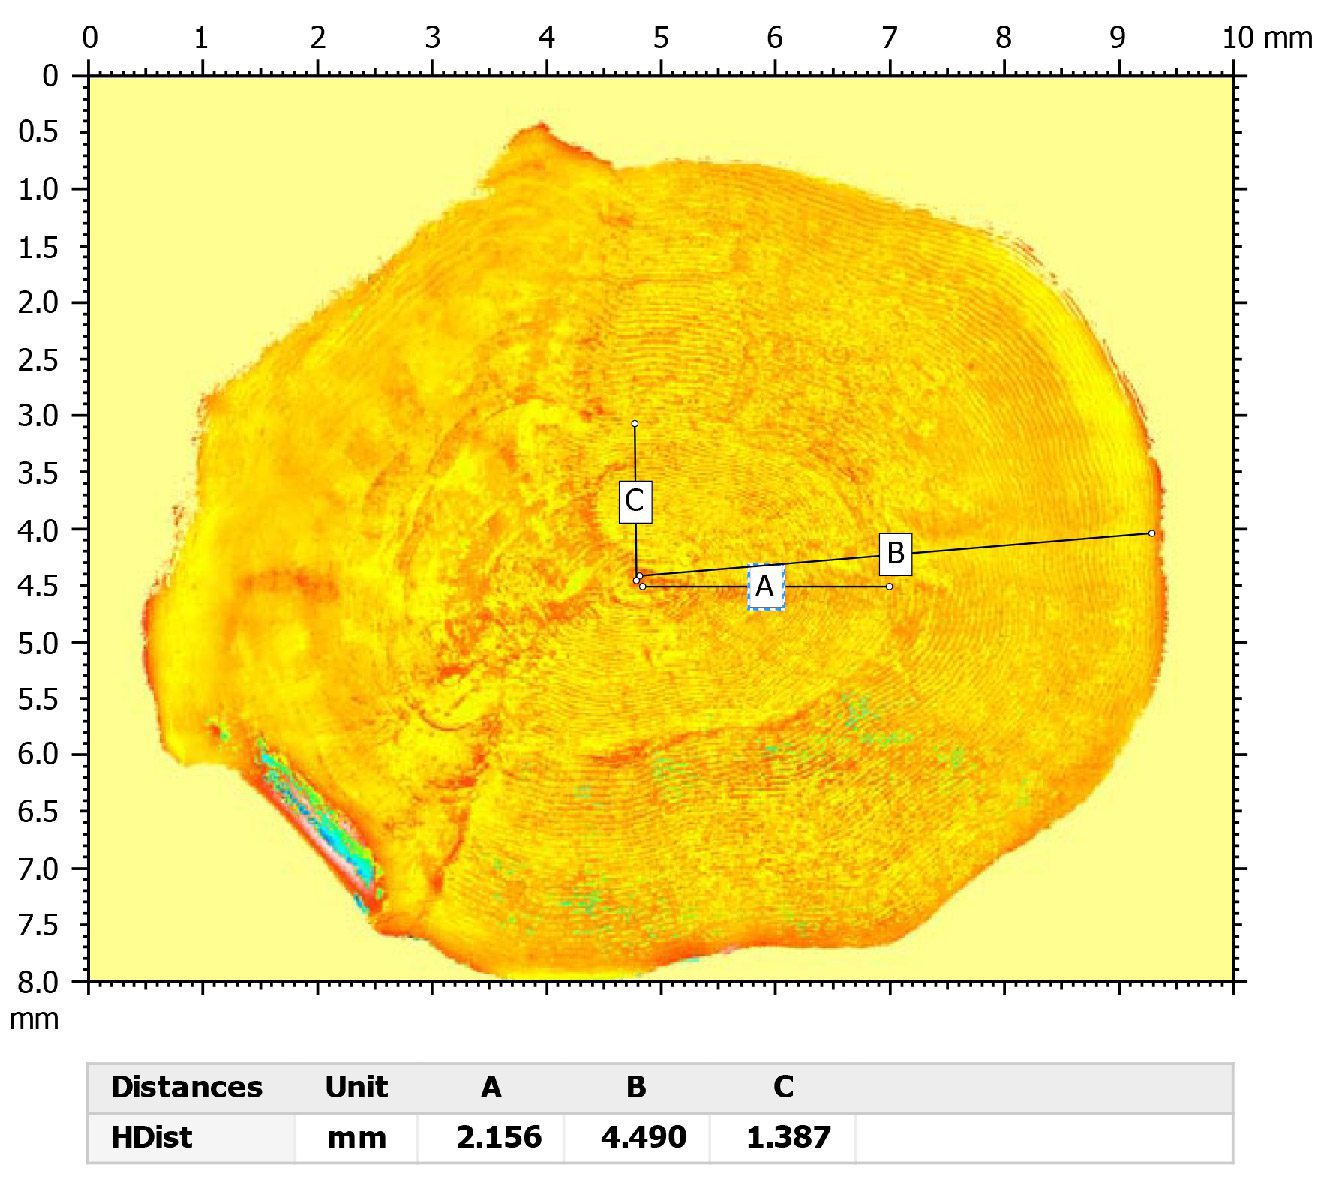
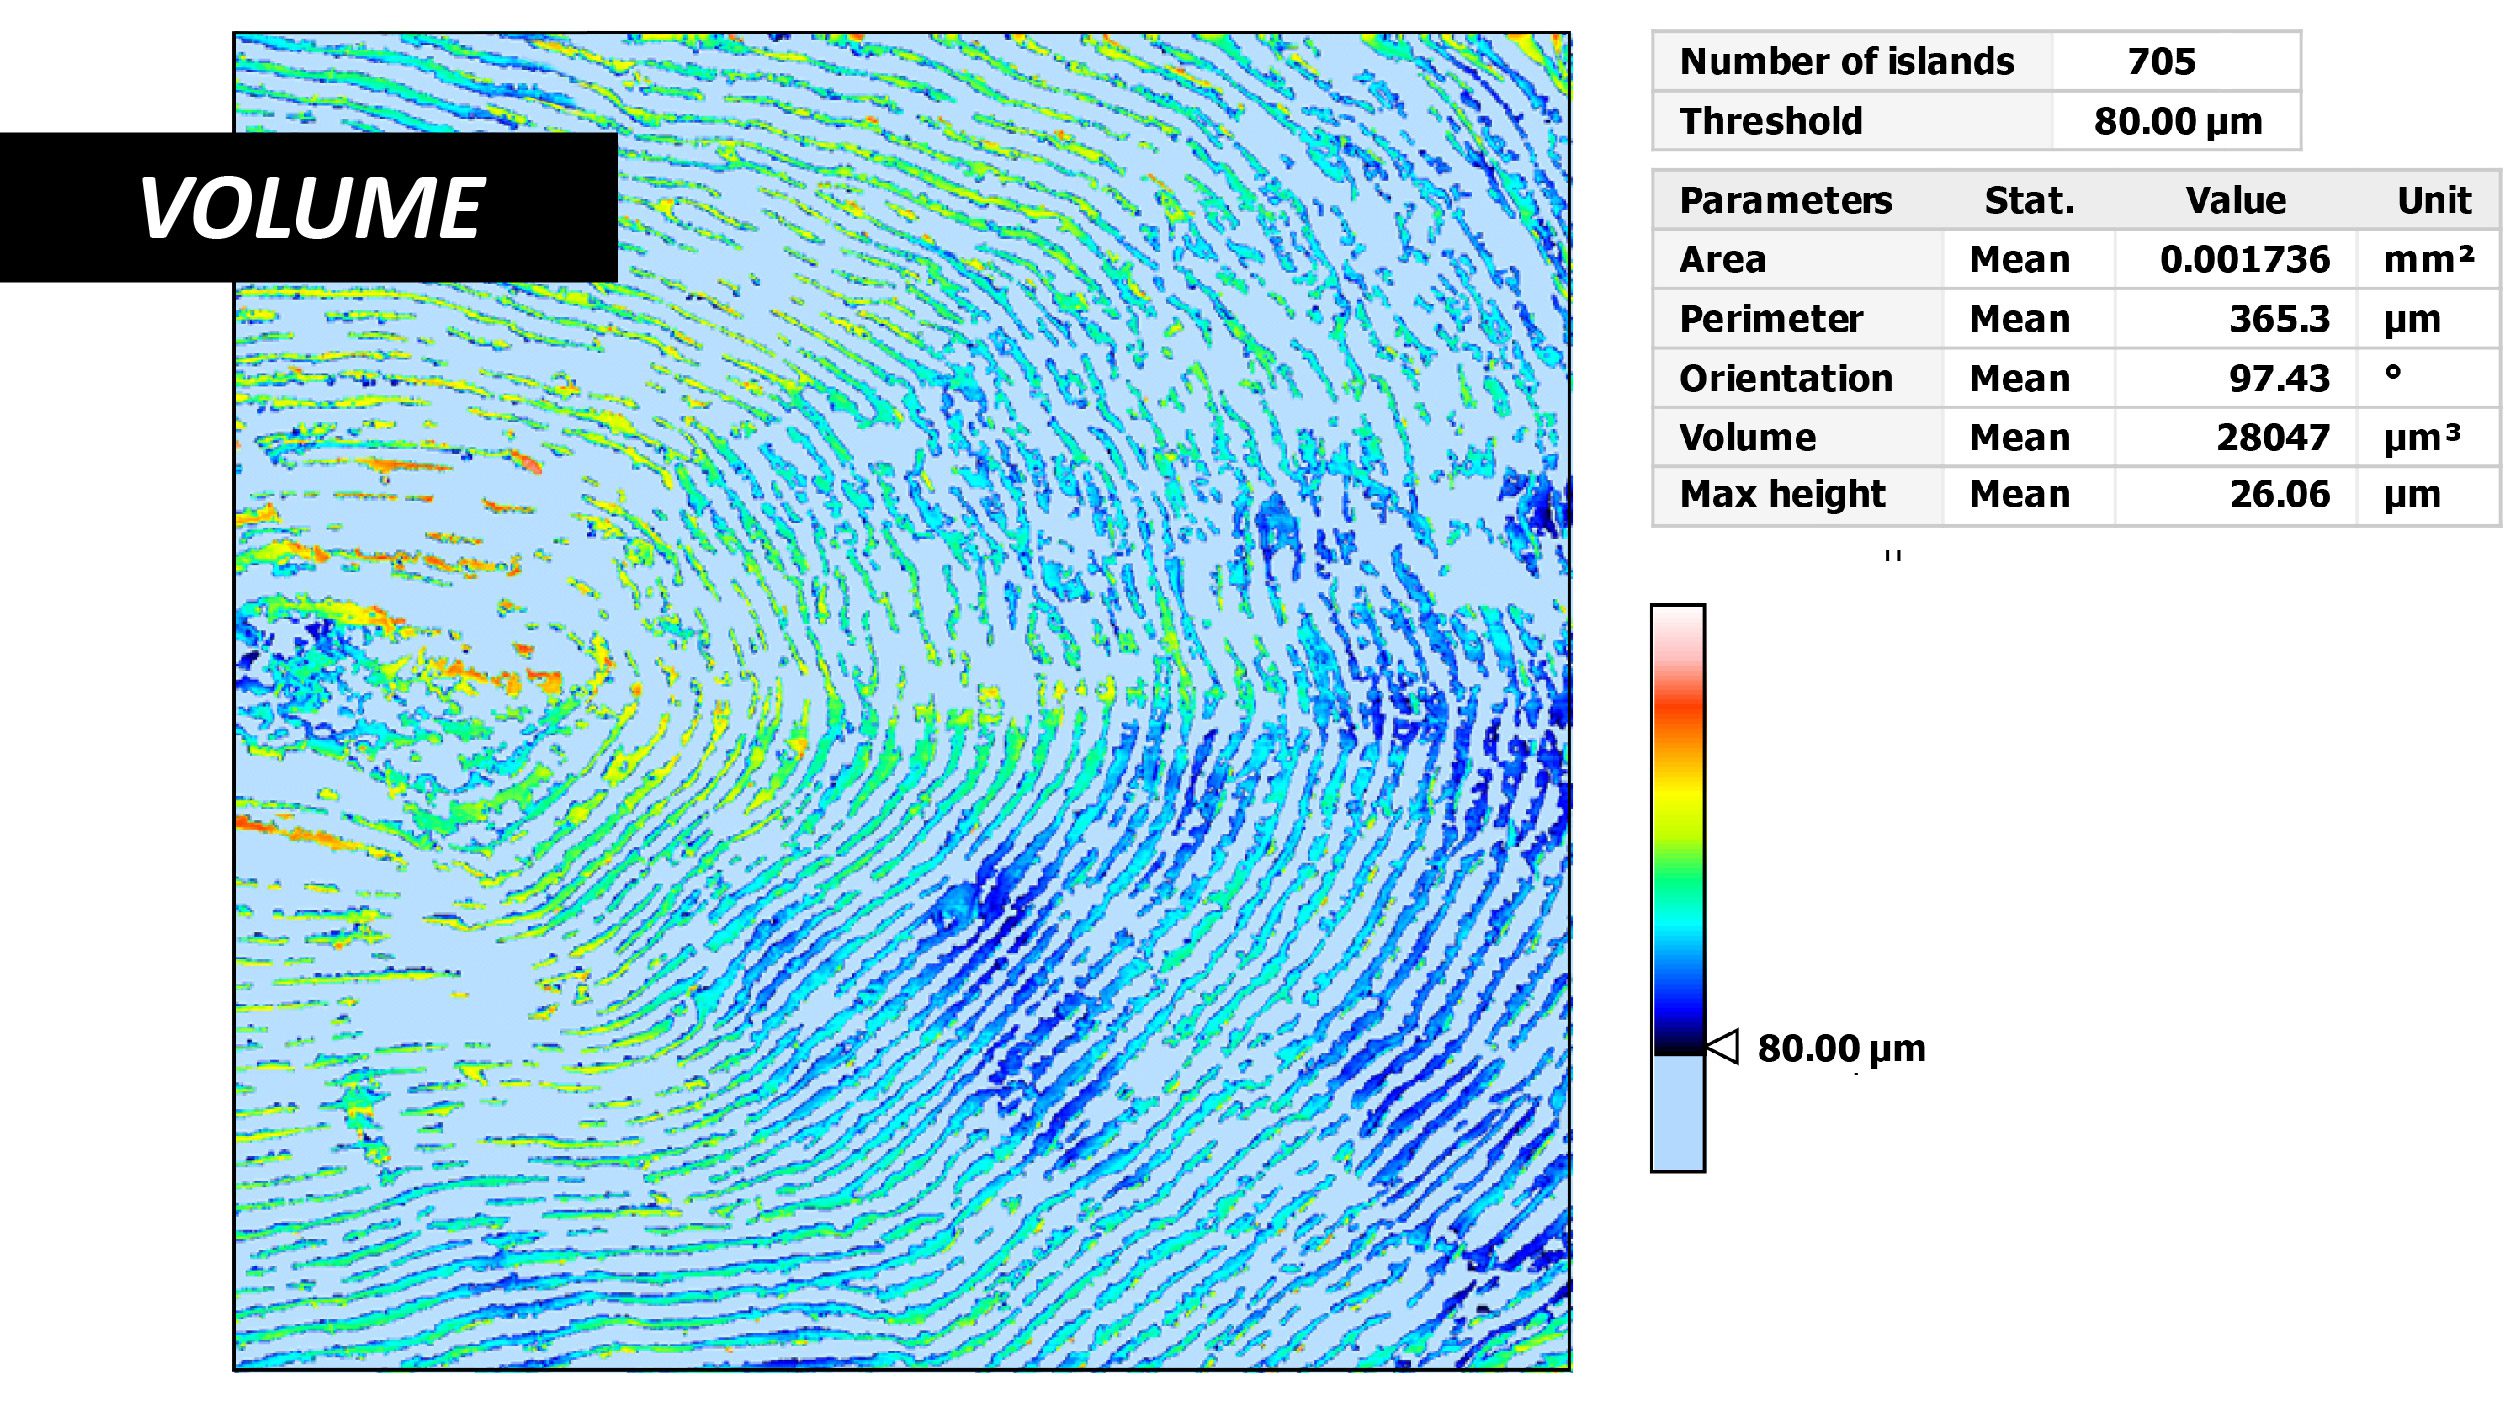
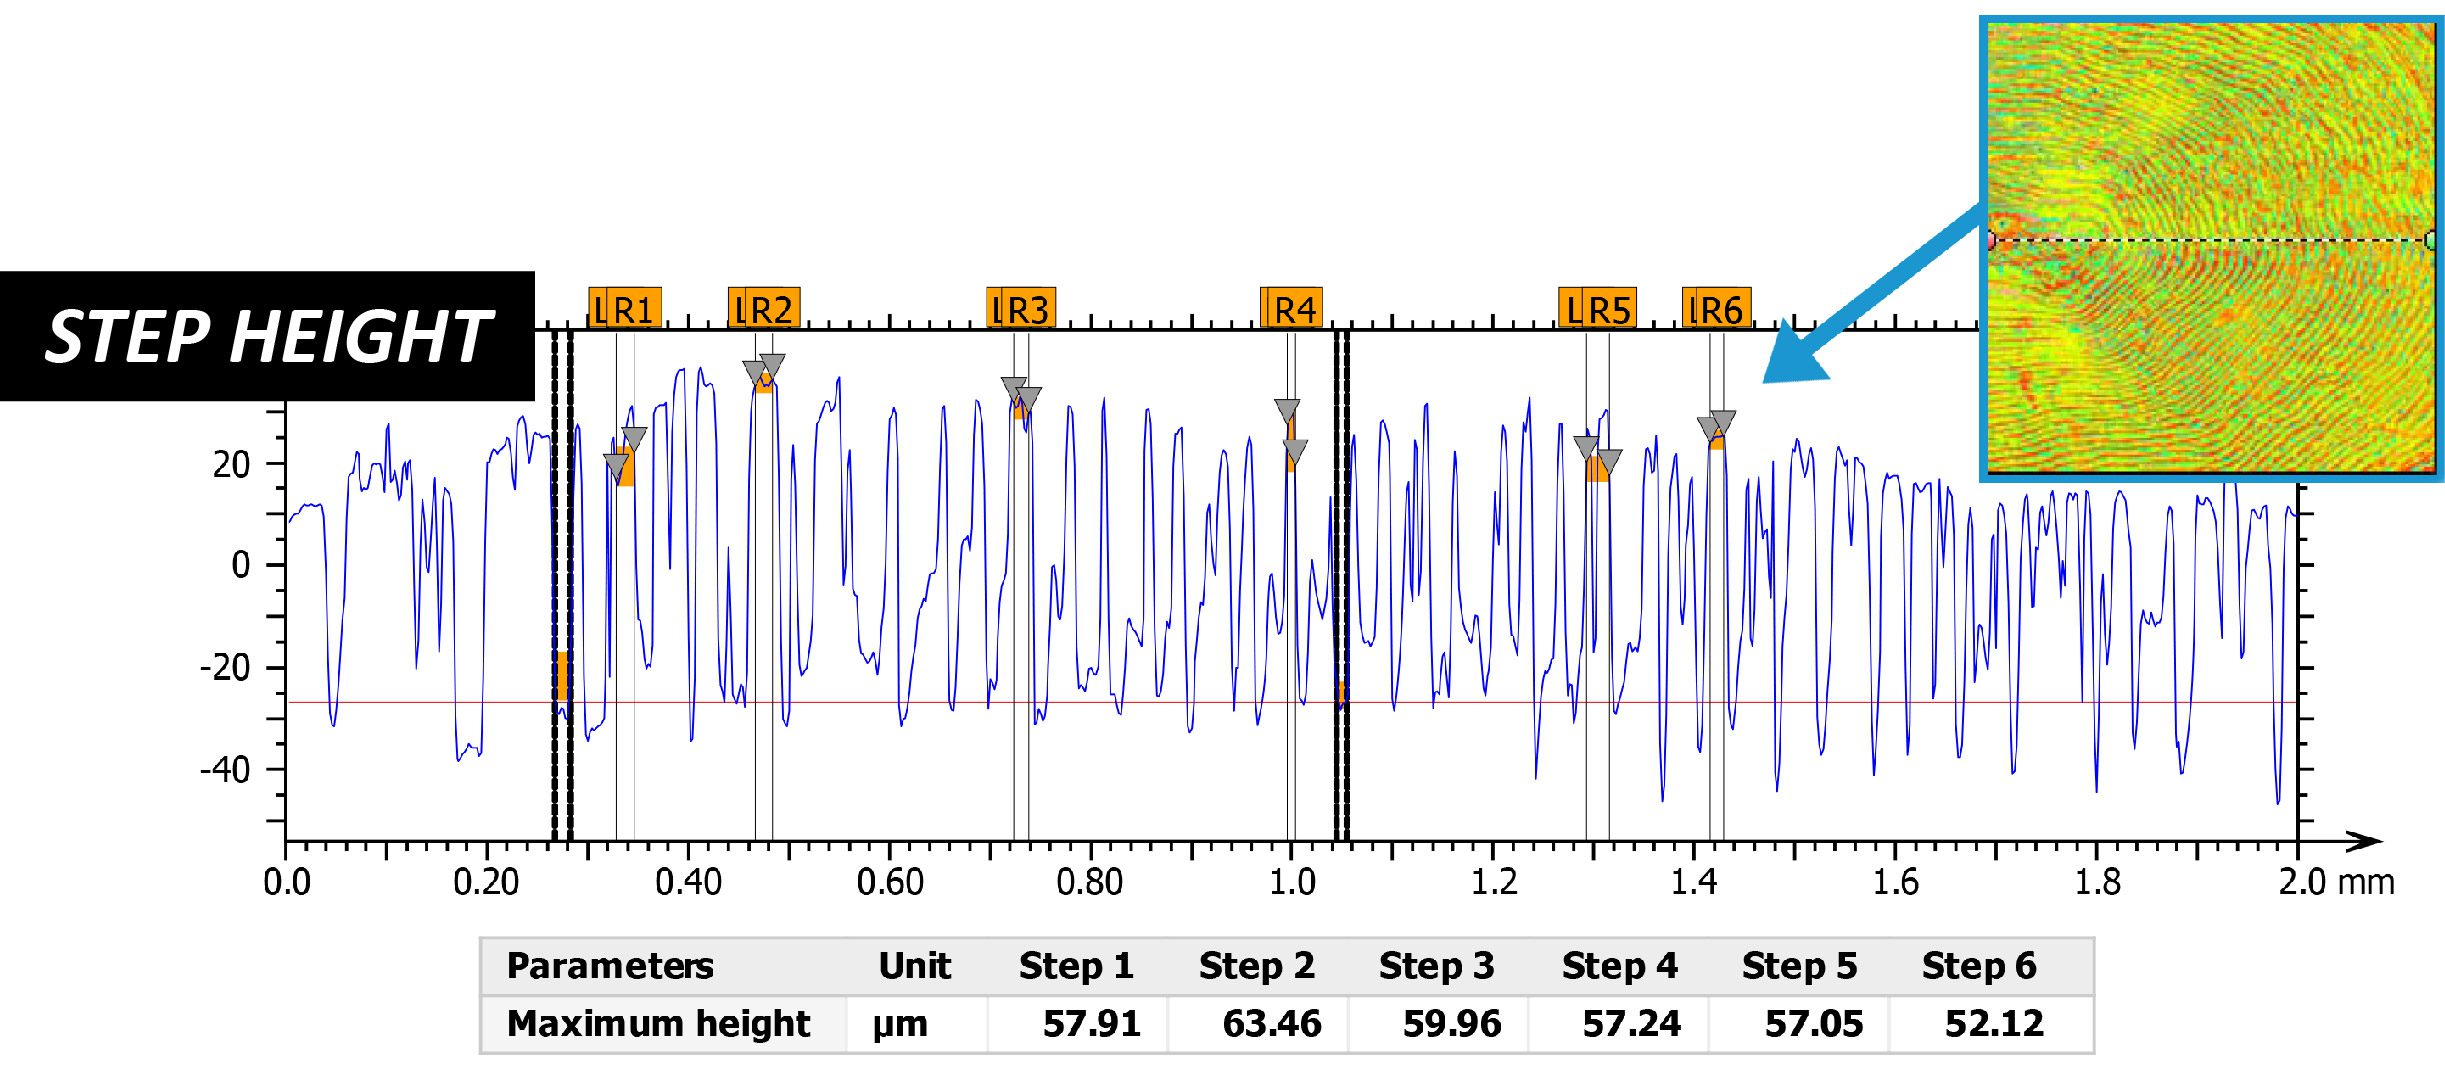
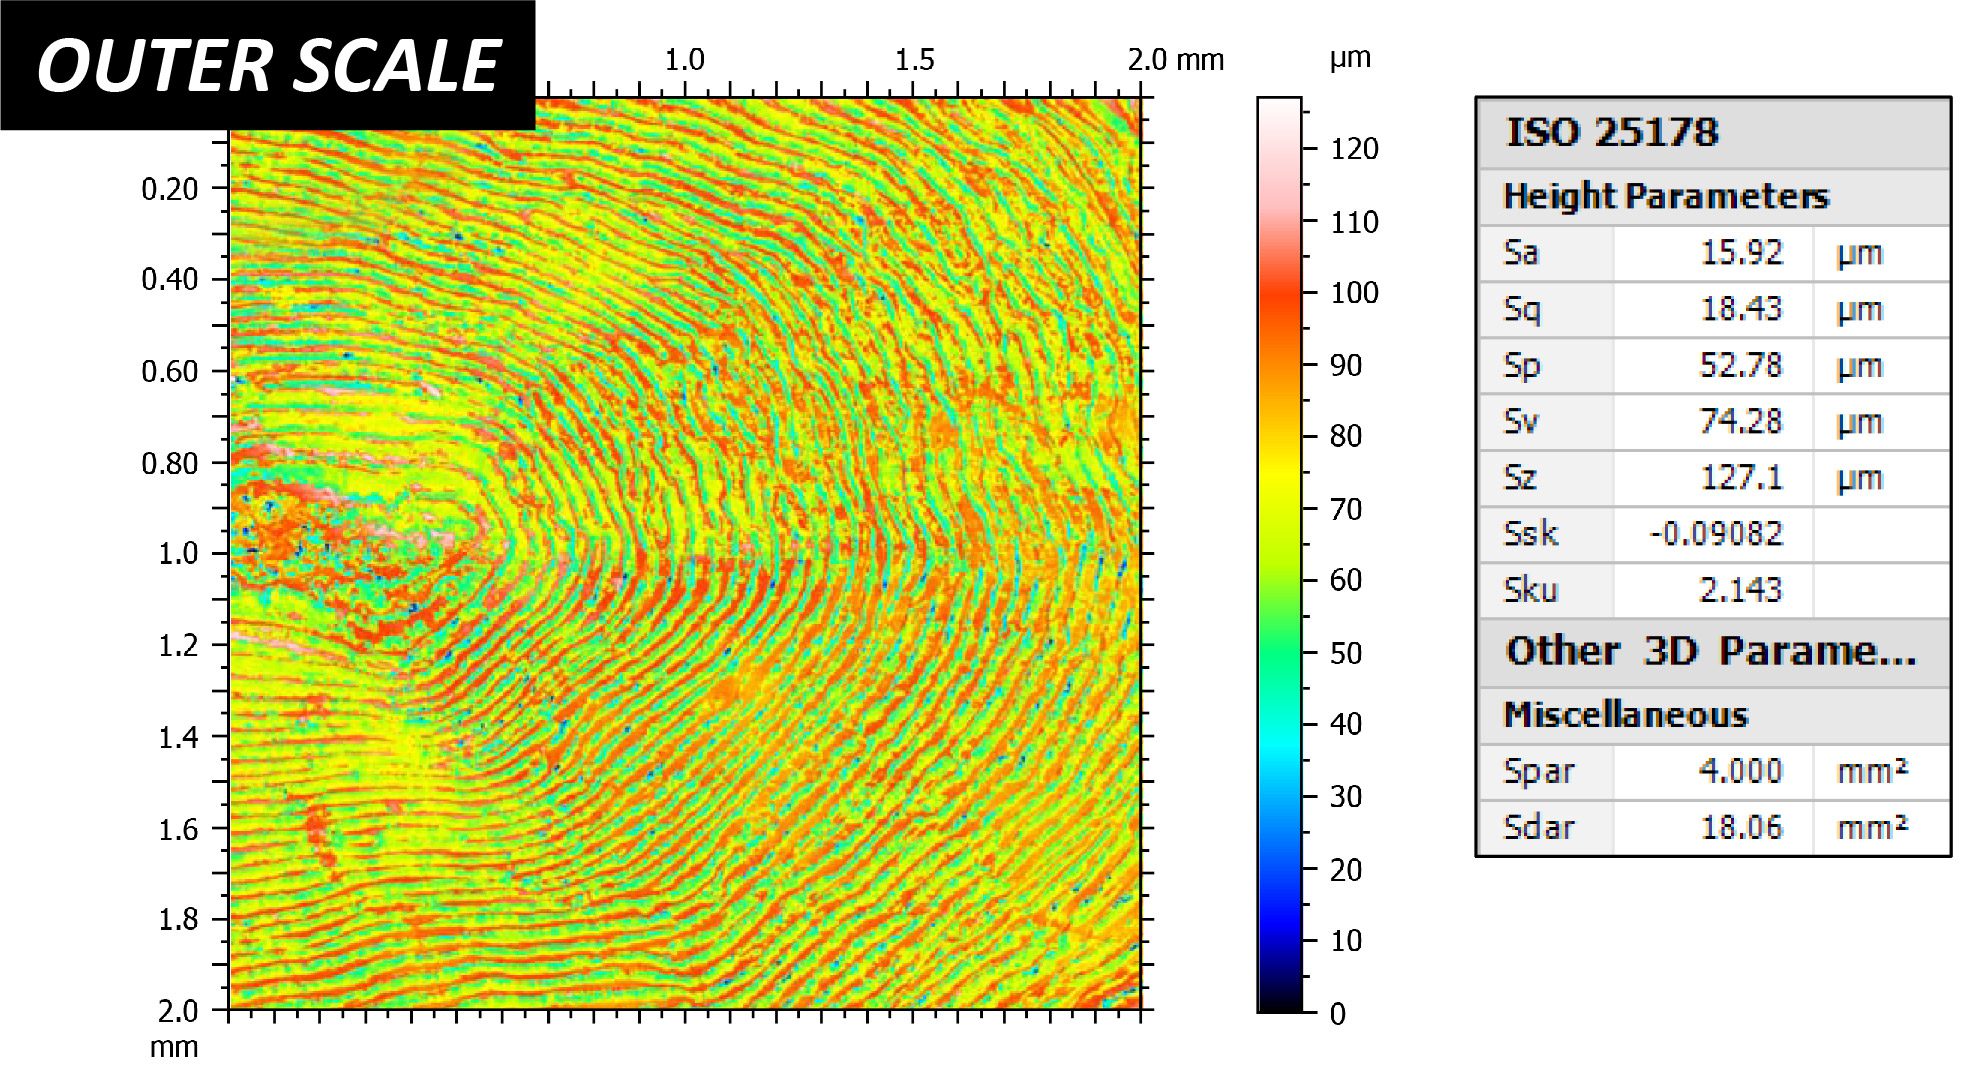
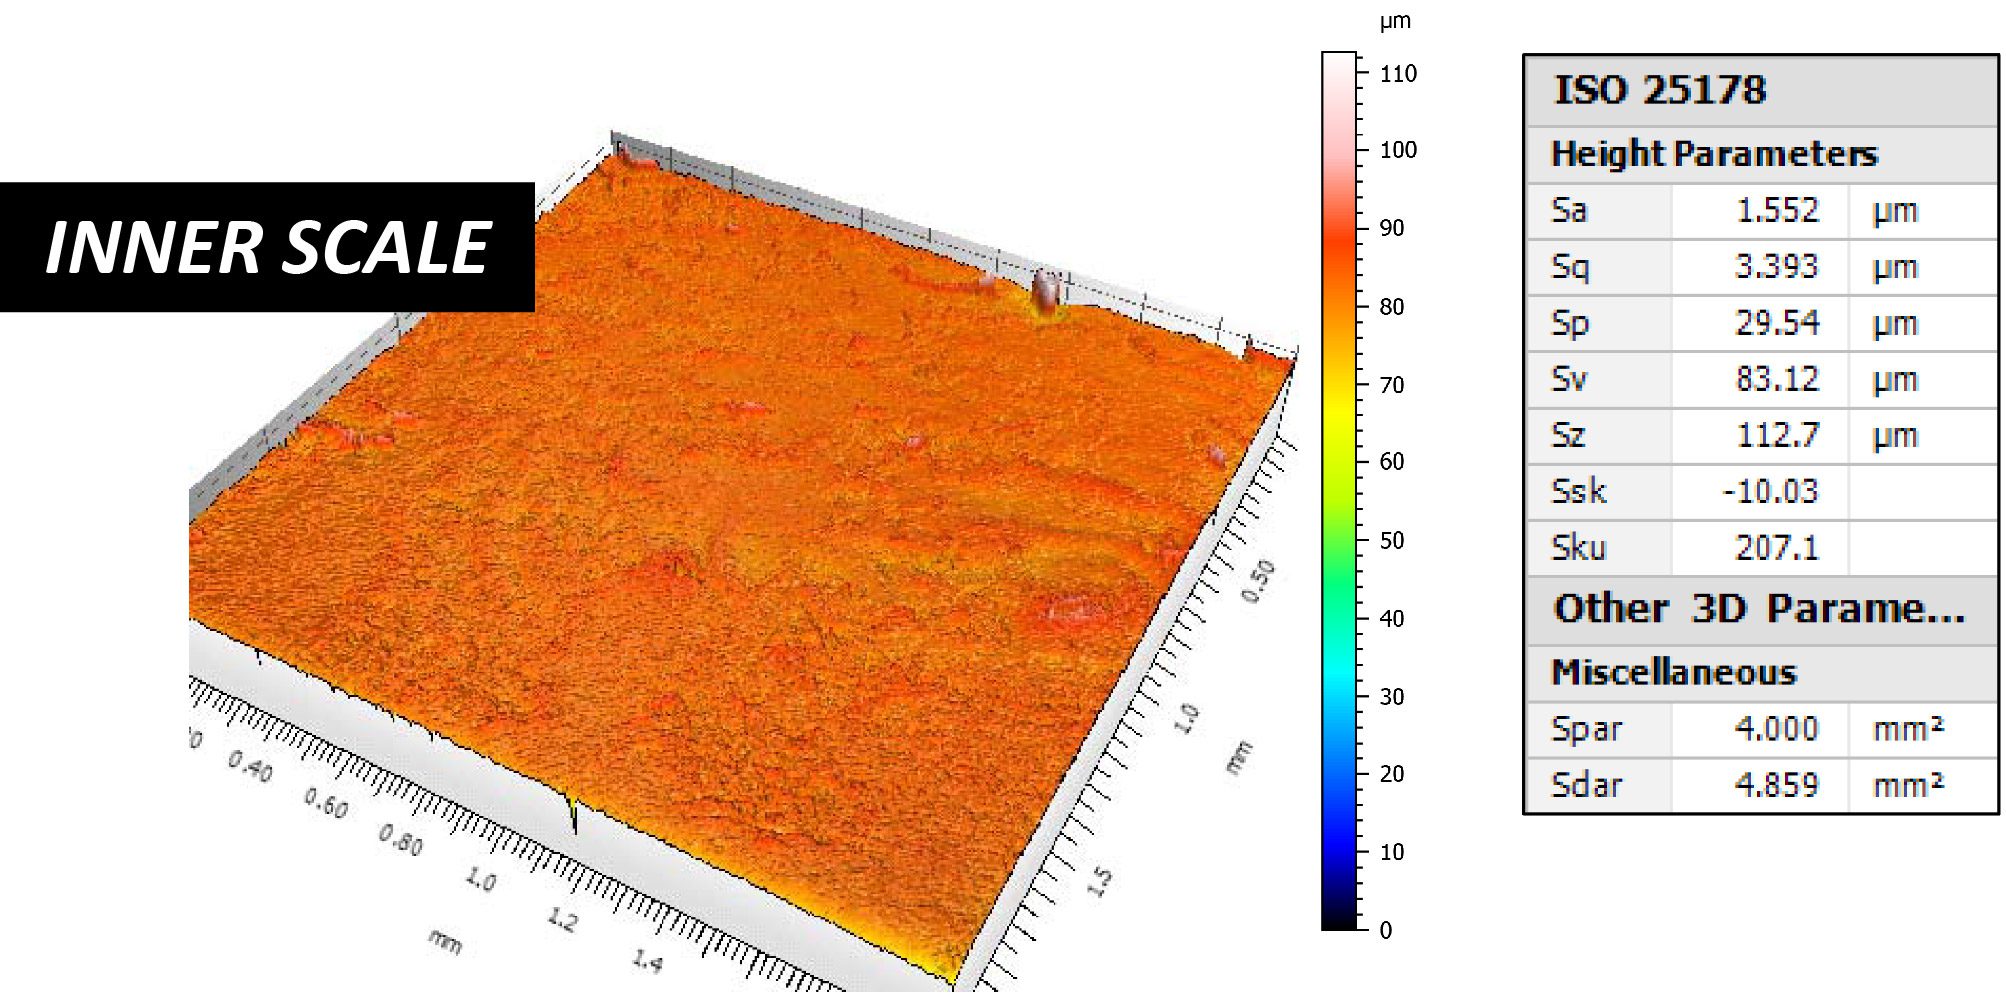
外側スケールの3Dビューとフォールスカラービューでは、指紋や木の年輪のような複雑な構造を見ることができます。これにより、ユーザーはスケールの表面特性を様々な角度から直接観察することができる分かりやすいツールを得ることができます。また、外側と内側を比較しながら、外側スケールの様々な測定値を表示します。

魚群探知機 3Dビュープロフィロメーター
魚鱗走査型ボリューム3Dプロフィロメーター
魚群探知機 ステップハイト3D光学式プロファイラ

表面粗さの比較

魚鱗プロフィロメーター 3Dスキャニング

まとめ

このアプリケーションでは、NANOVEA 3D非接触光学式プロファイラが、魚の鱗をさまざまな方法で特性評価できることを示しました。 

鱗の外側と内側は、表面粗さだけで簡単に区別でき、粗さの値はそれぞれ15.92μmと1.56μmである。さらに、鱗の外表面にある溝(サーキュレーション)を分析することで、魚の鱗について正確な情報を得ることができます。中心点から帯状のサークルの距離を測定したところ、サークルの高さは平均で約58μmであることもわかりました。 

ここに掲載したデータは、解析ソフトで利用できる計算の一部に過ぎません。

同じようなアプリケーションをお持ちですか?

高分子材料の動的機械分析(DMA)周波数掃引

ダマ周波数掃引

ナノインデンテーションを用いた高分子材料の

作成者

Duanjie Li, PhD

はじめに

動的機械解析の重要性 周波数スイープ試験

応力の周波数が変化すると、多くの場合、ポリマーの重要な機械的特性である複素弾性率が変化します。たとえば、車両が道路を走行しているとき、タイヤは周期的に大きな変形を受けます。車が高速に加速するにつれて、圧力と変形の周波数は変化します。このような変化により、車の性能の重要な要素であるタイヤの粘弾性特性が変化する可能性があります。さまざまな周波数でのポリマーの粘弾性挙動の信頼性が高く、再現可能なテストが必要です。 NANOVEAのNanoモジュール メカニカルテスター 高精度ピエゾアクチュエータによって正弦波負荷を生成し、超高感度ロードセルとコンデンサを使用して力と変位の変化を直接測定します。簡単なセットアップと高精度の組み合わせにより、動的機械解析の周波数スイープに理想的なツールとなります。

粘弾性材料は、変形するときに粘性と弾性の両方の性質を示す。高分子材料は分子鎖が長いため、弾性固体とニュートン流体の性質を併せ持つユニークな粘弾性体である。粘弾性特性は、応力、温度、周波数などの要因によって変化する。Dynamic Mechanical Analysis(DMA)は、正弦波状の応力を加え、ひずみの変化を測定することで、材料の粘弾性挙動と複素弾性率を研究するものである。

測定目的

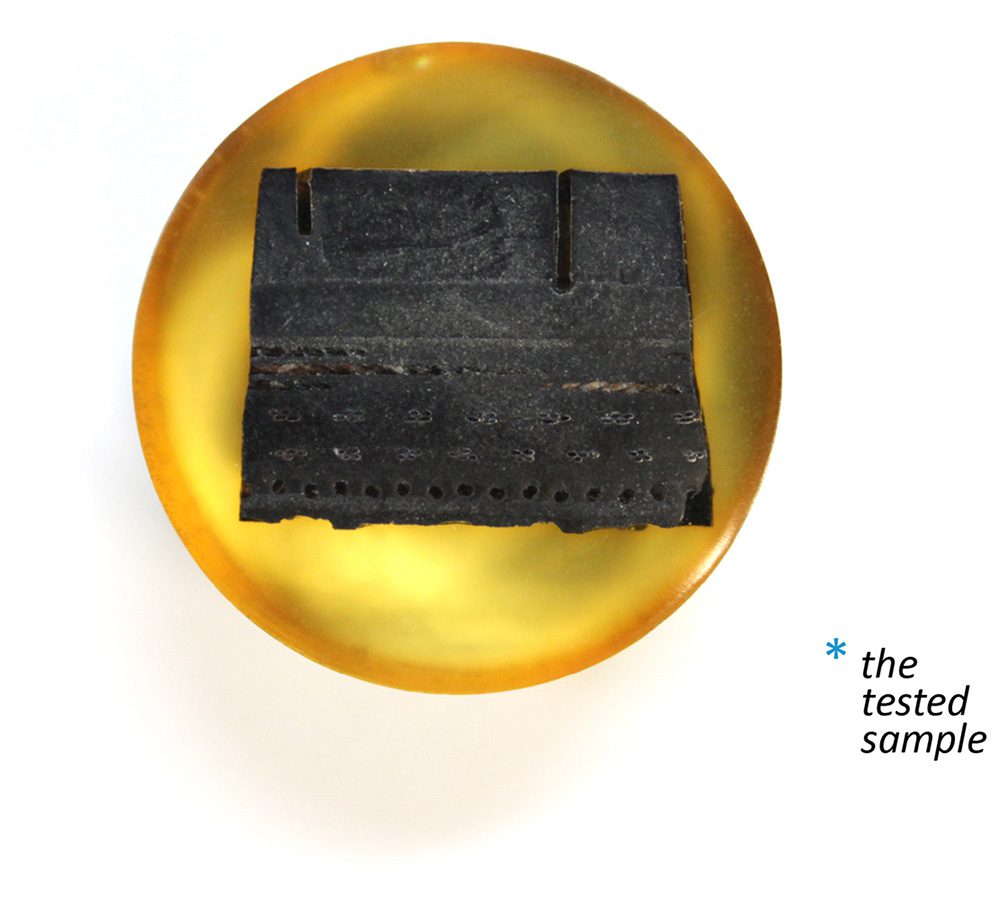
このアプリケーションでは、最も強力な機械試験機である NANOVEA PB1000 を使用して、さまざまな DMA 周波数で研磨されたタイヤ サンプルの粘弾性特性を研究します。 ナノインデンテーション モードです。

ナノビア

PB1000

試験条件

FREQUENCIES (Hz)。

0.1, 1.5, 10, 20

各フリークエムのクリープ時間

50秒

発振電圧

0.1 V

負荷電圧

1 V

圧子型

球状

ダイヤモンド|100μm

結果・考察

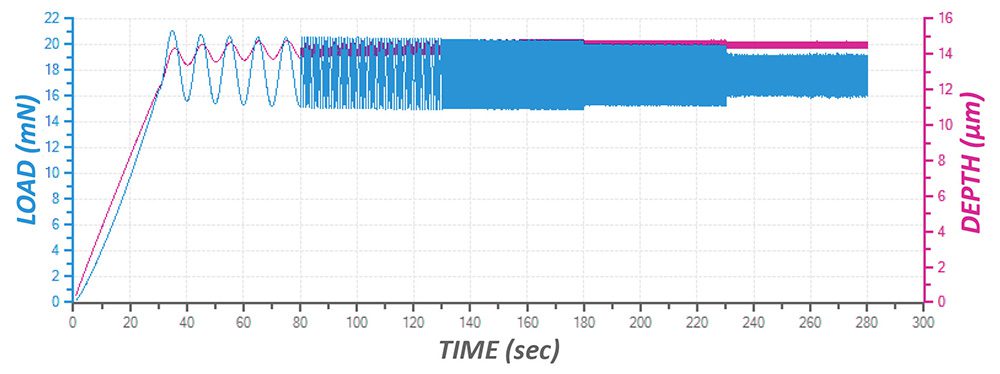
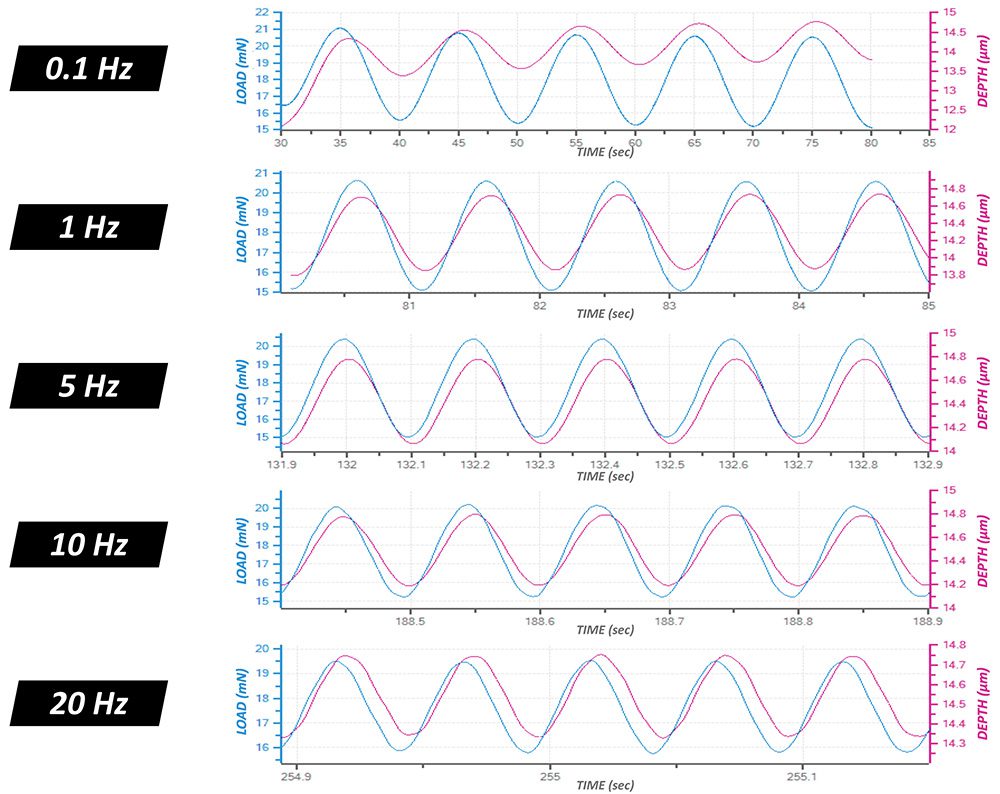
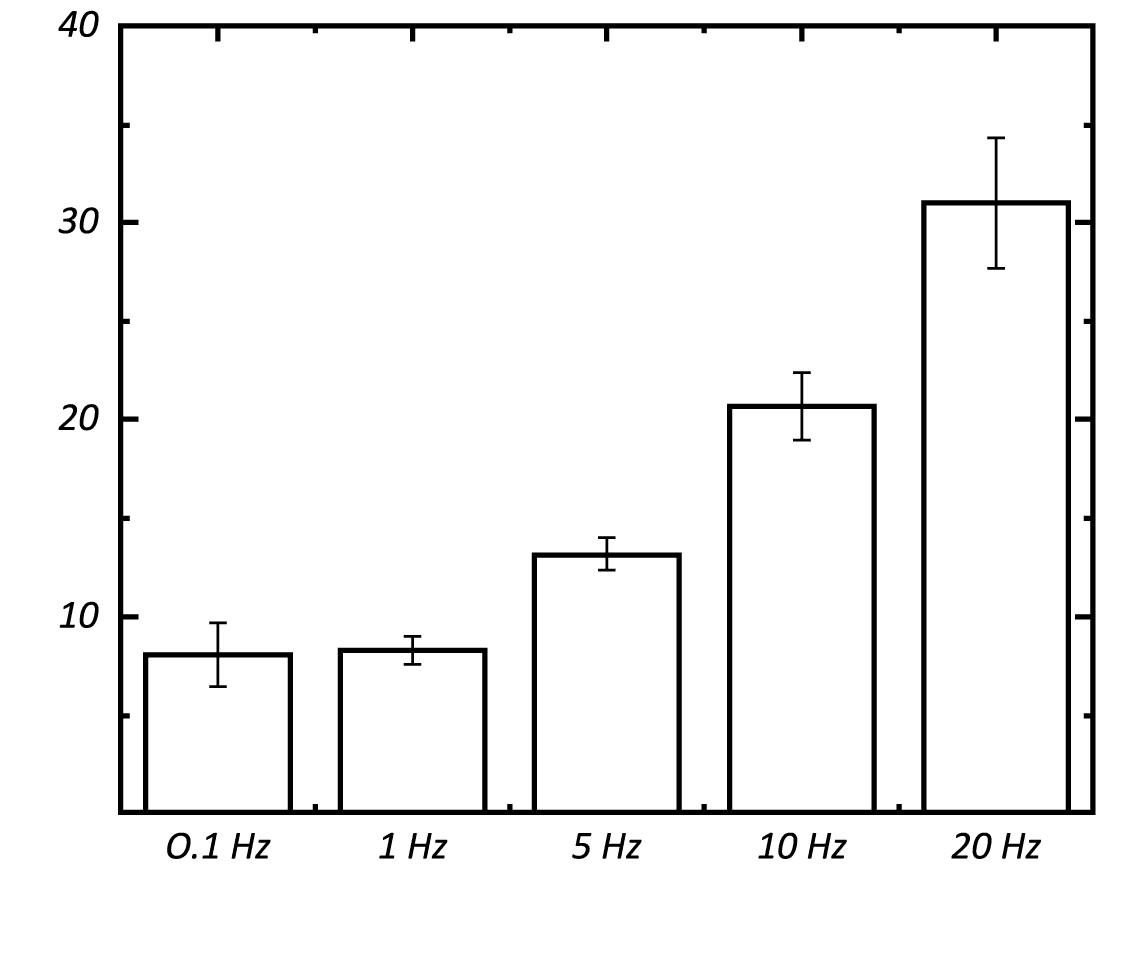
最大荷重での動的機械分析の周波数掃引により、1回の試験で異なる荷重周波数における試料の粘弾性特性について、迅速かつ簡便に測定することができます。異なる周波数における荷重波と変位波の位相シフトと振幅から、以下のような様々な基本的な材料の粘弾性特性を計算することが可能です。 貯蔵弾性率, 損失弾性率タン(δ) を以下のグラフにまとめました。 

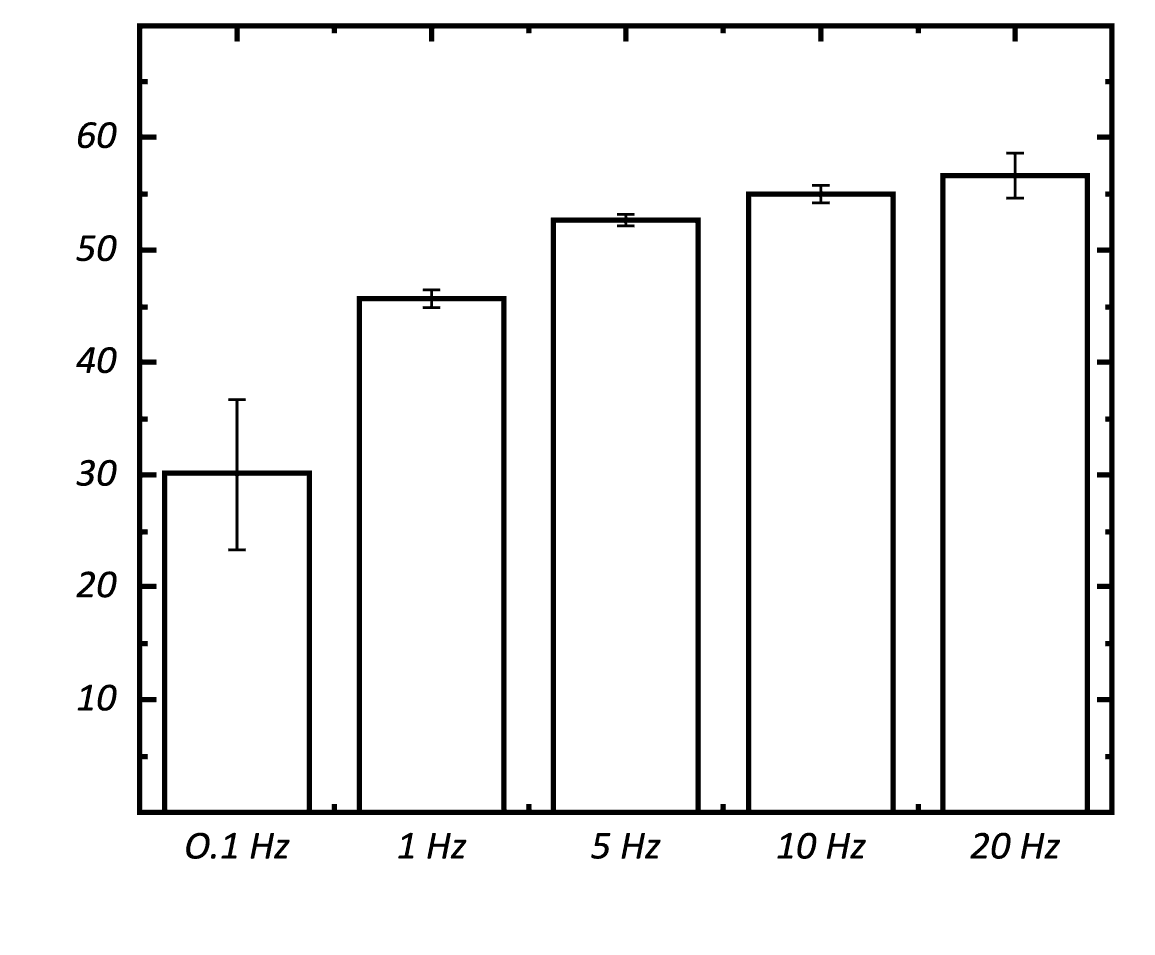
この試験で用いた 1、5、10、20 Hz の周波数は、時速約 7、33、67、134 km に相当します。試験周波数が 0.1 から 20 Hz に増加するにつれて,貯蔵弾性率と損失弾性率の両方が徐々に増加することが観察され ます。タン(δ)は周波数が 0.1 から 1 Hz に増加するにつれて ~0.27 から 0.18 に減少し、20 Hz に達すると ~0.55 まで徐々に増加します。DMAの周波数掃引により、貯蔵弾性率、損失弾性率、Tan(δ)の傾向を測定することができ、ポリマーのガラス転移だけでなく、モノマーの移動と架橋の情報を得ることができます。また、周波数掃引中に加熱板を用いて温度を上げることで、異なる試験条件下での分子運動の性質をより完全に把握することが可能です。

ロード&デプスの進化

フルDMA周波数掃引の

荷重・深度 vs 各種周波数における時間

貯蔵弾性率

異周波数で

ロス・モジューラス

異周波数で

タン(δ)

異周波数で

まとめ

本研究では、タイヤサンプルの動的力学解析周波数スイープ試験におけるNANOVEAメカニカルテスターの能力を紹介しました。この試験は、異なる周波数の応力におけるタイヤの粘弾性特性を測定するものです。タイヤは、負荷周波数が0.1Hzから20Hzまで増加するにつれて貯蔵弾性率と損失弾性率が増加することがわかります。異なる速度で走行するタイヤの粘弾性挙動に関する有用な情報を提供し、よりスムーズで安全な走行のためのタイヤ性能の向上に不可欠なものです。DMA周波数スイープ試験は、異なる天候下でのタイヤの現実的な作業環境を模倣するために、様々な温度で実施することができます。

メカニカルテスターNANOVEAのナノモジュールでは、ファストピエゾによる荷重印加は、別の高感度ストレインゲージによる荷重測定から独立しています。深さと荷重の間の位相は、センサーから収集されたデータから直接測定されるため、動的機械分析において明確な利点となります。位相の計算は直接的で、損失や貯蔵弾性率の結果に不正確さを加えるような数学的モデリングは必要ありません。これはコイルベースのシステムには当てはまりません。

結論として、DMAは接触深さ、時間、周波数の関数として、損失弾性率、貯蔵弾性率、複素弾性率、Tan(δ)を測定します。オプションの加熱ステージにより、DMA中に材料の相転移温度を測定することができます。ナノベアメカニカルテスターは、ナノモジュールとマイクロモジュールを一つのプラットフォームで提供する、他に類を見ない多機能なテスターです。ナノとマイクロの両モジュールには、スクラッチテスター、硬さ試験機、摩耗試験機のモードがあり、1つのモジュールで最も幅広く、最も使いやすい試験方法を提供します。

同じようなアプリケーションをお持ちですか?

フレネルレンズトポグラフィー

フレネルレンズトポグラフィー使用 3D 非接触光学式形状測定機

作成者

Duanjie Li & Benjamin Mell

はじめに

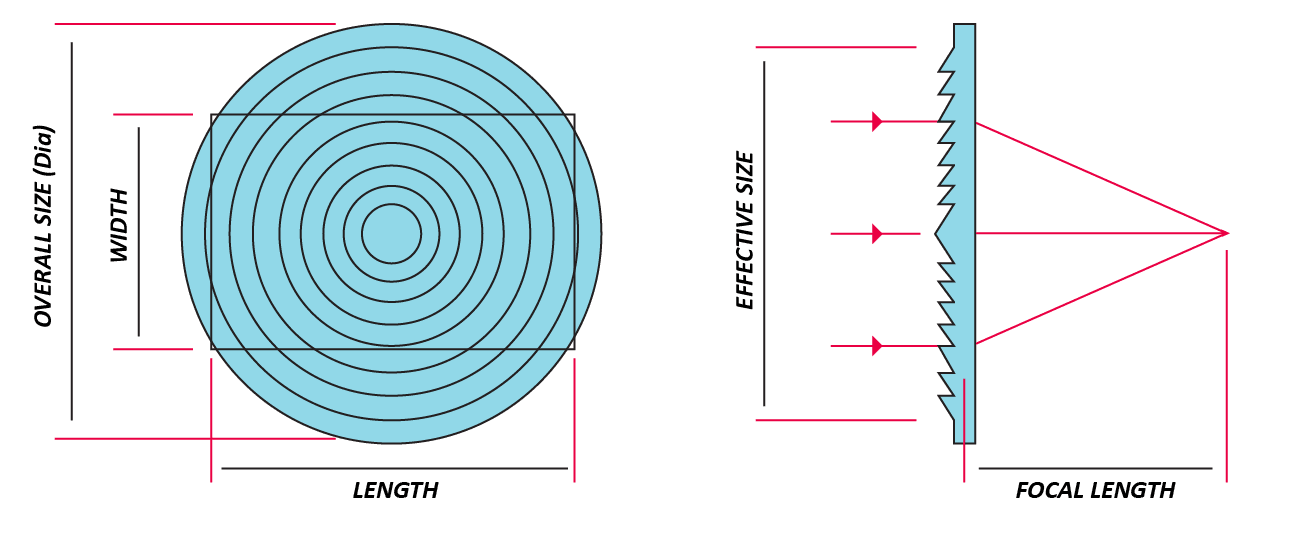
レンズは、光を透過・屈折させる軸対称の光学デバイスです。単純なレンズは、光を収束または発散させるための単一の光学部品で構成されています。球面はレンズを作るには理想的な形状ではないが、ガラスを研磨して作ることができる最も単純な形状としてよく使われる。

フレネルレンズは、同心円状のリングを並べたもので、幅が数千分の一インチと小さい単純なレンズの薄い部分である。フレネルレンズは、同じ光学特性を持つ従来のレンズに比べて、大口径で焦点距離が短く、コンパクトに設計されているため、必要な重量や材料の体積が少なくて済む。フレネルレンズの形状が薄いため、光の吸収による損失が非常に少ない。

フレネルレンズ検査における3D非接触形状計測の重要性

フレネル レンズは、自動車産業、灯台、太陽エネルギー、航空母艦の光学着陸システムで広く使用されています。透明なプラスチックからレンズを成形または打ち抜き加工することにより、製造のコスト効率を高めることができます。フレネル レンズのサービス品質は、主に同心リングの精度と表面品質に依存します。 NANOVEA はタッチプローブ技術とは異なり、 光学プロファイラー 表面に触れずに 3D 表面測定を実行できるため、新たな傷ができるリスクが回避されます。クロマティック ライト技術は、さまざまな形状のレンズなど、複雑な形状を正確にスキャンするのに最適です。

フレネルレンズ回路図

透明プラスチックフレネルレンズは、成形またはスタンピングによって製造することができます。正確で効率的な品質管理は、不良品の金型やスタンプを明らかにするために重要です。同心円の高さとピッチを測定し、その値をレンズメーカーが指定する仕様値と比較することで、製造上のばらつきを検出することができます。

レンズのプロファイルを正確に測定することで、金型やスタンプがメーカーの仕様に合うように適切に加工されます。さらに、スタンプは時間の経過とともに徐々に磨耗し、初期の形状を失う可能性があります。レンズメーカーの仕様から一貫して逸脱している場合は、金型の交換が必要であることを示すポジティブな兆候です。

測定目的

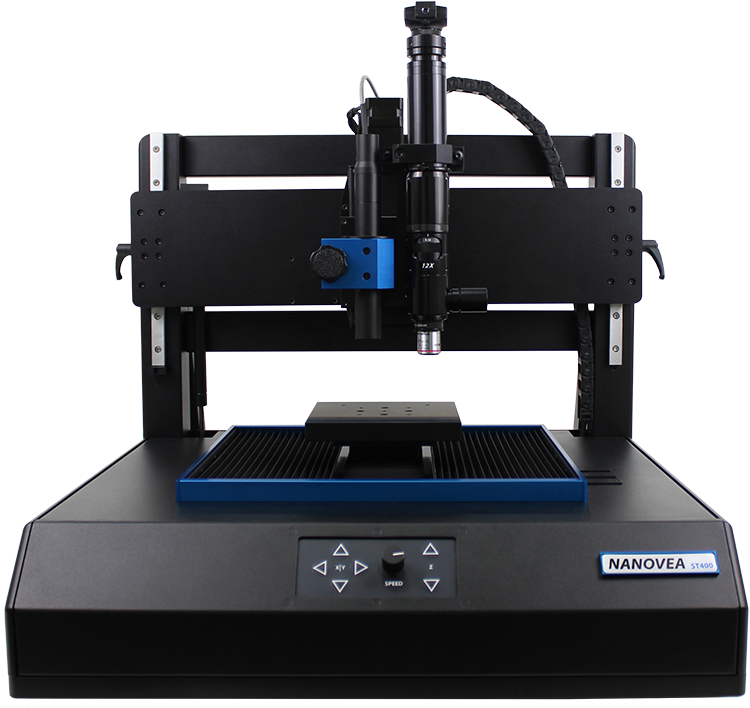
このアプリケーションでは、複雑な形状の光学部品の包括的な3Dプロファイル解析を提供する、高速センサー搭載の3D非接触プロファイラ、NANOVEA ST400を紹介します。当社のクロマティック・ライト・テクノロジーの卓越した能力を実証するため、フレネルレンズの輪郭解析を実施しました。.

ナノビア ST400 大面積
光学式3Dプロフィロメーター

今回使用した2.3インチ×2.3インチのアクリルフレネルレンズは、以下のような構成になっています。 

同心円状のリングと複雑な鋸歯状の断面形状が特徴です。 

焦点距離は1.5インチ、有効径は2.0インチです。 

1インチあたり125本の溝があり、屈折率は1.49です。

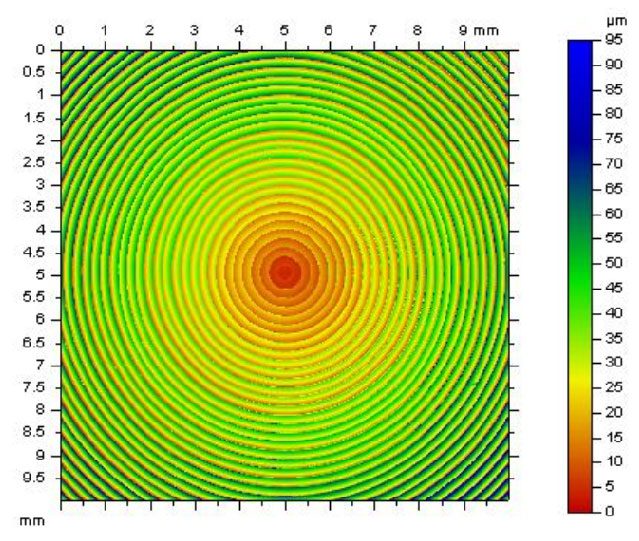
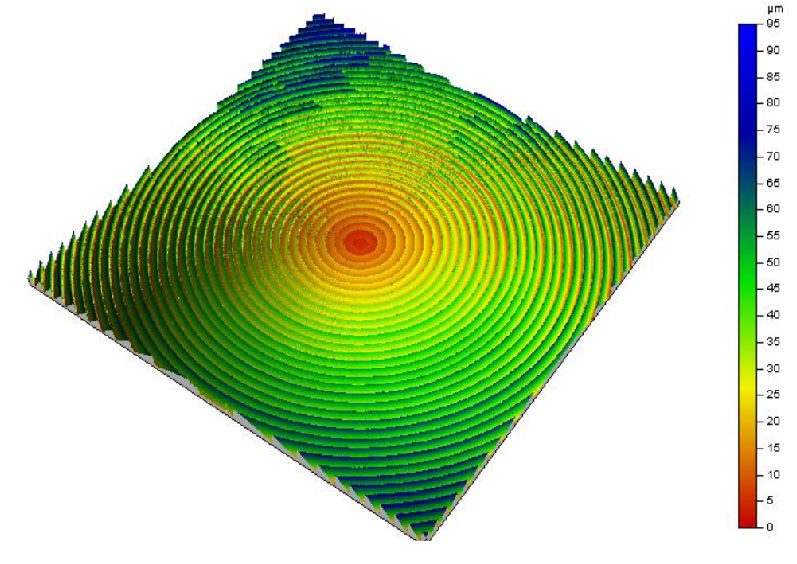
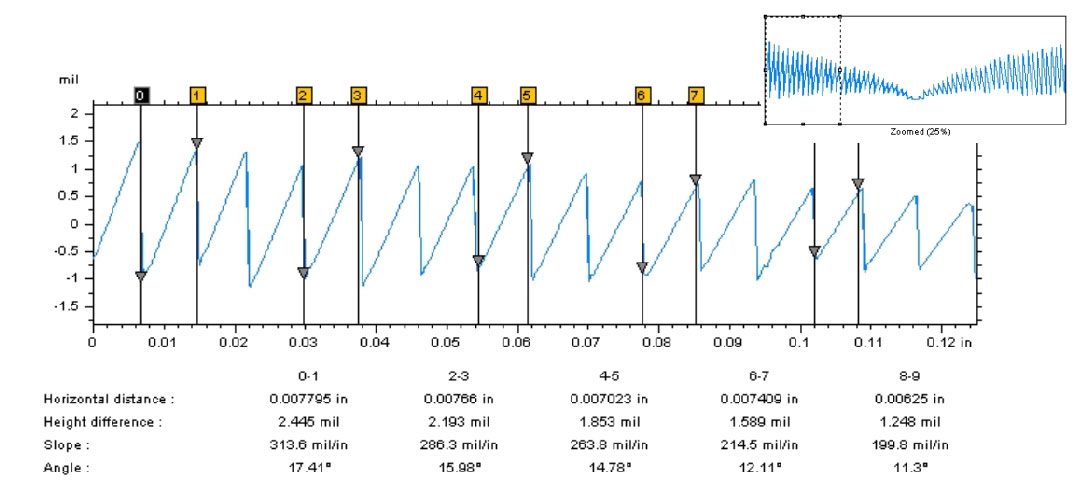
NANOVEA ST400でフレネルレンズをスキャンすると、同心円のリングの高さが中心から外側に向かうにつれて顕著に増加していることがわかります。

2D FALSE COLOR

高さ方向の表現

3D VIEW

抽出されたプロファイル

ピーク&バレイ

プロファイルの寸法解析

まとめ

このアプリケーションでは、非接触光学式プロファイラ「NANOVEA ST400」がフレネルレンズの表面形状を正確に測定することを紹介しています。 

複雑なセレーション形状から、高さとピッチの寸法をNANOVEA解析ソフトウェアで正確に決定することができます。ユーザーは、製造したレンズのリングの高さとピッチの寸法を理想的なリングの仕様と比較することにより、製造金型やスタンプの品質を効果的に検査することができます。

ここに掲載したデータは、解析ソフトで利用できる計算の一部に過ぎません。 

半導体、マイクロエレクトロニクス、太陽電池、光ファイバー、自動車、航空宇宙、冶金、機械加工、コーティング、医薬品、バイオメディカル、環境などの分野で、ほぼあらゆる表面を測定するナノベアの光学式プロファイラ。


同じようなアプリケーションをお持ちですか?

機械加工品QC

機械加工品検査

機械加工品

CADモデルからの3次元形状測定による検査

著者

Duanjie Li, PhD

によって改訂されました。

Jocelyn Esparza

プロフィロメーターによる機械加工部品の検査

はじめに

複雑な形状を作り出す精密機械加工の需要は、様々な産業分野で高まっています。航空宇宙、医療、自動車からハイテクギア、機械、楽器に至るまで、絶え間ない革新と進化は、期待値と精度基準を新たな高みへと押し上げます。その結果、製品の品質を確保するための厳しい検査技術や検査装置の需要が高まっています。

部品検査における3次元非接触プロフィロメトリの重要性

機械加工されたパーツの特性をCADモデルと比較することは、公差や製造規格の遵守を確認するために不可欠です。また、部品の摩耗や損傷により交換が必要になることもあるため、使用期間中の検査も非常に重要です。要求された仕様からの逸脱を適時に特定することで、費用のかかる修理や生産停止、評価の低下を回避することができます。

タッチプローブ技術とは異なり、NANOVEA 光学プロファイラー 非接触で 3D 表面スキャンを実行し、複雑な形状を最高の精度で迅速かつ正確かつ非破壊で測定できます。

測定目的

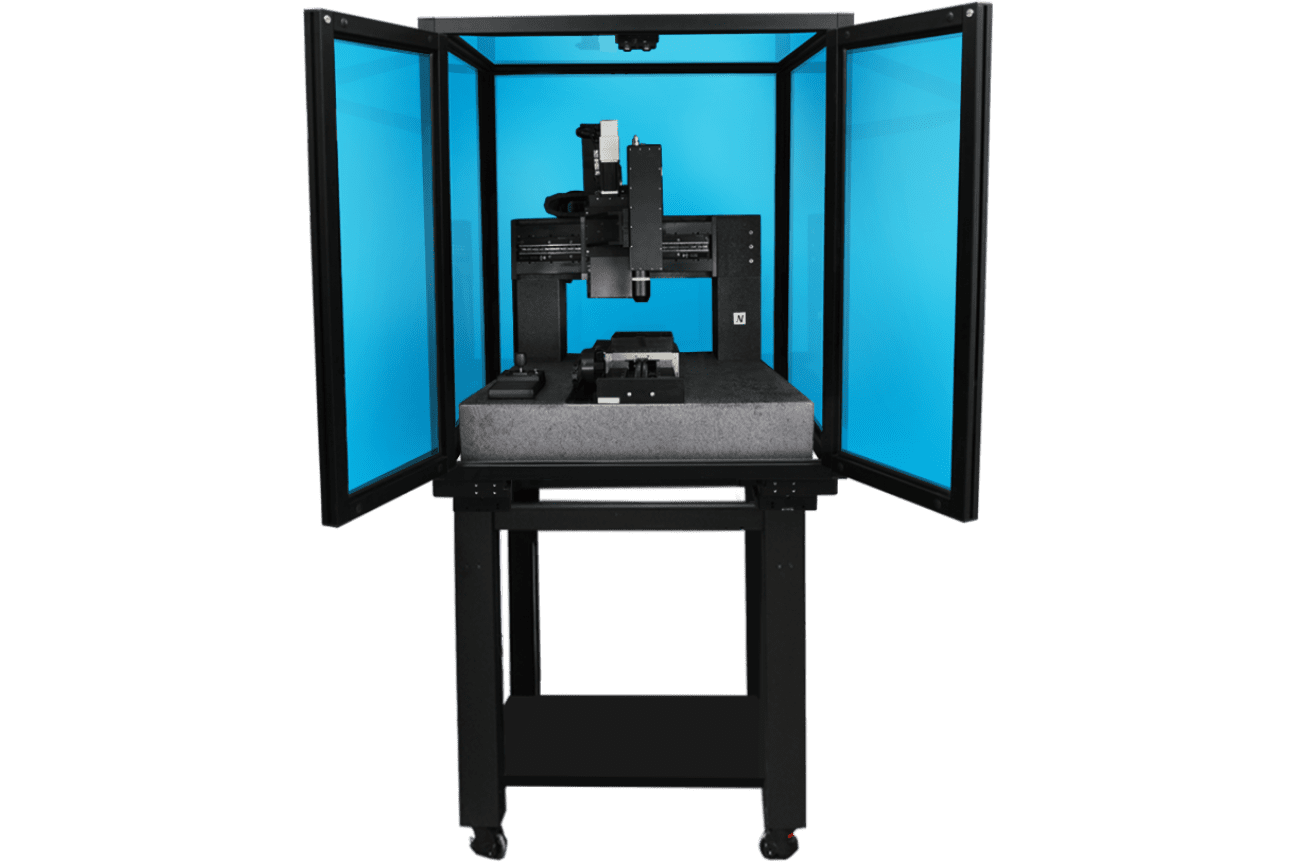
このアプリケーションでは、高速センサーを搭載し、寸法、半径、粗さの総合的な表面検査を行う3D非接触プロファイラー、NANOVEA HS2000を紹介します。 

すべて40秒以内で。

ナノビア

HS2000

CADモデル

機械加工された部品の寸法と表面粗さを正確に測定することは、その部品が要求された仕様、公差、表面仕上げを満たしていることを確認するために重要です。検査するパーツの3Dモデルとエンジニアリングドローイングを以下に紹介します。 

偽色表示

図3は、CADモデルとスキャンした加工面のフォールスカラー図を比較したもので、サンプル表面の高さ変化を色の変化で観察することができる。

図2に示すように、3Dサーフェススキャンから3つの2Dプロファイルを抽出し、加工された部品の寸法公差をさらに検証します。

プロファイルの比較と結果

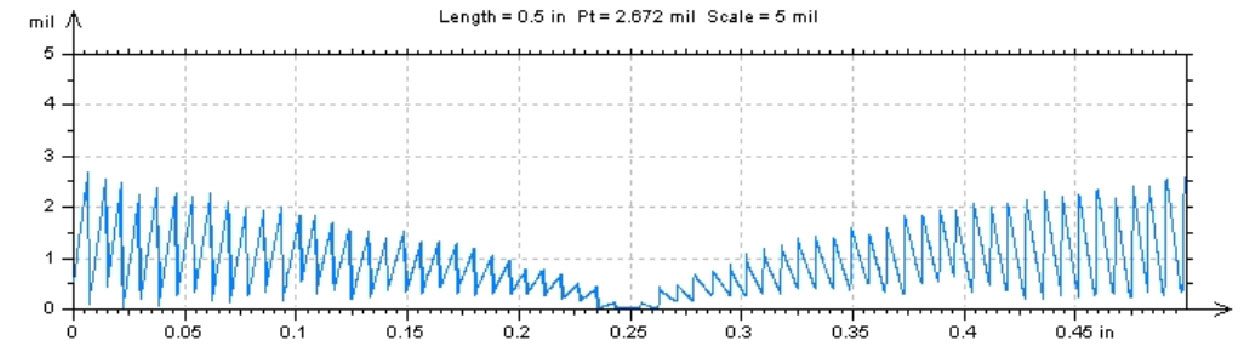
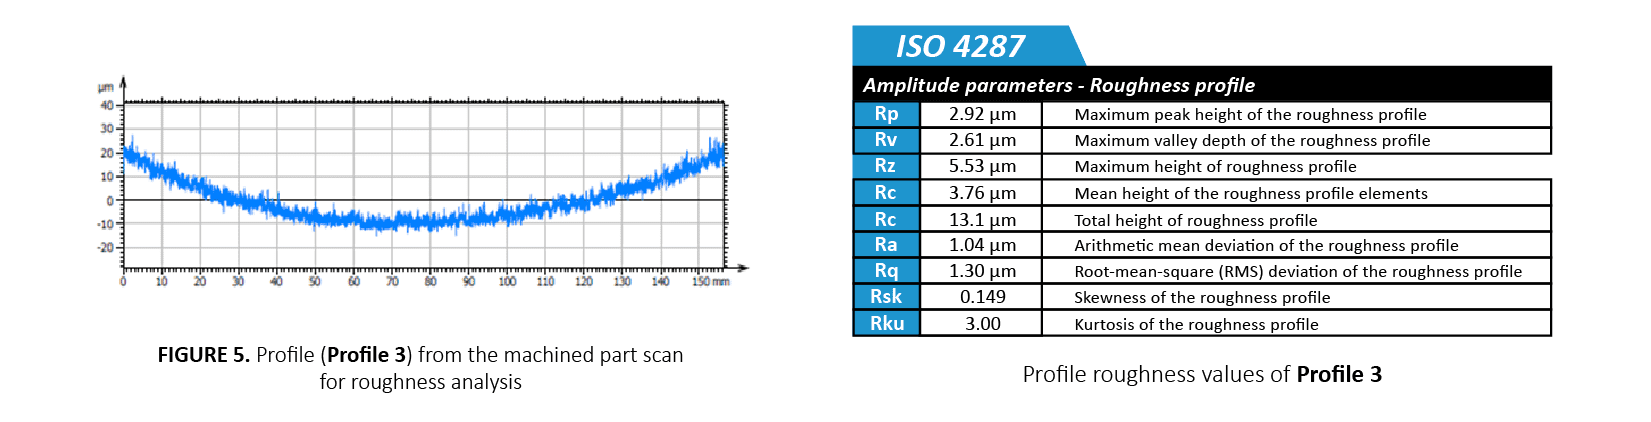
図3~図5にプロファイル1~3を示す。測定したプロファイルをCADモデルと比較することで、定量的な公差検査を行い、厳格な製造基準を維持しています。プロファイル1とプロファイル2は、曲面加工された部品の異なる領域の半径を測定する。プロファイル2の高さの変動は、156mmの長さで30μmであり、要求される公差±125μmを満たしています。 

公差の限界値を設定することで、解析ソフトが加工した部品の合否を自動的に判定することができます。

プロフィロメーターによる機械部品検査

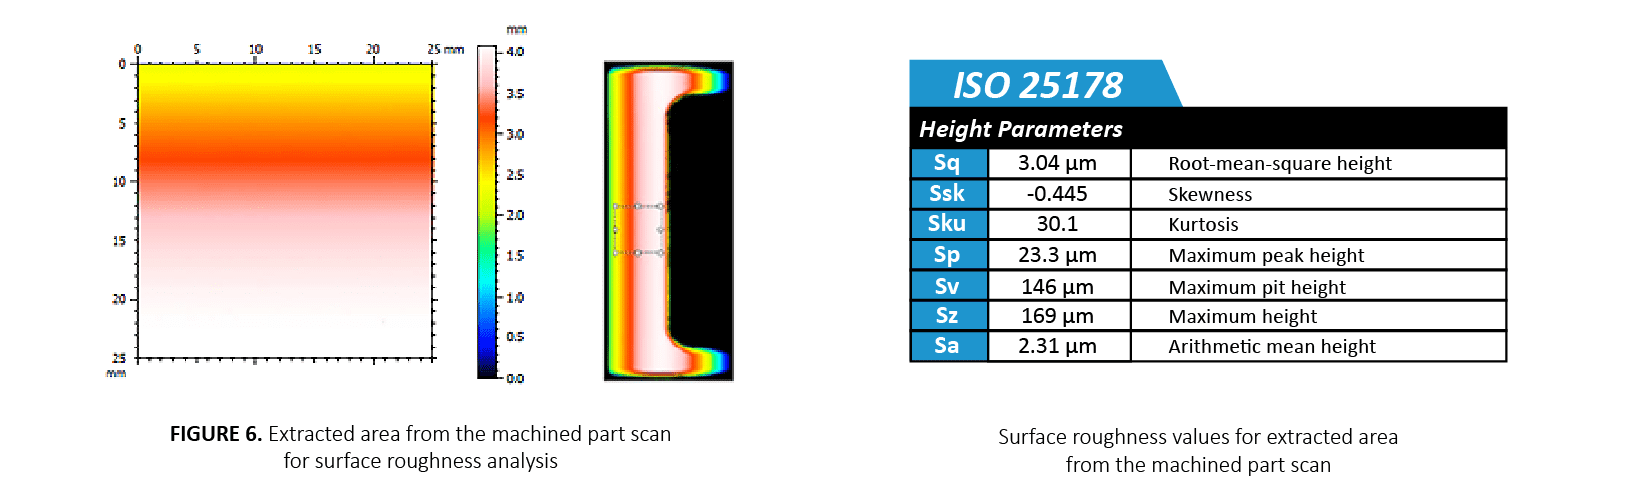
加工された部品の表面の粗さと均一性は、その品質と機能性を確保するために重要な役割を果たします。図6は、表面仕上げを定量化するために使用した加工部品の親スキャンから抽出した表面積です。平均表面粗さ(Sa)は、2.31μmと算出された。

まとめ

今回は、高速センサーを搭載した非接触プロファイラー「NANOVEA HS2000」が、寸法や粗さなど総合的な表面検査を行う様子を紹介しました。 

高解像度スキャンにより、加工されたパーツの詳細な形態や表面形状を測定し、CADモデルとの定量的な比較を行うことができます。また、キズやクラックなどの欠陥も検出することが可能です。 

高度な輪郭解析は、加工された部品が設定された仕様を満たしているかどうかを判断するだけでなく、摩耗した部品の故障メカニズムを評価する比類のないツールとなっています。

ここに示したデータは、NANOVEA光学式プロファイラに搭載されている高度な解析ソフトウェアで可能な計算の一部に過ぎません。


同じようなアプリケーションをお持ちですか?

フレッティング摩耗試験 トライボロジー

フレッティング摩耗評価

フレッティング摩耗評価

航空機のフレッティング摩耗評価

著者

Duanjie Li, PhD

によって改訂されました。

Jocelyn Esparza

鉱業・冶金におけるフレッチング摩耗の評価

はじめに

フレッティングとは、"負荷がかかり、振動や何らかの力によって微小な相対運動をする2つの材料の接触部に発生する特殊な摩耗現象 "である。機械が稼働しているとき、ボルトやピンで固定されている接合部、動くことを意図していない部品間、振動するカップリングやベアリングなどでは、必然的に振動が発生する。このような相対的な摺動運動の振幅は、マイクロメートルからミリメートルのオーダーであることが多い。このような低振幅の運動の繰り返しは、表面における深刻な局所的機械摩耗や物質移動を引き起こし、生産効率や機械性能の低下、あるいは機械の破損につながる可能性がある。

定量性の重要性
フレッティング摩耗評価

フレッチング摩耗には、二体摩耗、凝着、フレッチング疲労摩耗など、接触面で発生するいくつかの複雑な摩耗メカニズムが関与することがよくあります。フレッチング摩耗のメカニズムを理解し、フレッチング摩耗保護に最適な材料を選択するには、信頼性の高い定量的なフレッチング摩耗評価が必要です。フレッチング摩耗挙動は、変位振幅、垂直荷重、腐食、温度、湿度、潤滑などの作業環境に大きく影響されます。多用途な トライボメータ さまざまな現実的な作業条件をシミュレートできるこのツールは、フレッチング摩耗の評価に最適です。

Steven R. Lampman, ASMハンドブック:第19巻:疲労と破壊
http://www.machinerylubrication.com/Read/693/fretting-wear

測定目的

本研究では,ステンレス鋼SS304のフレッティング摩耗挙動を異なる振動速度と温度で評価し,その能力を明らかにした。 ナノベア T50 トライボメータは、金属のフレッティング摩耗プロセスを適切に制御・監視してシミュレートすることができます。

ナノビア

T50

試験条件

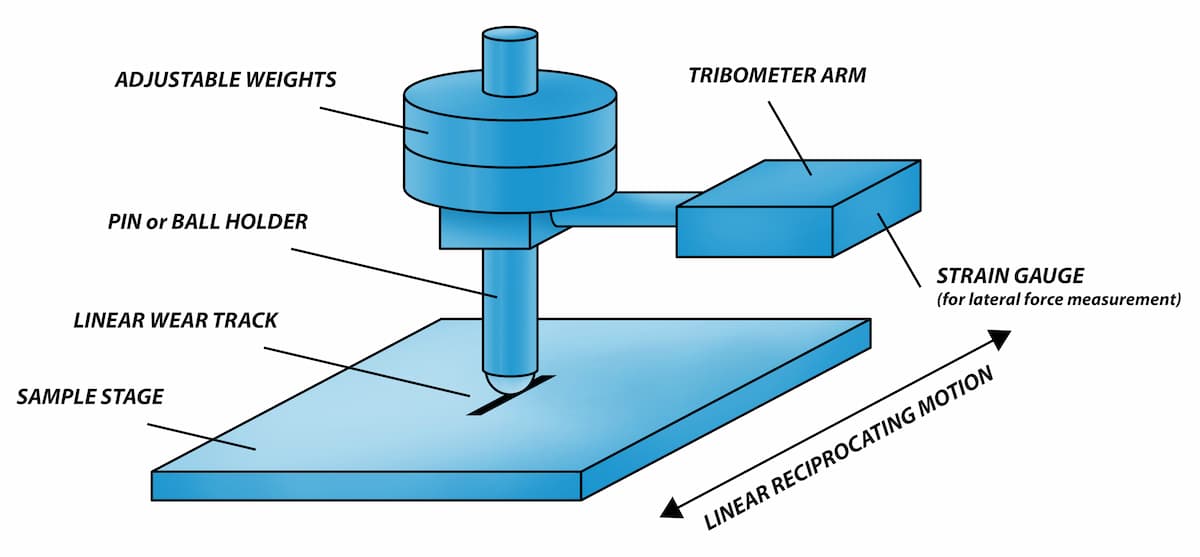
ステンレス鋼SS304サンプルの耐フレッティング摩耗性を、以下の方法で評価した。 ナノビア 直線往復運動式摩耗モジュールを使用したトライボメータ。対向材としてWC(直径6mm)ボールを使用しました。を使用して摩耗痕を調べた。 ナノビア 3D非接触プロファイラー。 

フレッティングテストは、室温(RT)、200 °Cで行い,SS304試料の耐フレッティング摩耗性に及ぼす高温の影響を検討した。試料ステージに設置した加熱板により、フレッティング試験中の試料を200℃に加熱した。 °C.摩耗率のことです。 Kの式で評価した。 K=V/(F×s)で、ここで V は摩耗量です。 F は法線荷重であり s は滑走距離である。

なお、今回の研究では、カウンター材としてWCボールを例として使用した。形状や表面仕上げの異なるあらゆる固体材料を、カスタムフィクスチャを使用して実際の適用状況をシミュレートすることができます。

テストパラメーター

摩耗計測の

結果・考察

によって算出された摩耗痕の体積損失を、3D摩耗痕プロファイルによって直接かつ正確に把握することができます。 ナノビア 山地解析ソフト。 

低速100rpm、室温での往復摩耗試験では、0.014mmという小さな摩耗痕を示した³.一方、1000rpmの高速回転で行ったフレッティング摩耗試験では、0.12mmというかなり大きな摩耗痕が形成されています。³.このような加速摩耗は,フレッティング摩耗試験で発生する高熱と激しい振動が金属片の酸化を促進し,激しい3体摩耗をもたらすことに起因すると考えられる。200℃の高温環境下でのフレッティング摩耗試験で,金属破片の酸化が促進され,3体摩耗が激しくなった。 °Cは0.27mmと大きめの摩耗痕を形成する³.

1000rpmでのフレッティング摩耗試験で、摩耗量は1.5×10⁻⁴ ミリメートル³/Nmとなり,100rpmでの往復摩耗試験と比較して約9倍となった。また,高温でのフレッチング摩耗試験では,摩耗速度がさらに加速され,3.4×10-4 ミリメートル³/Nmとなりました。異なる速度と温度で測定された耐摩耗性にこのような大きな差があることは、現実的なアプリケーションのためのフレッティング摩耗の適切なシミュレーションの重要性を示しています。

トライボシステムにわずかな試験条件の変更を加えると、摩耗挙動が大きく変化することがあります。の汎用性 ナノビア トライボメータは、高温、潤滑、腐食など、さまざまな条件下での摩耗を測定することができます。また、モーターによる正確な速度・位置制御により、0.001~5000rpmの範囲で摩耗試験を行うことができ、研究・試験室において、さまざまなトライボロジー条件下でのフレッティング摩耗を調査するための理想的なツールとなっています。

様々な条件下でのフレッティング摩耗痕

光学顕微鏡下

光学顕微鏡による様々な条件下でのフレッティング摩耗痕の観察

3Dウェアトラックプロファイル

基礎的な理解を深めることができる
フレッティング摩耗機構の

3D摩耗痕プロファイル - フレッティング

結果まとめ

異なるテストパラメータを使用して測定

まとめ

この研究では、その能力を披露した。 ナノビア ステンレス鋼SS304試料のフレッティング摩耗挙動を良好に制御し、定量的に評価するためのトライボメータ。 

試験速度と温度は、材料の耐フレッティング摩耗性に重要な役割を果たします。フレッティング中の高熱と激しい振動により、SS304サンプルの摩耗は9倍近くまで大幅に加速されました。200℃の高温 °Cでさらに磨耗率が3.4×10⁻⁴ ミリメートル3/Nmです。 

の多用途性 ナノビア トライボメータは、高温、潤滑、腐食など様々な条件下でのフレッティング摩耗の測定に最適なツールです。

ナノビア トライボメータは、ISOやASTMに準拠した回転・直動モードによる精密で再現性の高い摩耗・摩擦試験と、オプションで高温摩耗、潤滑、トライボコロージョンを1つのシステムに統合して提供することが可能です。当社の比類なき製品群は、薄手・厚手、軟質・硬質のコーティング、フィルム、基材など、あらゆる種類のトライボロジー特性を測定するための理想的なソリューションです。

同じようなアプリケーションをお持ちですか?