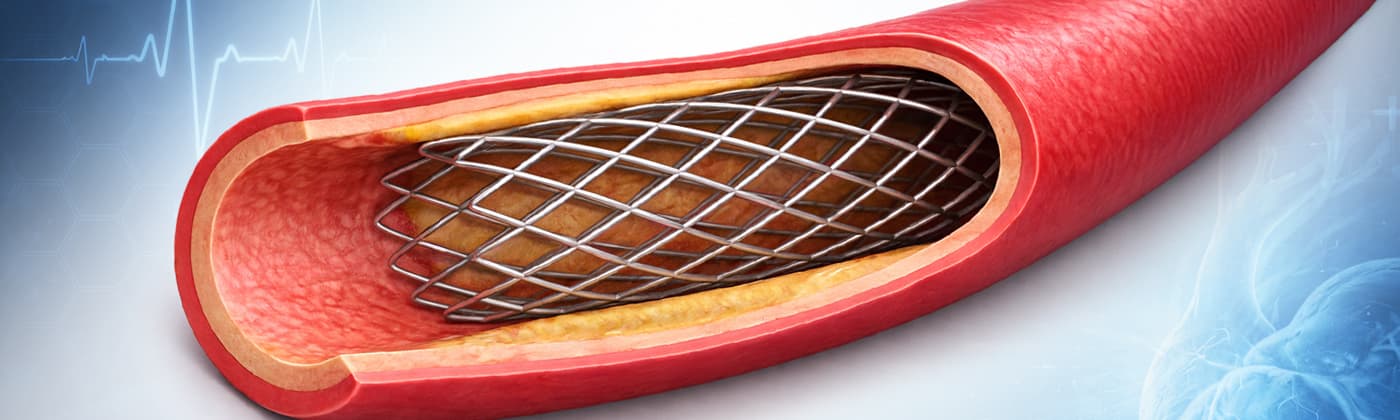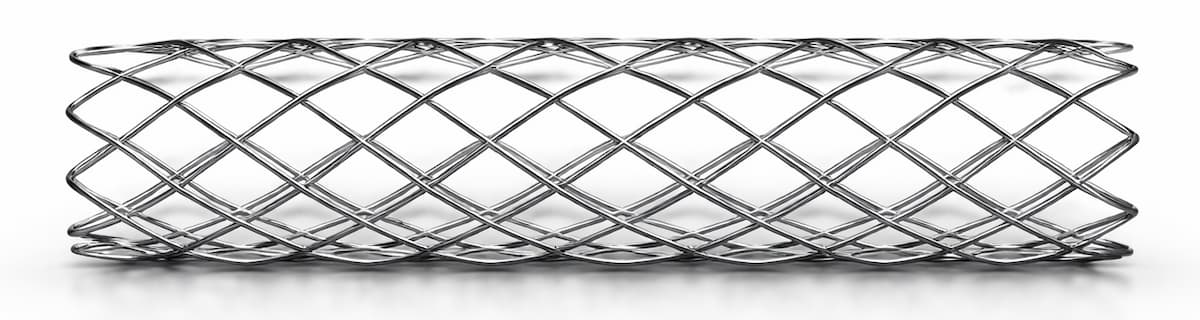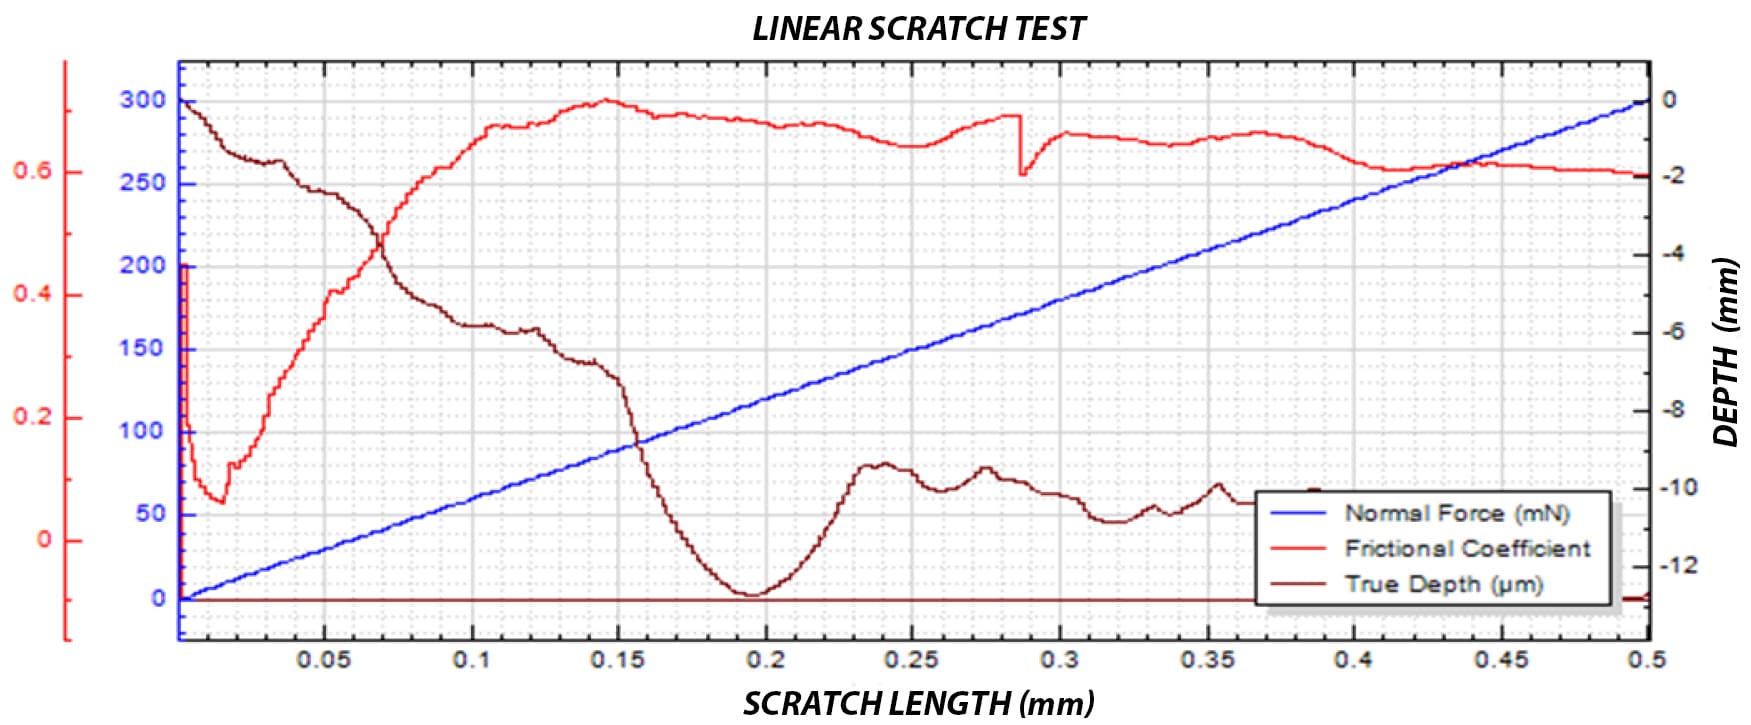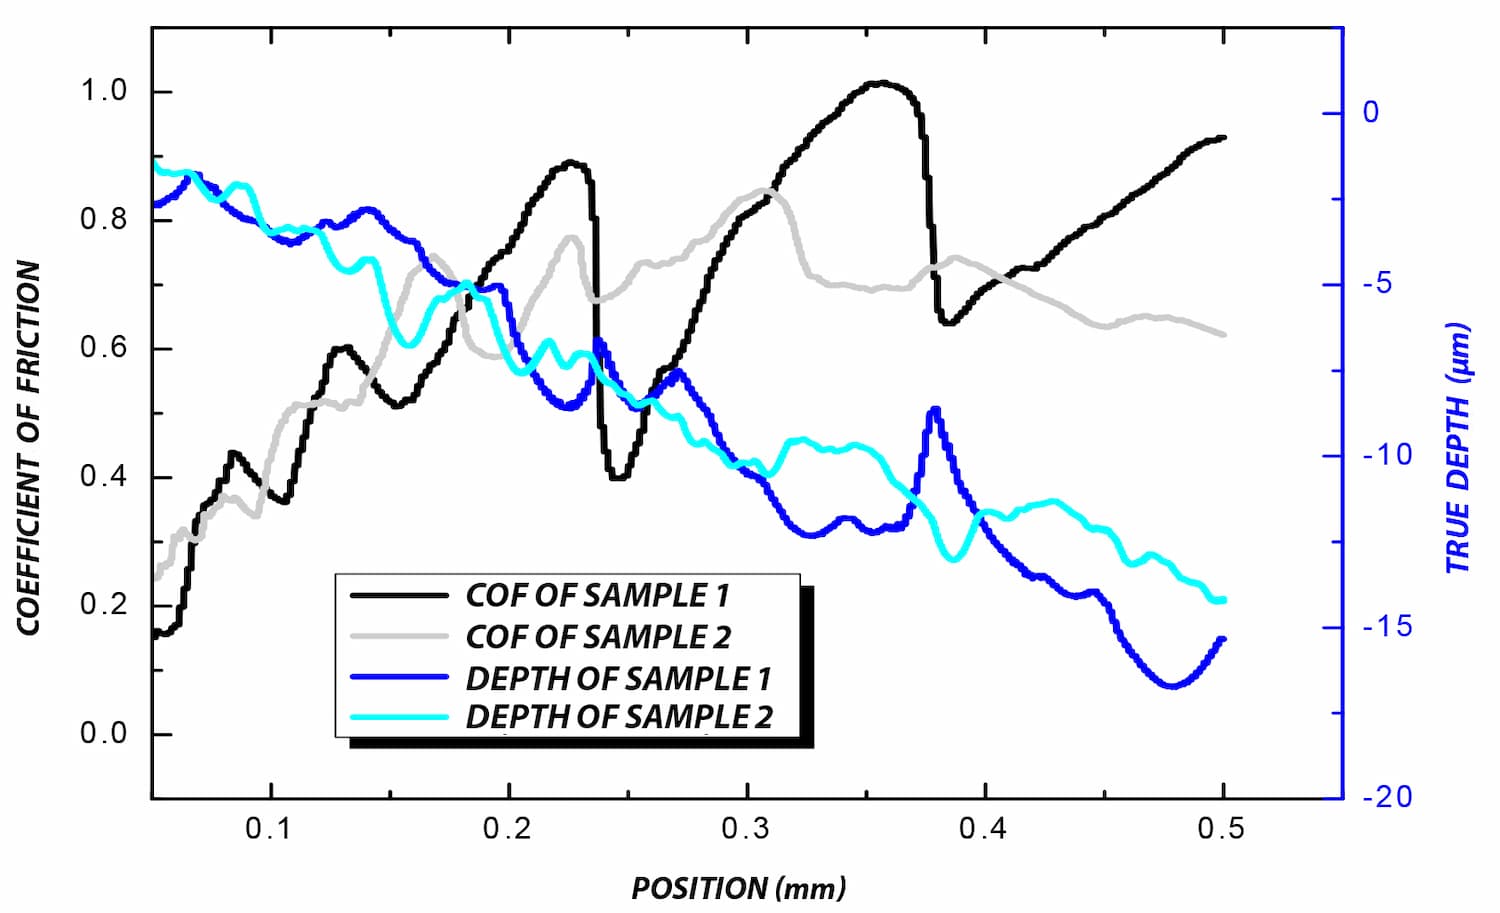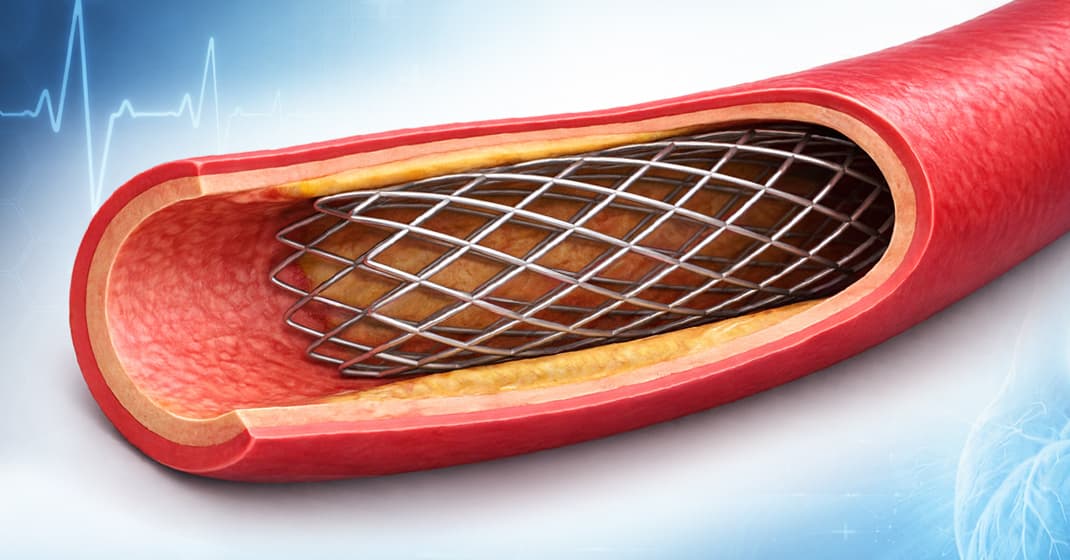
Stent Coating Adhesion and Delamination Analysis Using Nano Scratch Testing
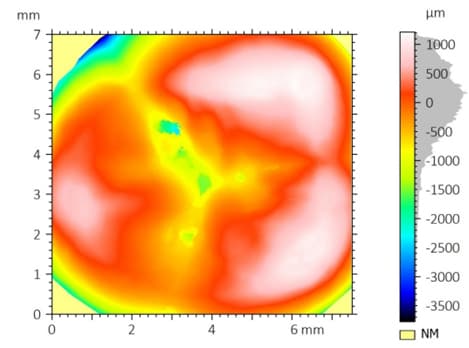
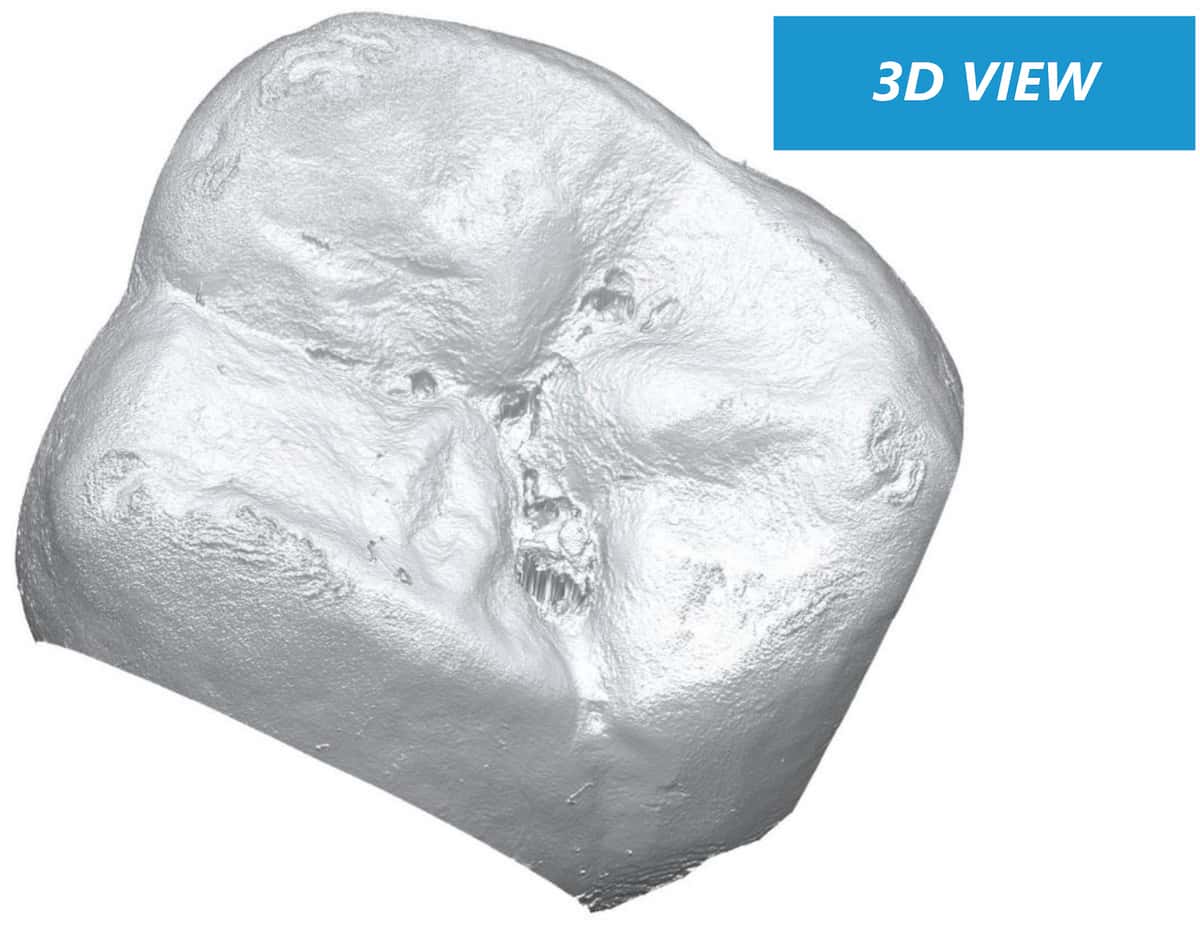
Dental Surface Roughness Measurement & 3D Tooth Topography

携帯電話スクリーン・プロテクターの耐傷性試験
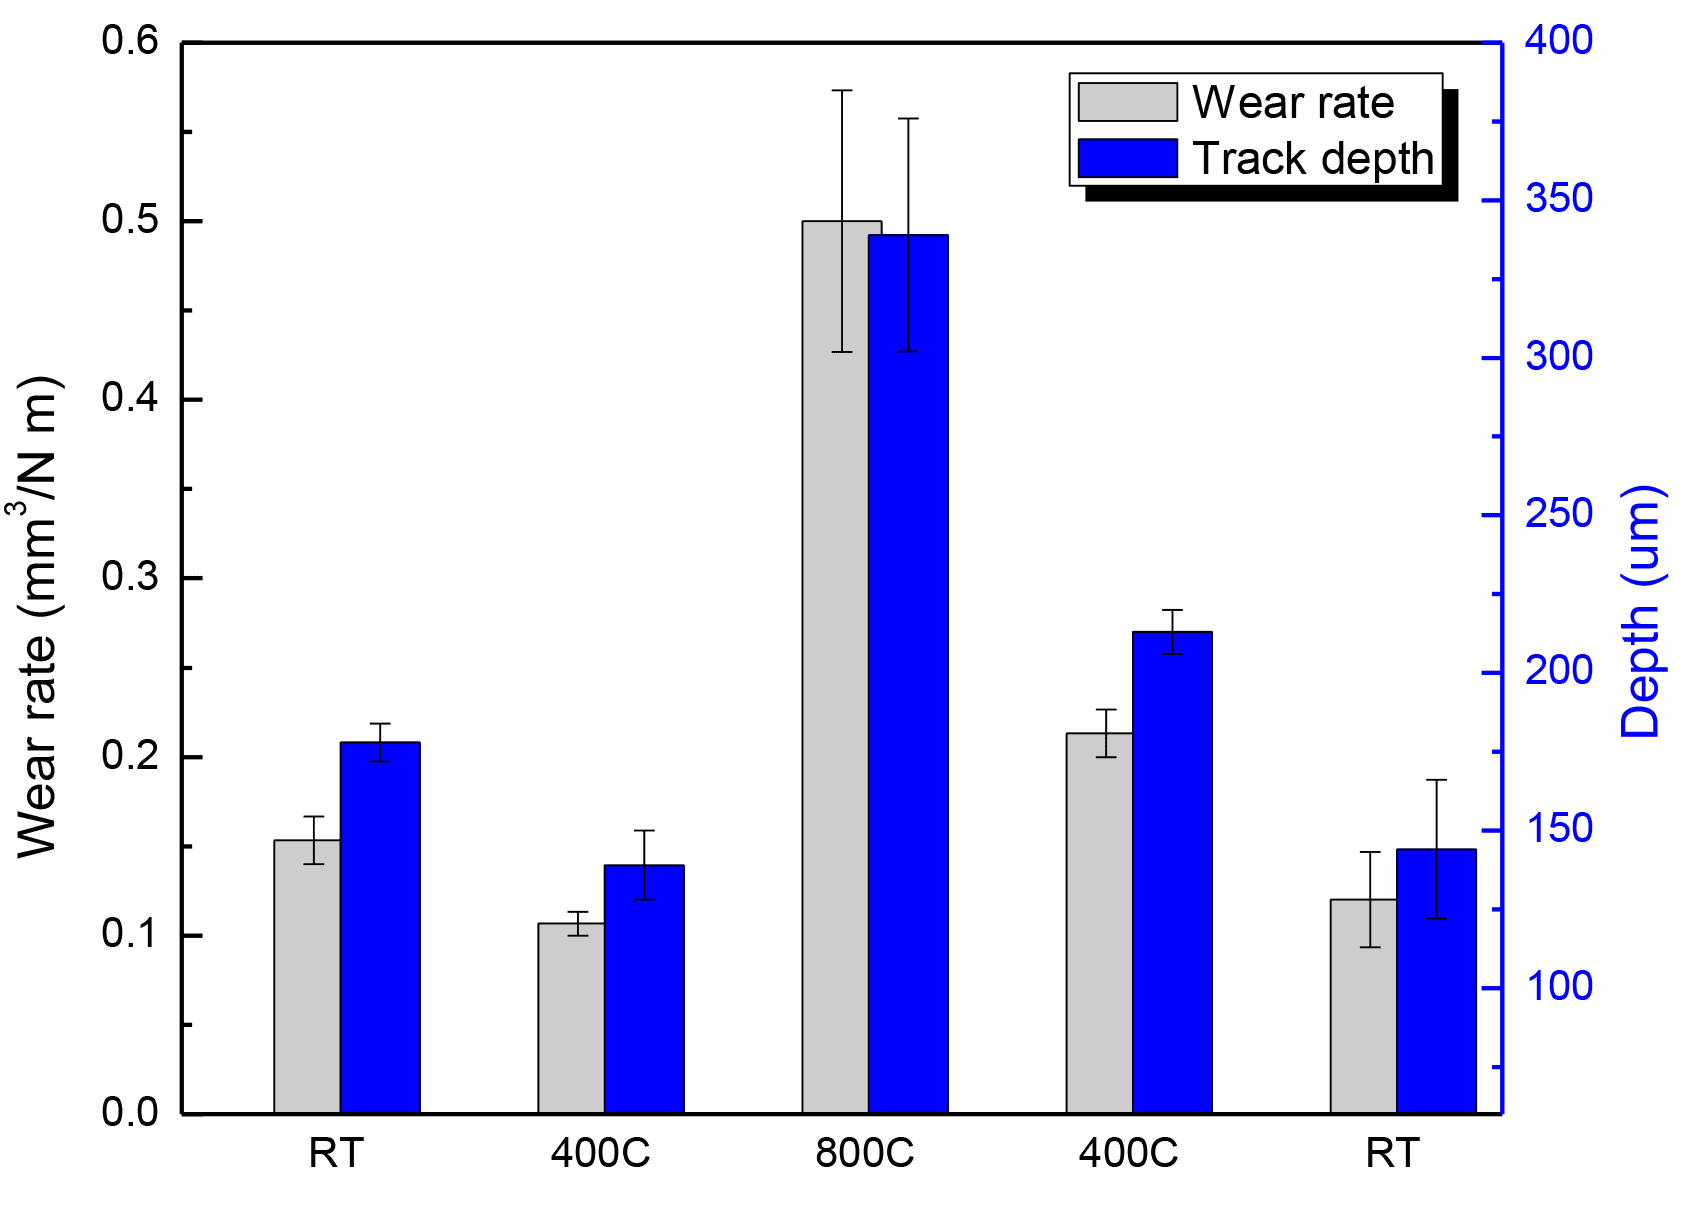
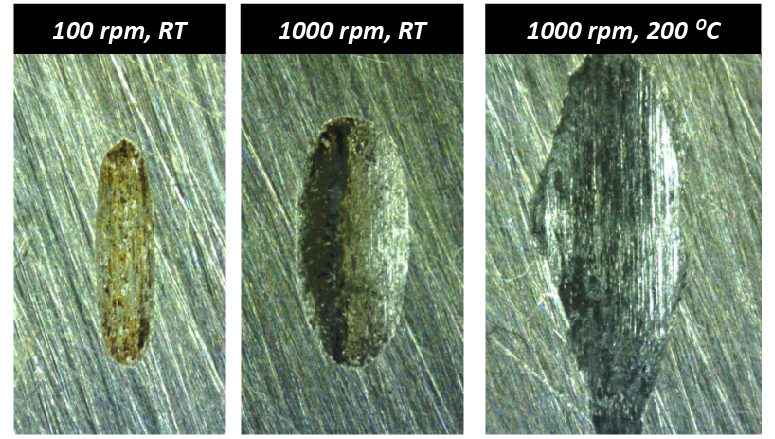
高温下での磨耗測定

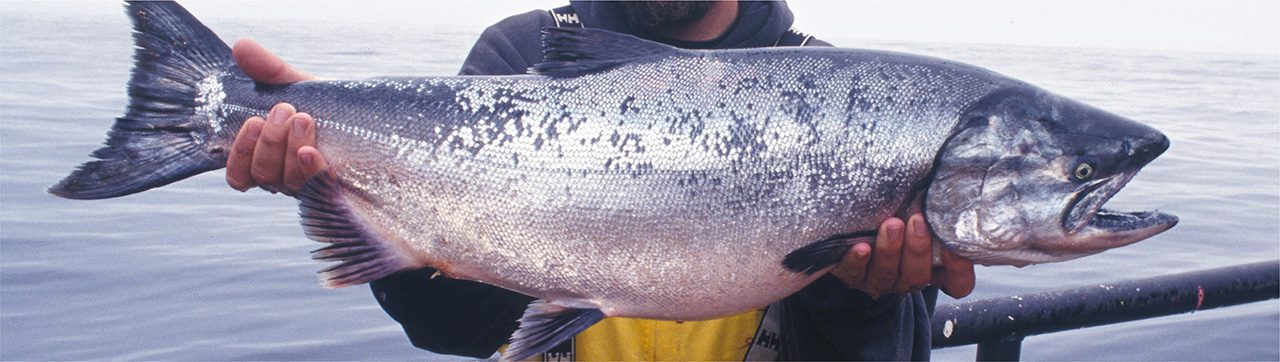
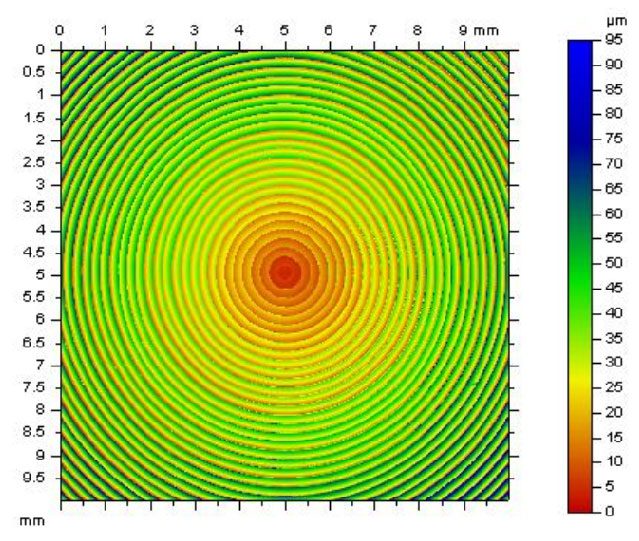
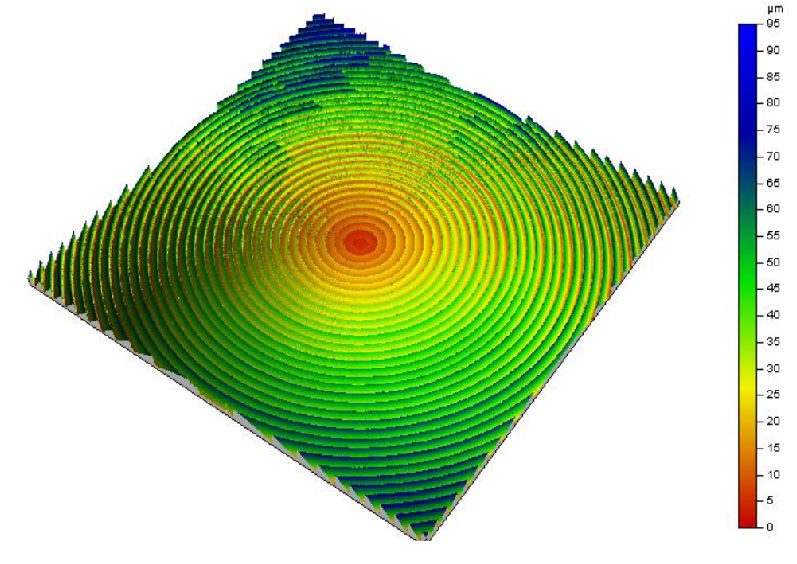
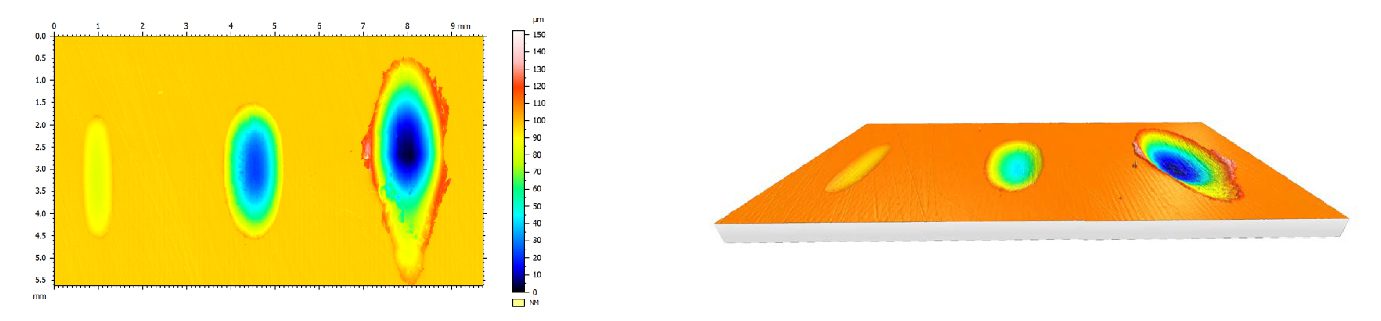
3D光学プロファイラによる魚鱗表面解析

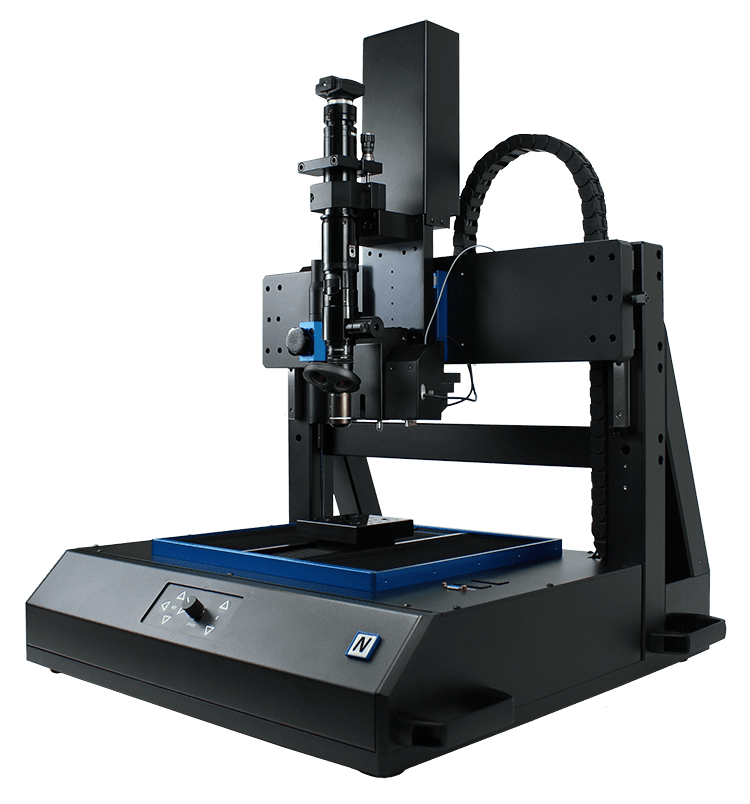
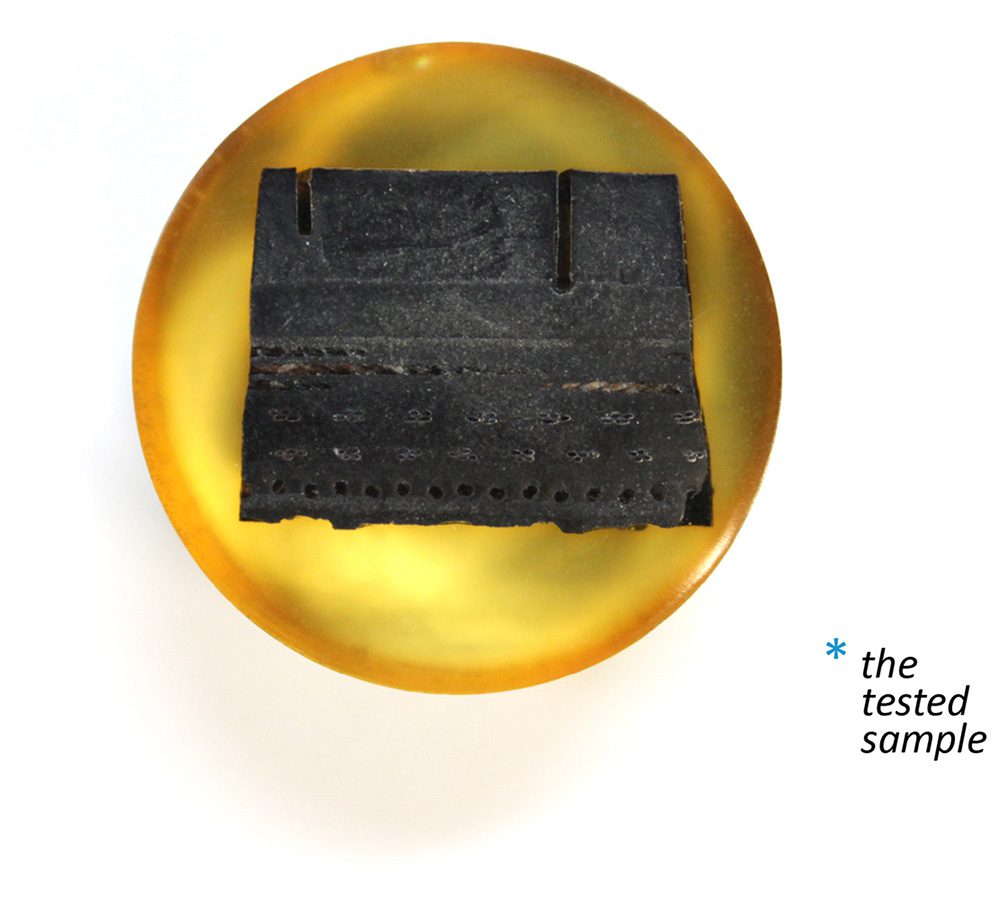
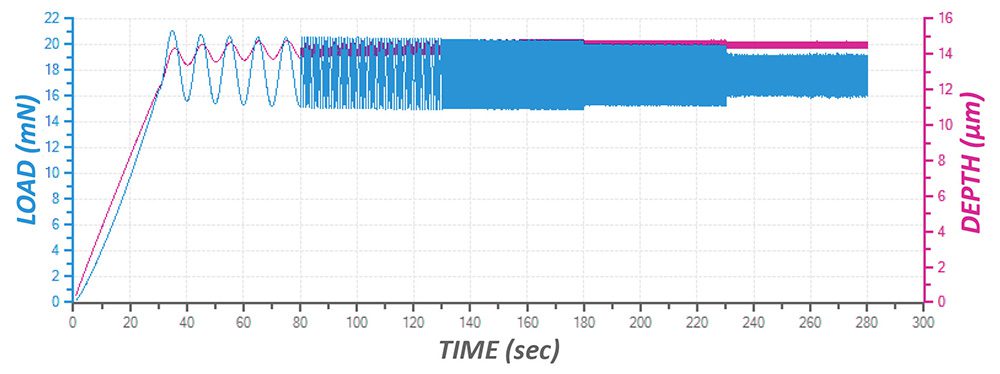
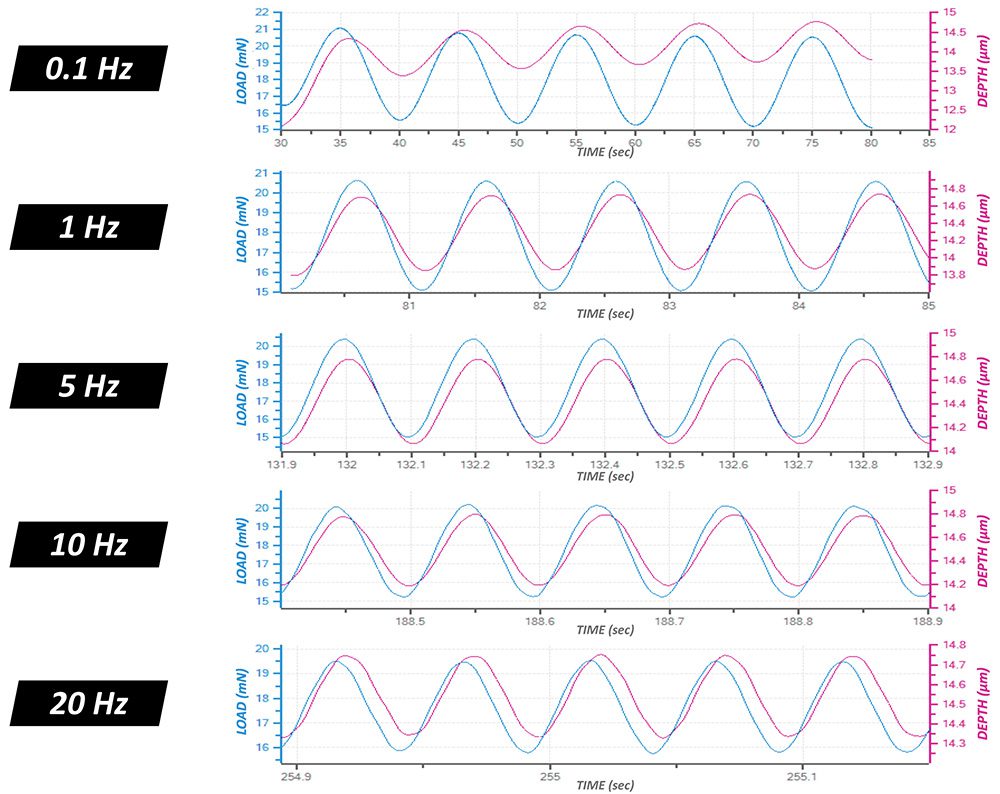
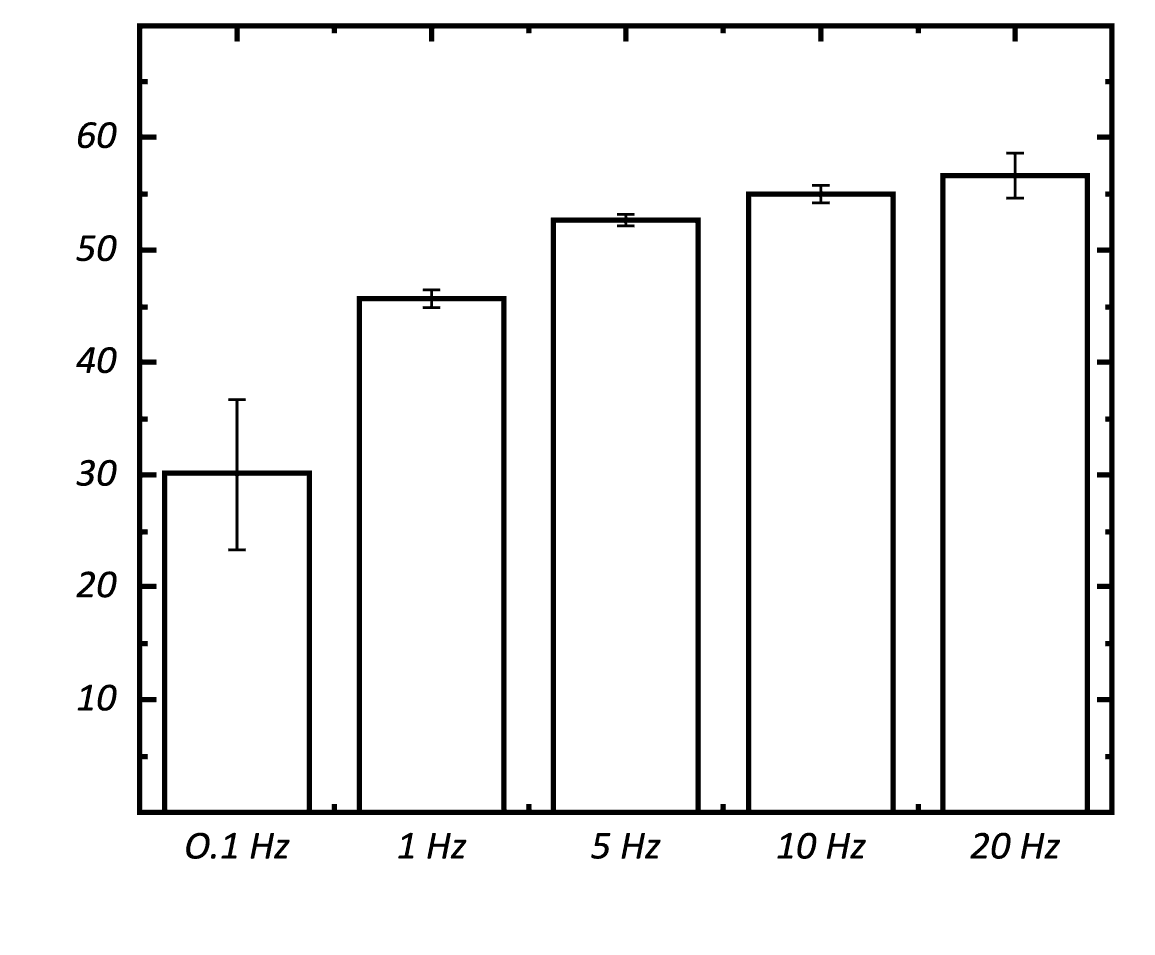
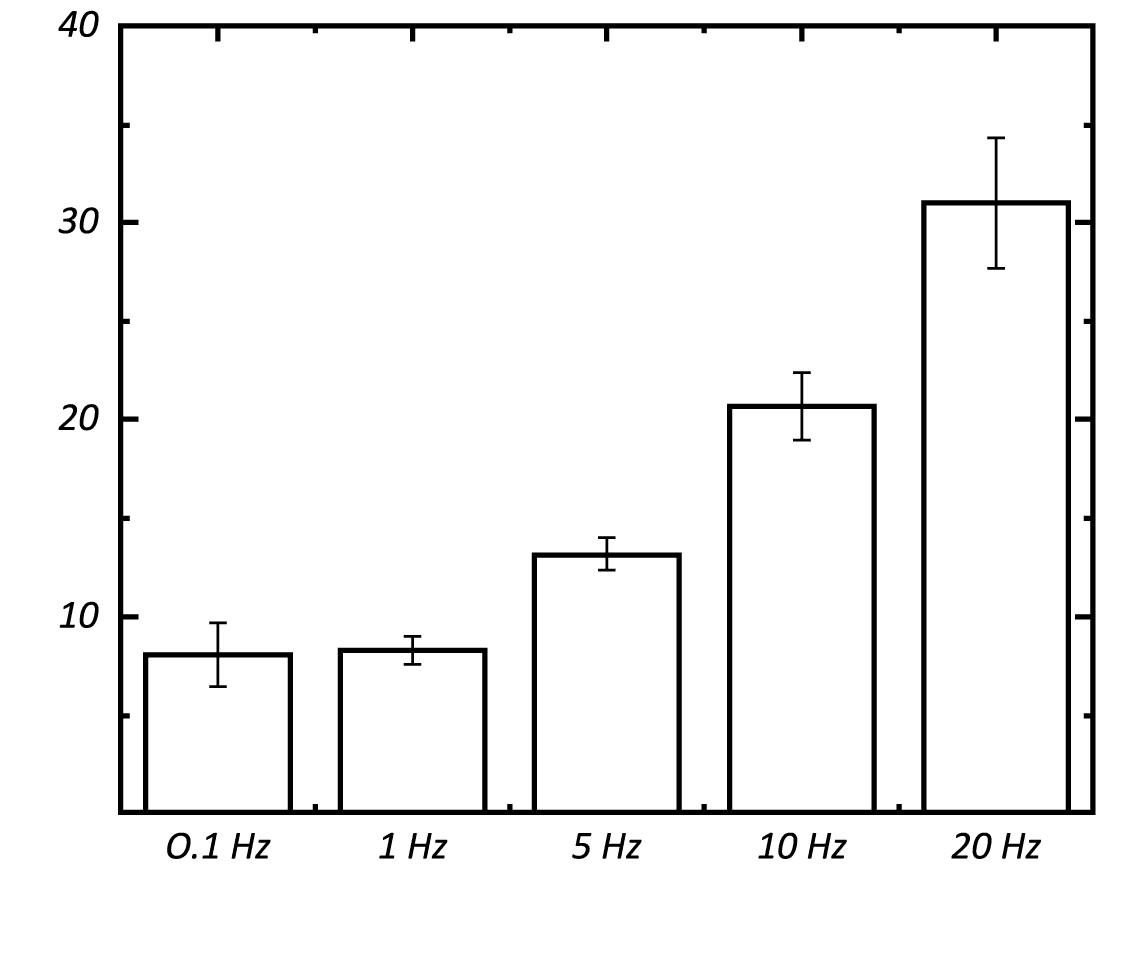
高分子材料の動的機械分析(DMA)周波数掃引

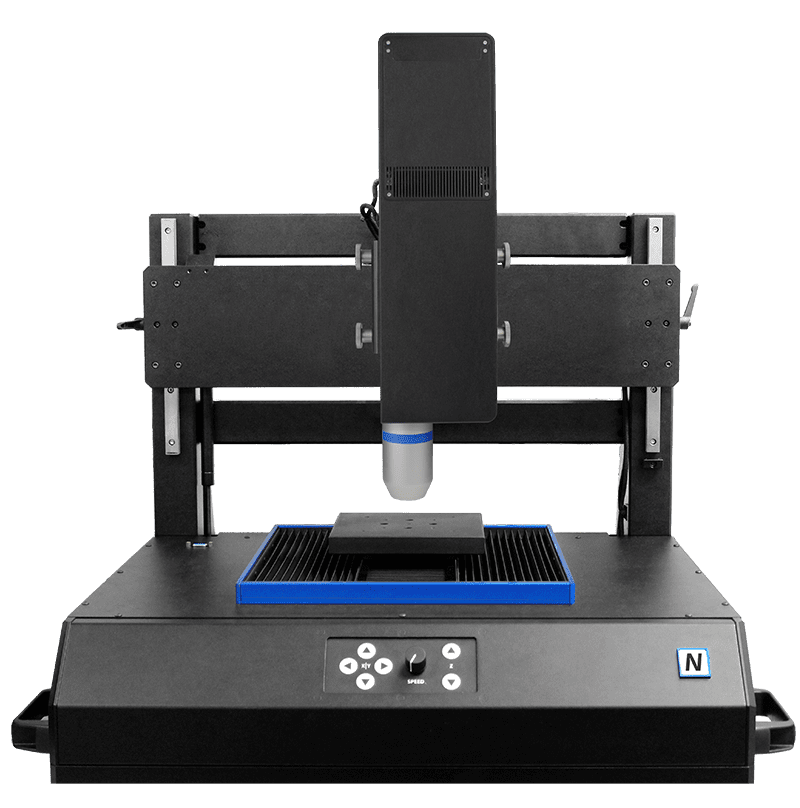
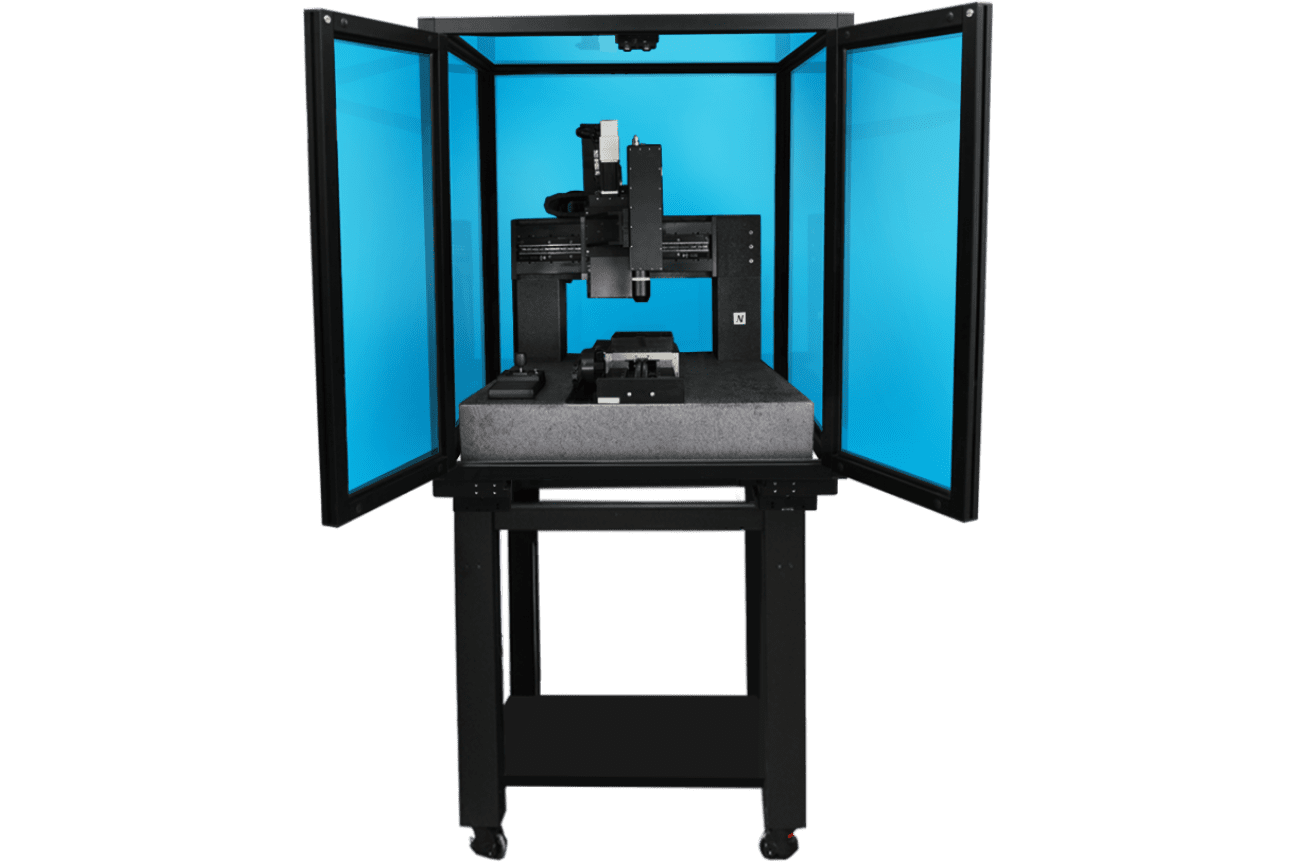
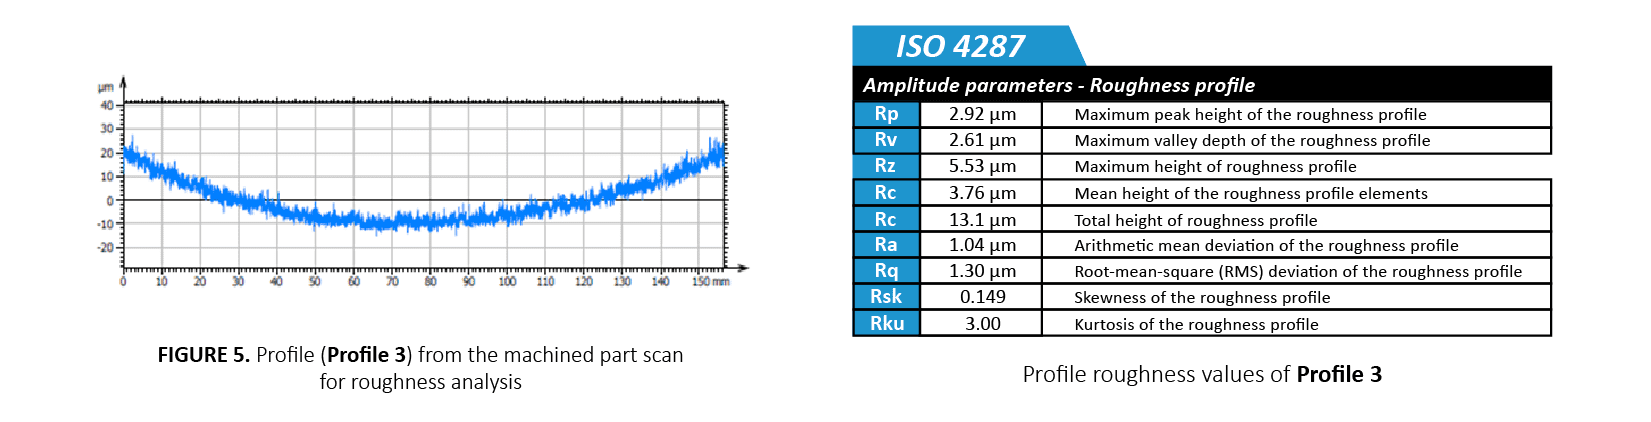
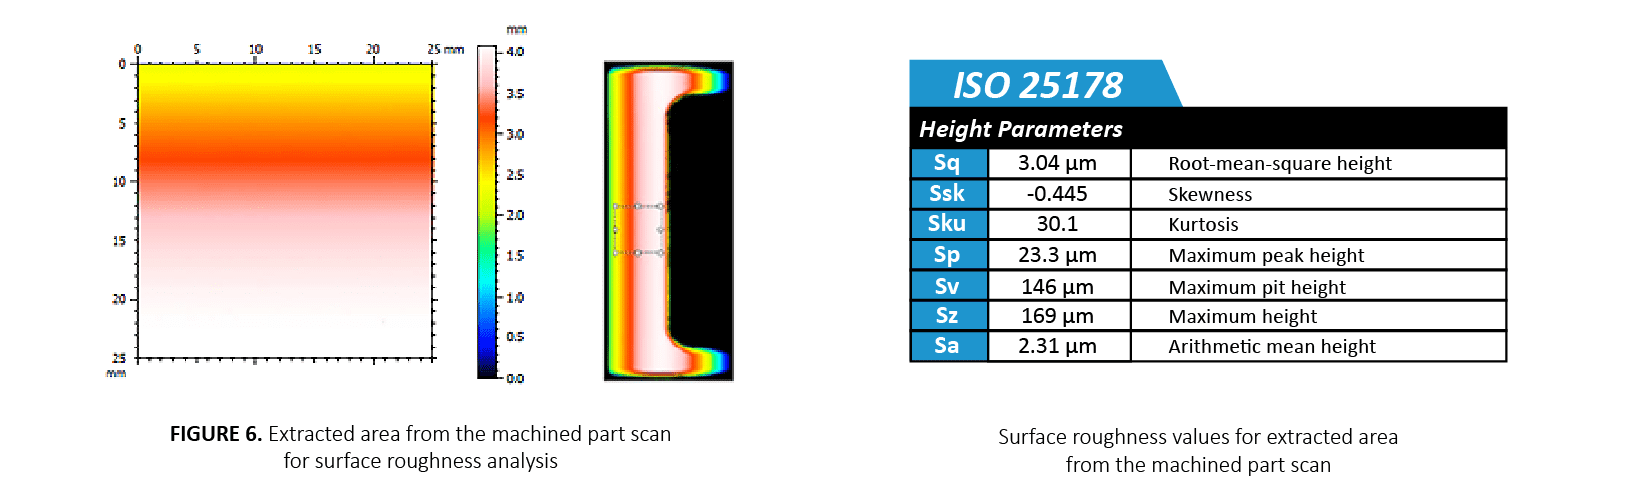
機械加工品検査
フレッティング摩耗評価
ボールベアリング: 高耐摩耗性の研究

はじめに
ボールベアリングはボールを使用して回転摩擦を軽減し、ラジアル荷重とアキシアル荷重を支えます。ベアリング レースの間でボールが転動することにより、2 つの平らな表面が互いに滑り合う場合に比べて、はるかに低い摩擦係数 (COF) が生成されます。ボールベアリングは、多くの場合、高い接触応力レベル、摩耗、高温などの極端な環境条件にさらされます。したがって、高負荷や極端な環境条件下でのボールの耐摩耗性は、ボール ベアリングの寿命を延ばし、修理や交換のコストと時間を削減するために重要です。
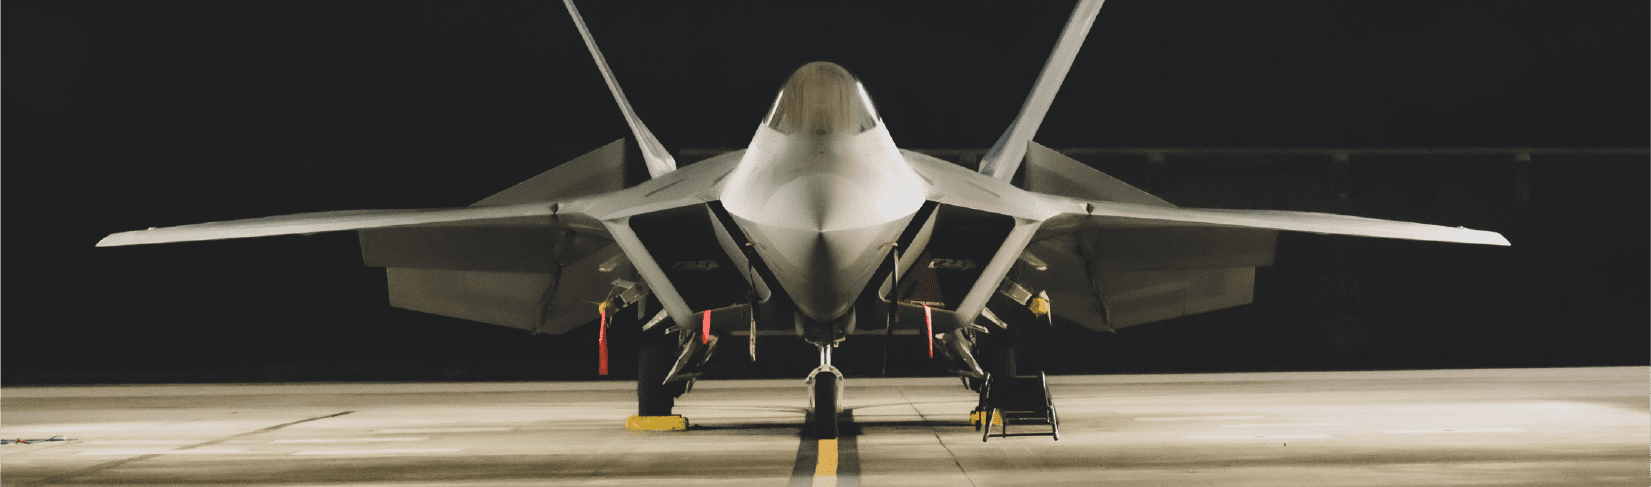
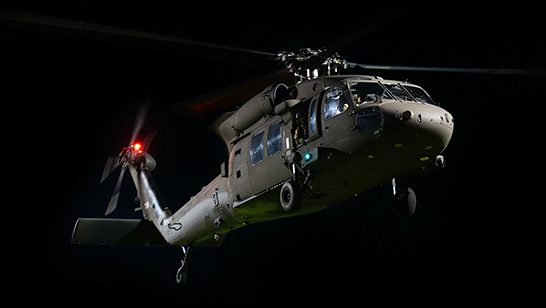
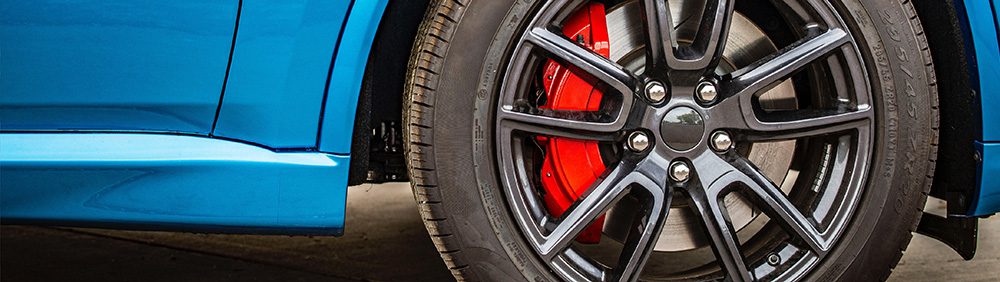
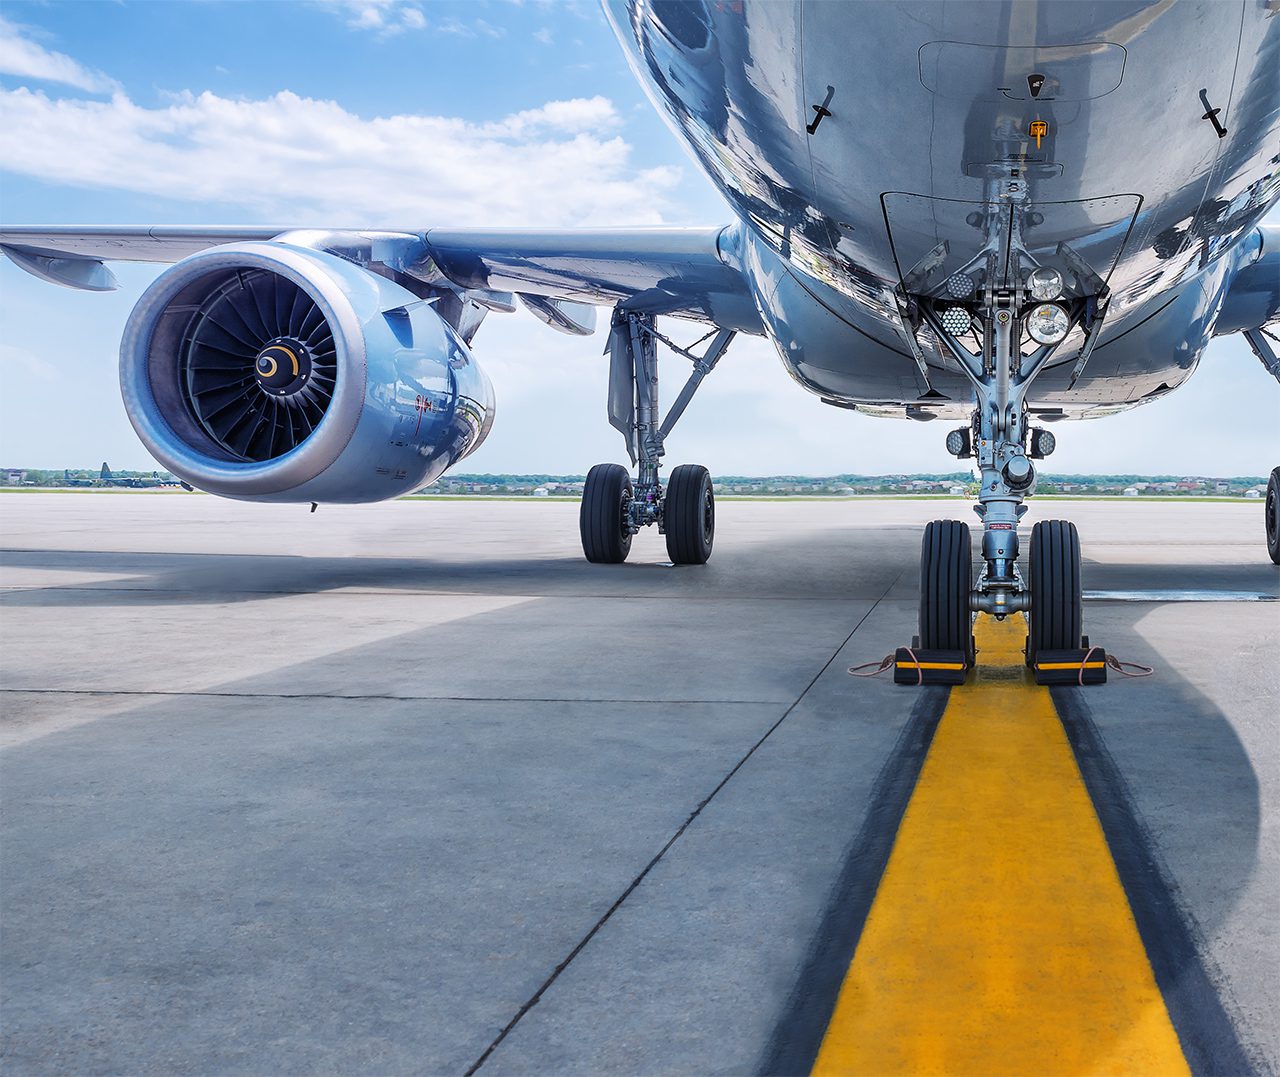
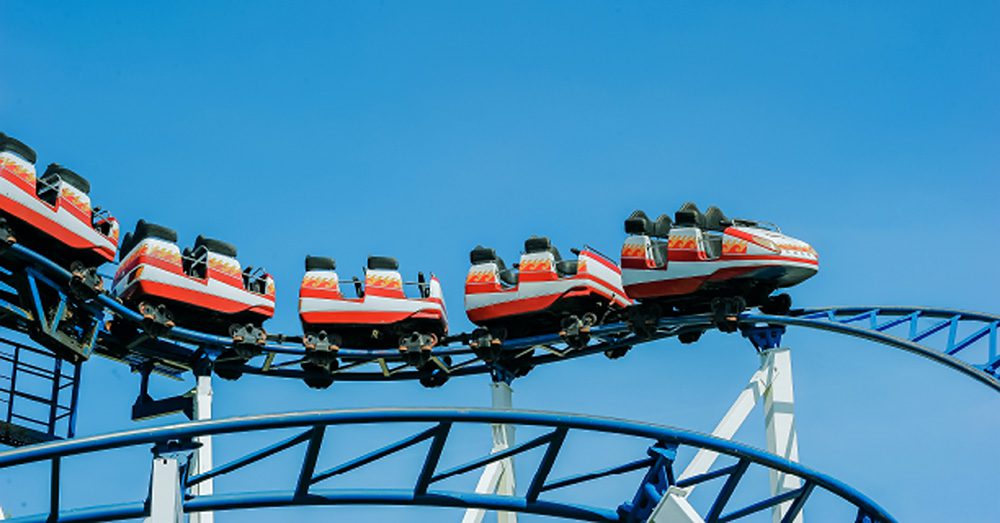
ボールベアリングは、可動部品を伴うほぼすべての用途に使用されています。これらは航空宇宙や自動車などの輸送産業やハンドスピナーやスケートボードなどの玩具産業でよく使用されています。
高負荷時のボールベアリングの摩耗評価
ボール ベアリングは、幅広い材料リストから作成できます。一般的に使用される材料は、ステンレス鋼やクロム鋼などの金属、または炭化タングステン (WC) や窒化ケイ素 (Si3n4) などのセラミックまで多岐にわたります。製造されたボール ベアリングが、特定の用途の条件に最適な必要な耐摩耗性を確実に備えていることを確認するには、高荷重下での信頼できるトライボロジー評価が必要です。トライボロジー試験は、制御および監視された方法でさまざまなボール ベアリングの摩耗挙動を定量化および対比し、対象用途に最適な候補を選択するのに役立ちます。
測定目的
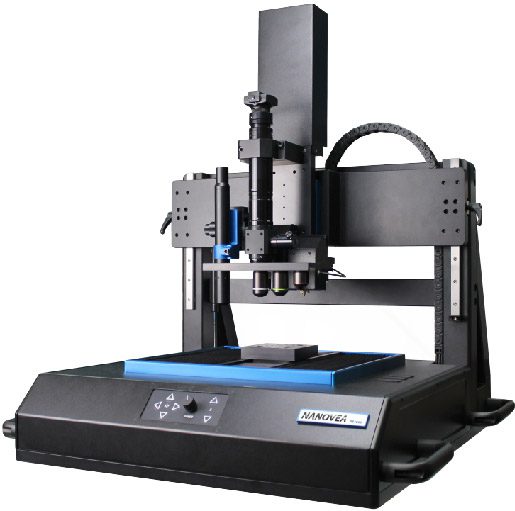
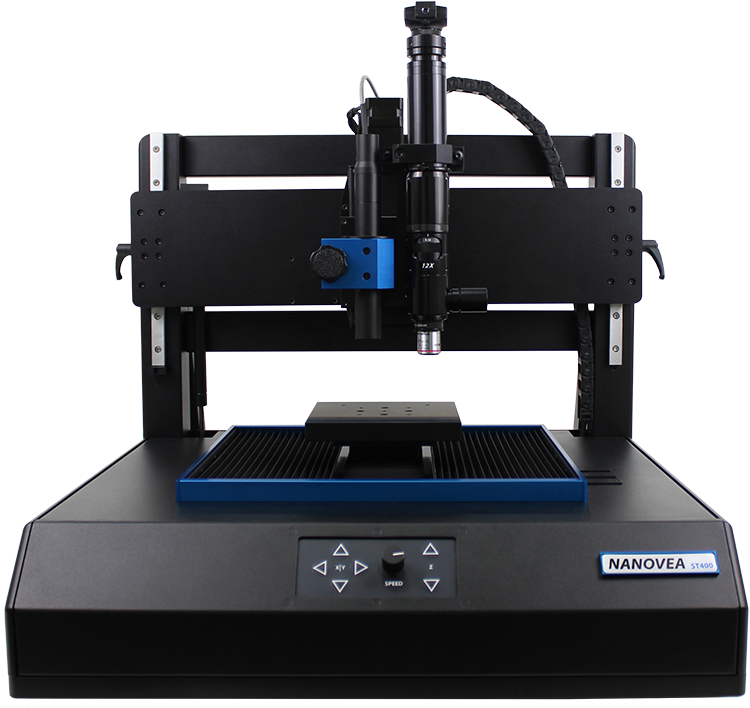
この研究では、Nanovea を紹介します。 トライボメータ 高荷重下でのさまざまなボールベアリングの耐摩耗性を比較するための理想的なツールです。

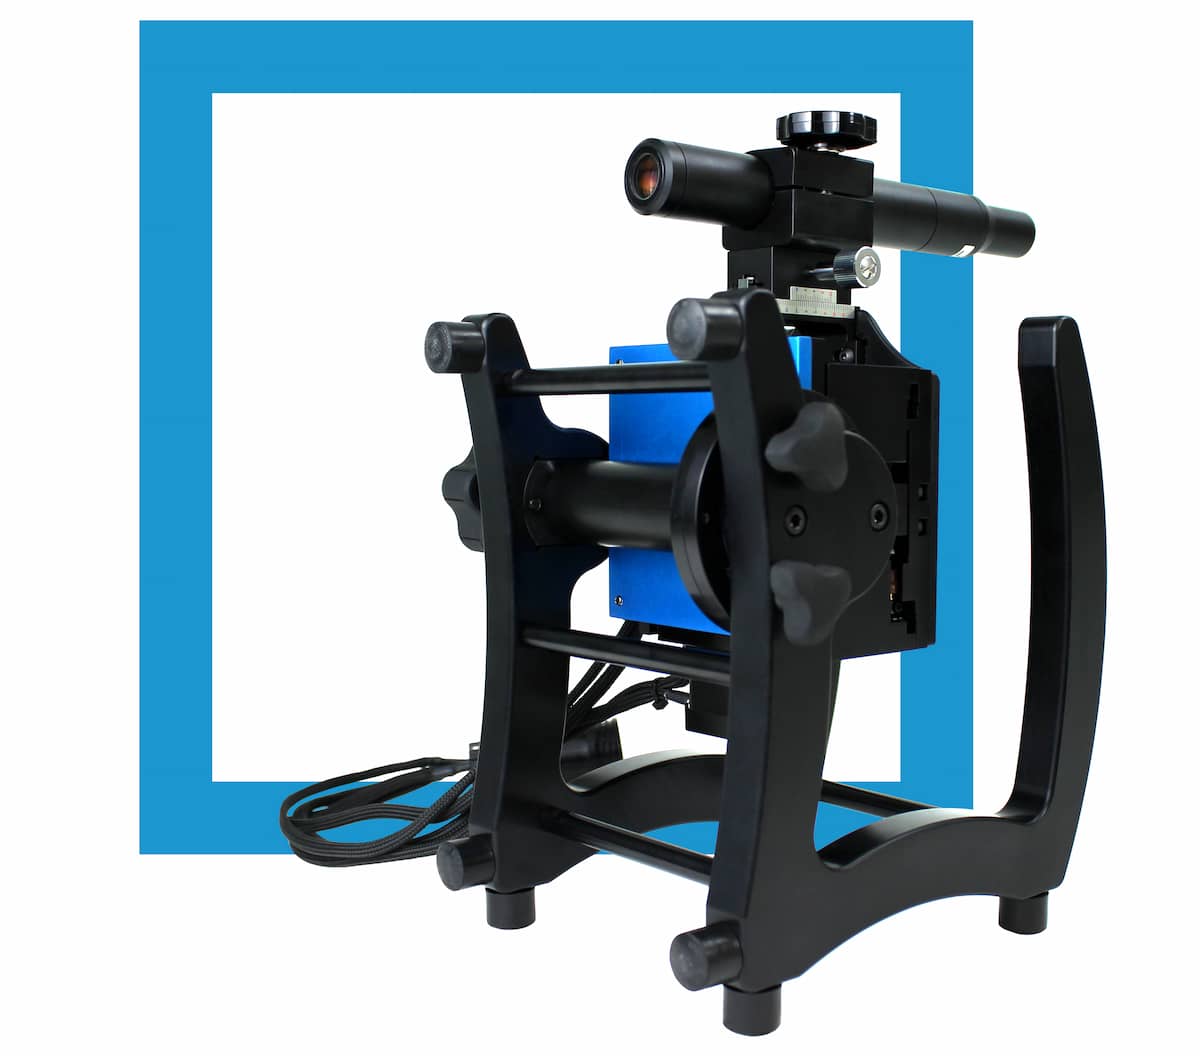
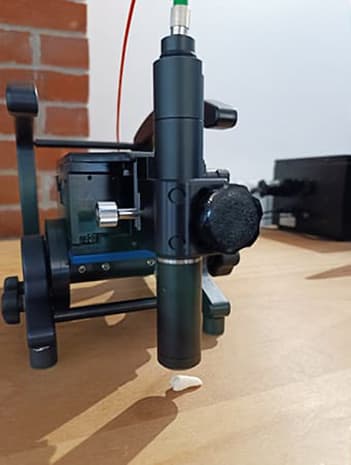
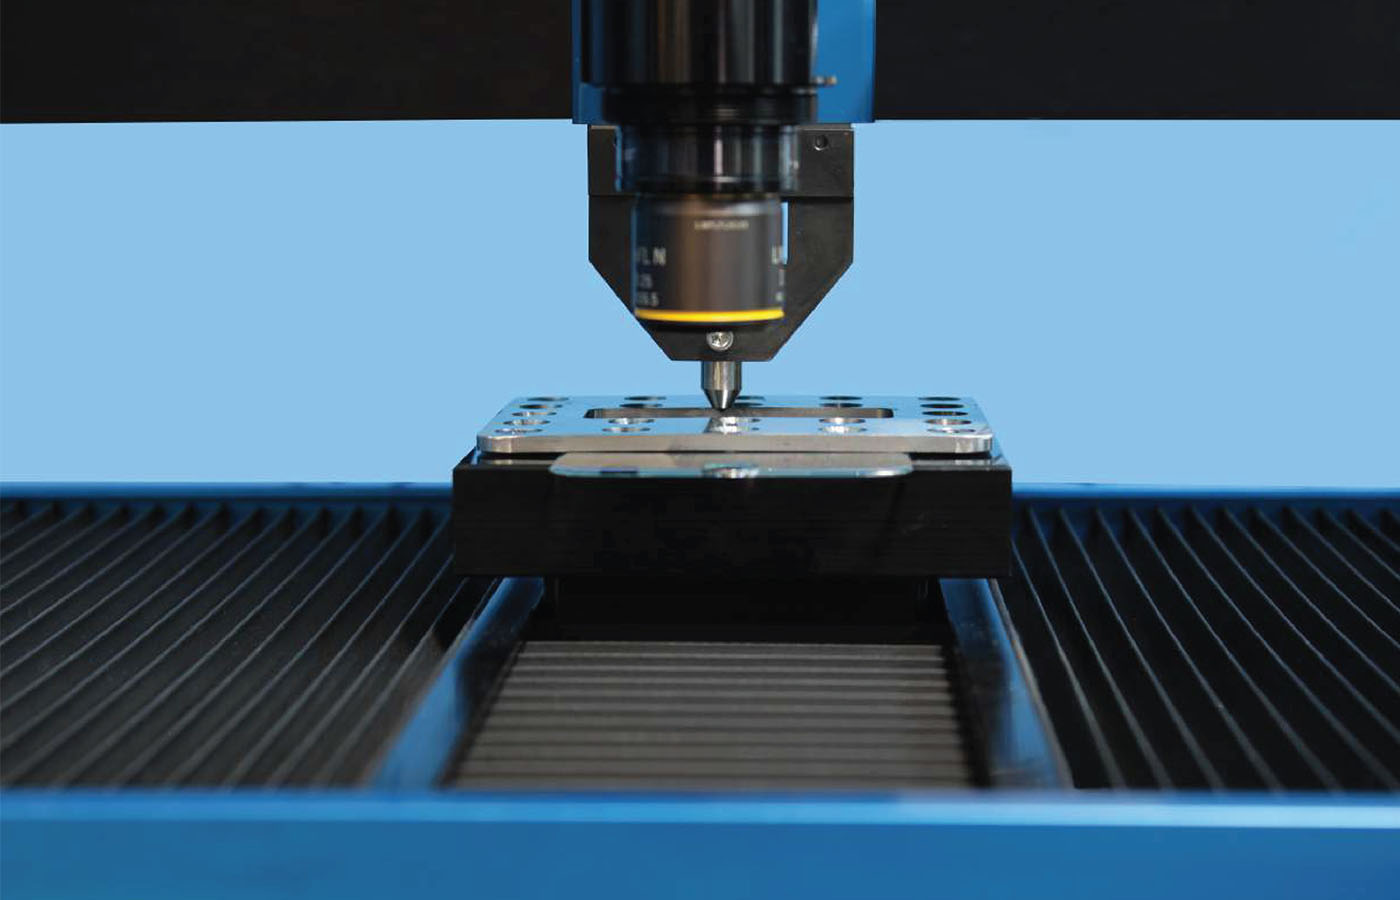
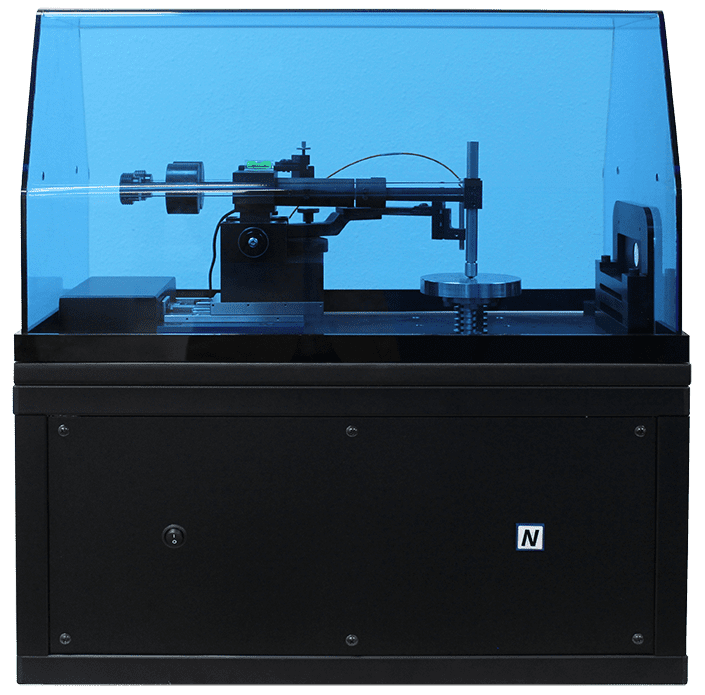
図 1: 軸受試験のセットアップ。
試験手順
異なる材質のボールベアリングの摩擦係数、COF、耐摩耗性をNanoveaトライボメーターで評価しました。カウンター材としてP100グリットのサンドペーパーを使用した。ボールベアリングの摩耗痕を検査しました。 ナノベーア 摩耗テスト終了後の 3D 非接触プロファイラー。テストパラメータを表 1 にまとめます。摩耗率、 Kの式で評価した。 K=V/(F×s)で、ここで V は摩耗量です。 F は法線荷重であり s 滑る距離です。ボール摩耗傷は次の方法で評価されました。 ナノベーア 3D 非接触プロファイラーにより、正確な摩耗量測定を実現します。
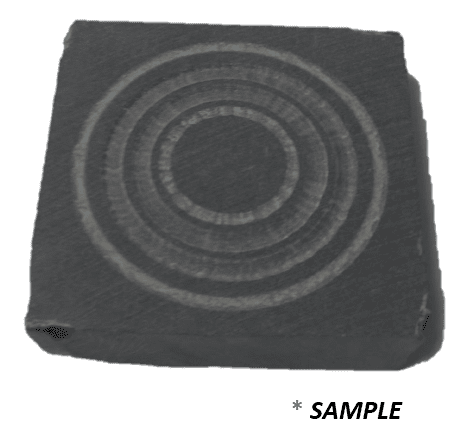
自動化された電動ラジアル位置決め機能により、トライボメータはテスト中に摩耗トラックの半径を減少させることができます。このテスト モードはスパイラル テストと呼ばれ、ボール ベアリングが常にサンドペーパーの新しい表面上で滑ることを確認します (図 2)。ボールの耐摩耗性テストの再現性が大幅に向上します。内部速度制御用の高度な 20 ビット エンコーダと外部位置制御用の 16 ビット エンコーダは、正確なリアルタイムの速度と位置情報を提供し、回転速度を継続的に調整して接触部での一定の線形スライド速度を実現します。
この研究では、さまざまなボール素材間の摩耗挙動を簡略化するために P100 グリットのサンドペーパーが使用されており、他の素材の表面で置き換えることができることに注意してください。液体や潤滑剤などの実際の用途条件下で、さまざまな材料カップリングの性能をシミュレートするために、任意の固体材料を置き換えることができます。
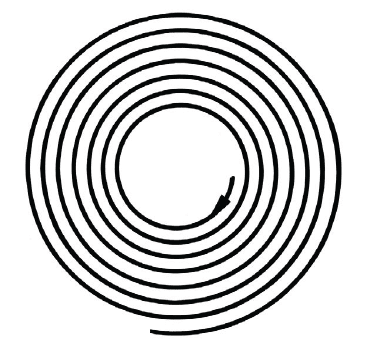
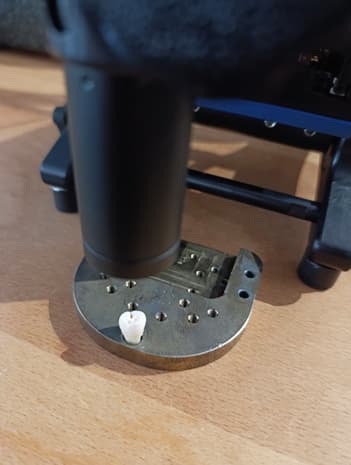
図 2: サンドペーパー上のボール ベアリングのスパイラル パスの図。
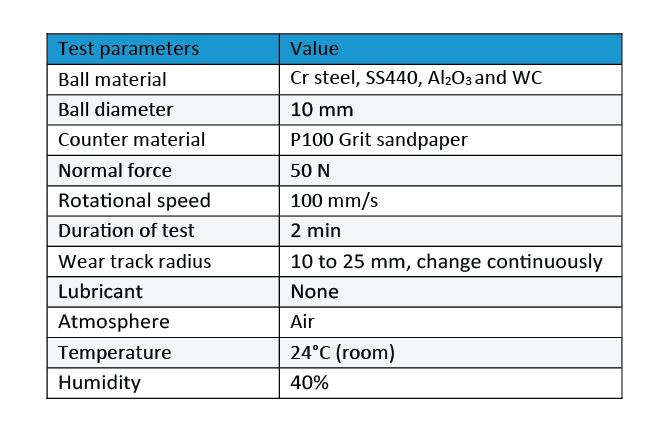
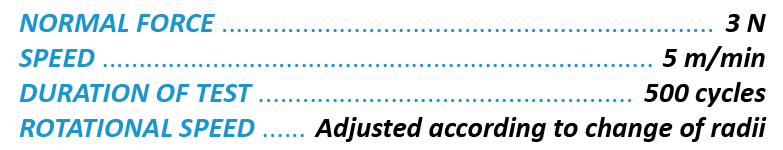
表 1: 摩耗測定のテストパラメータ。
結果・考察
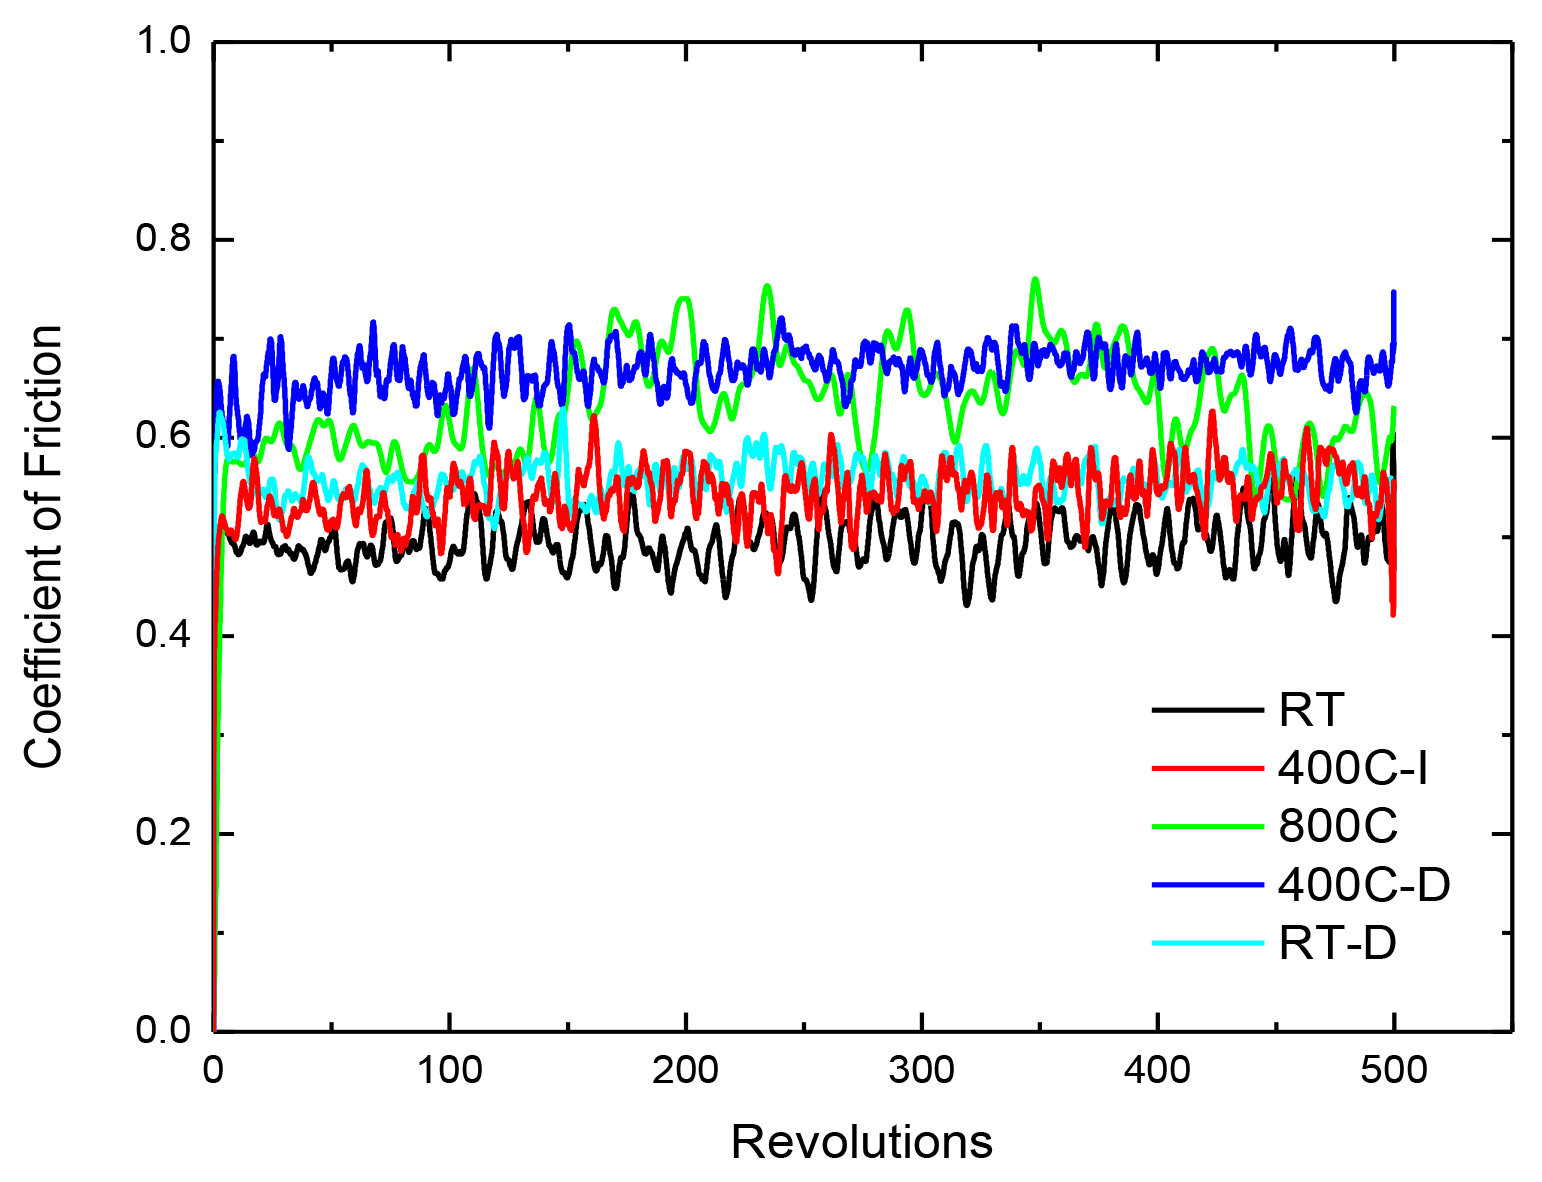
摩耗率はボール ベアリングの耐用年数を決定する重要な要素ですが、ベアリングの性能と効率を向上させるには COF が低いことが望ましいです。図 3 は、テスト中のさまざまなボール ベアリングの COF の変化をサンドペーパーと比較したものです。 SS440 および Al2O3 ボール ベアリングの COF が ~0.32 および ~0.28 であるのに対し、Cr 鋼ボールは摩耗テスト中に COF が ~0.4 増加しました。一方、WC ボールは摩耗テスト全体を通じて約 0.2 の一定の COF を示します。各テストを通じて観察可能な COF の変動が見られますが、これは粗いサンドペーパーの表面に対するボール ベアリングの滑り運動によって引き起こされる振動に起因すると考えられます。

図 3: 摩耗テスト中の COF の変化。
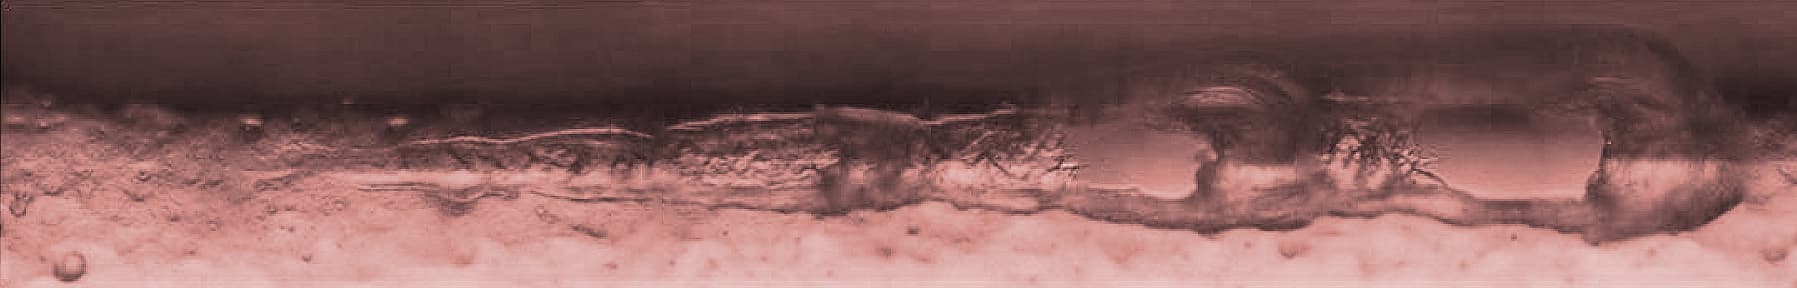
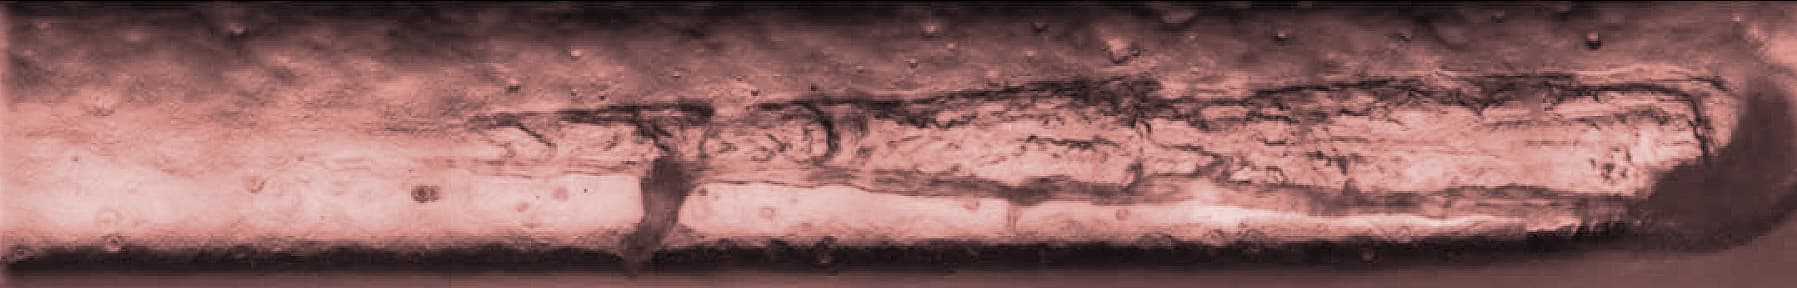
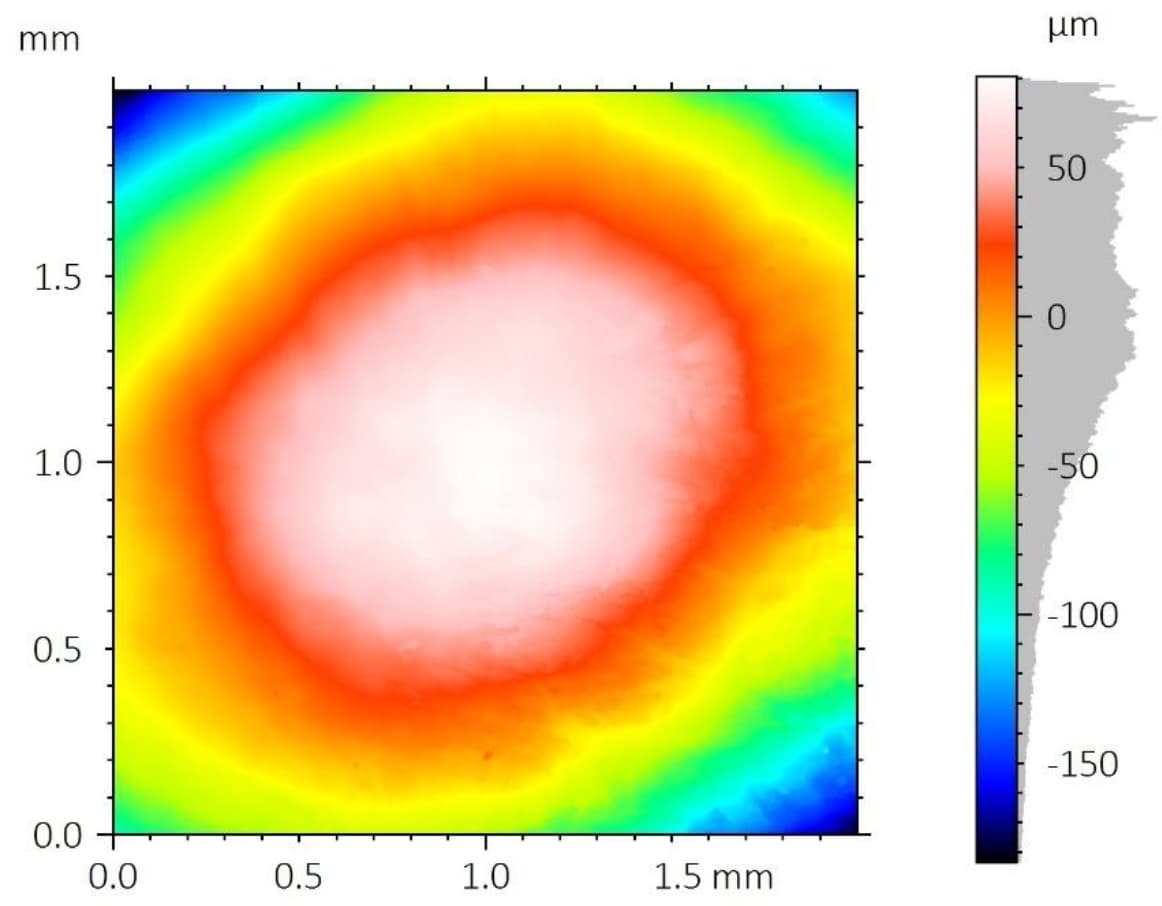
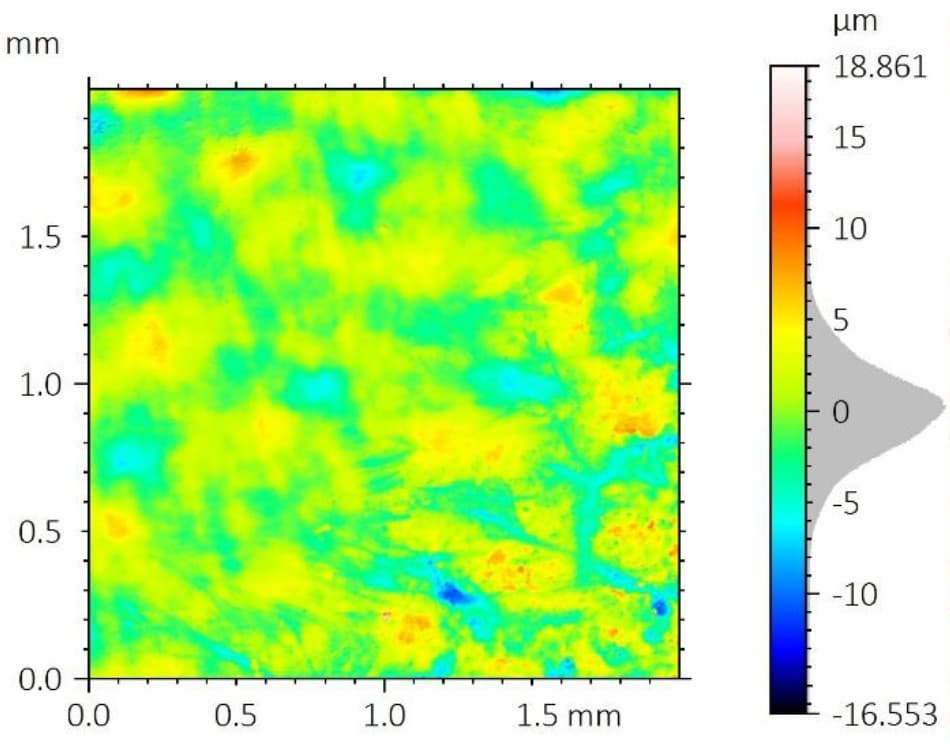
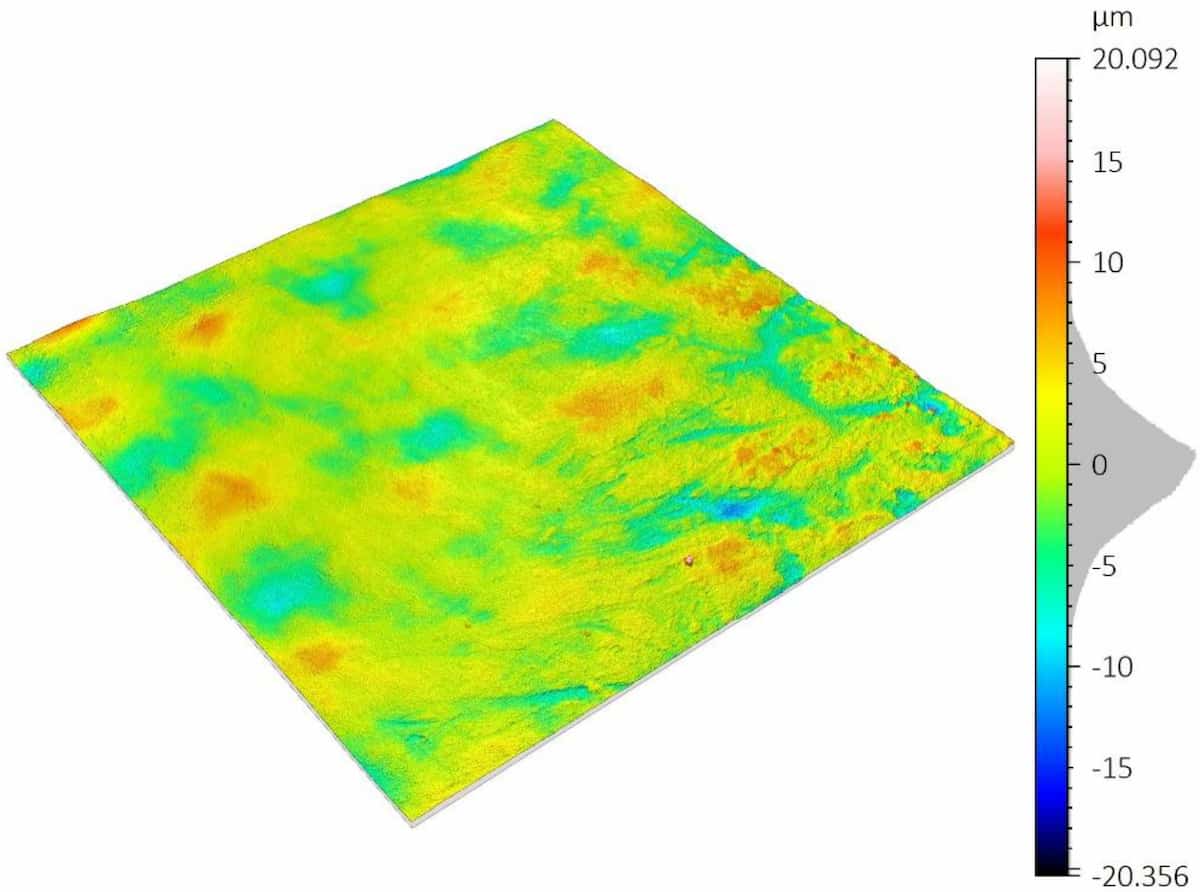
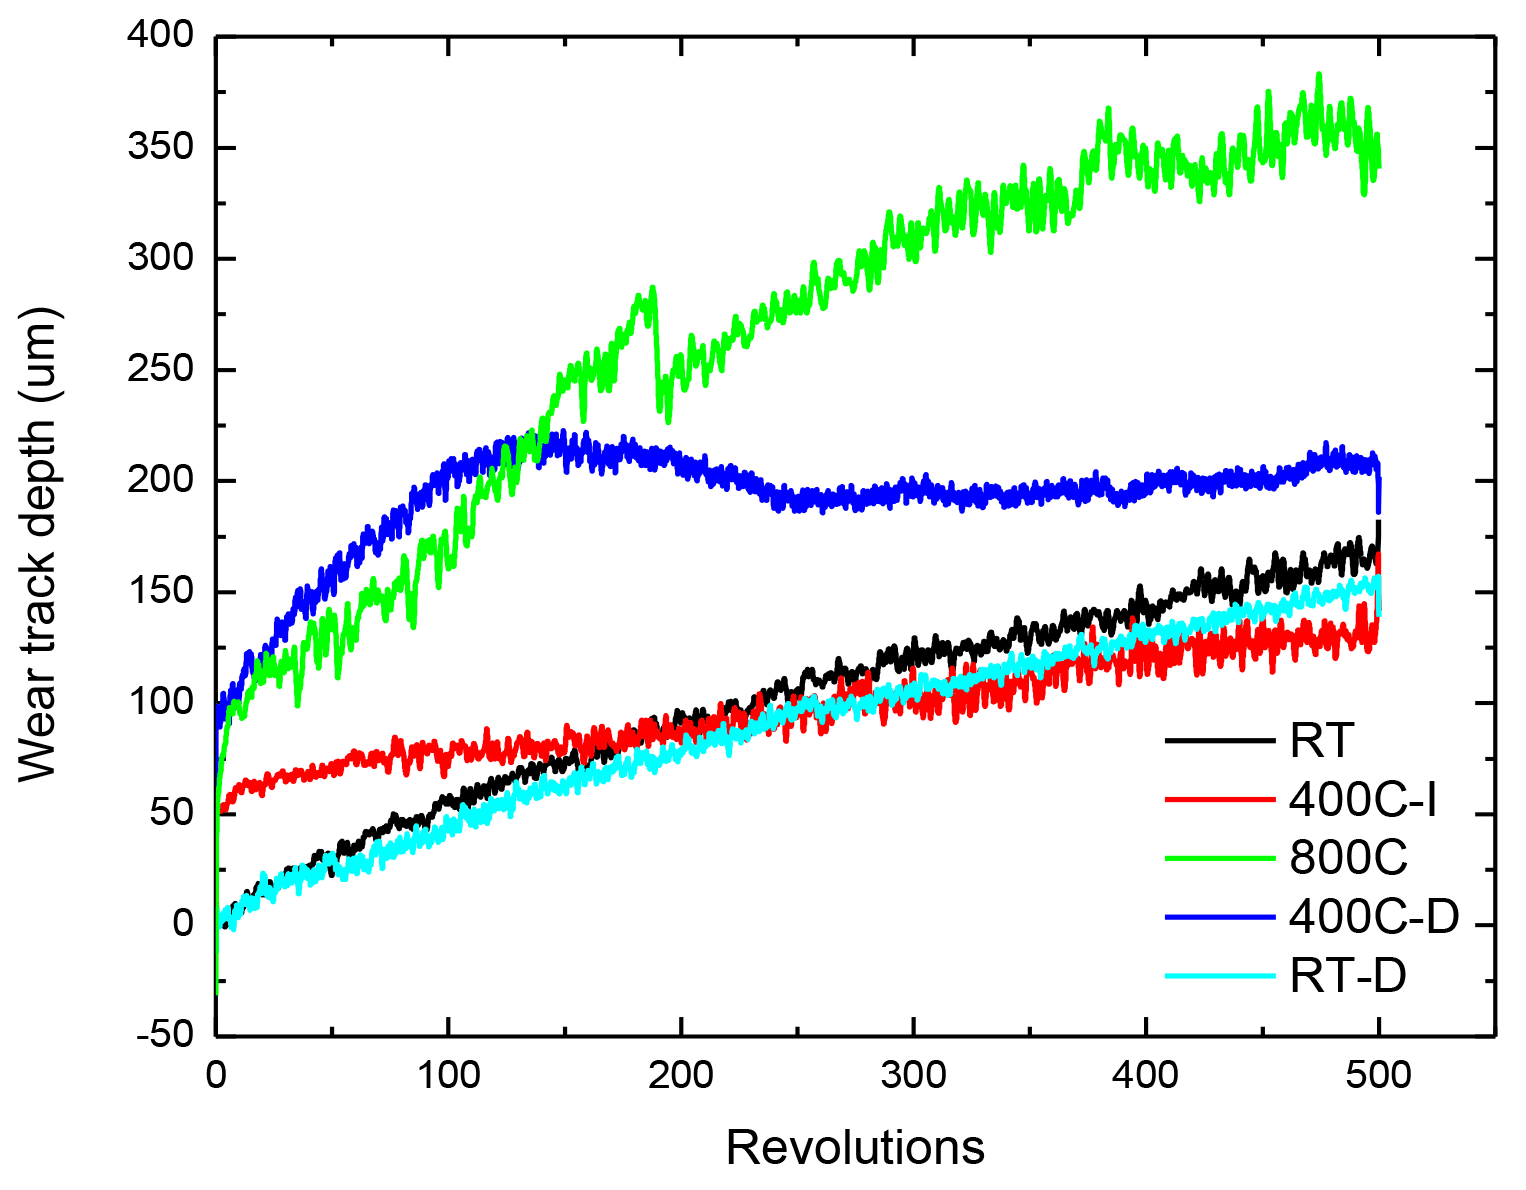
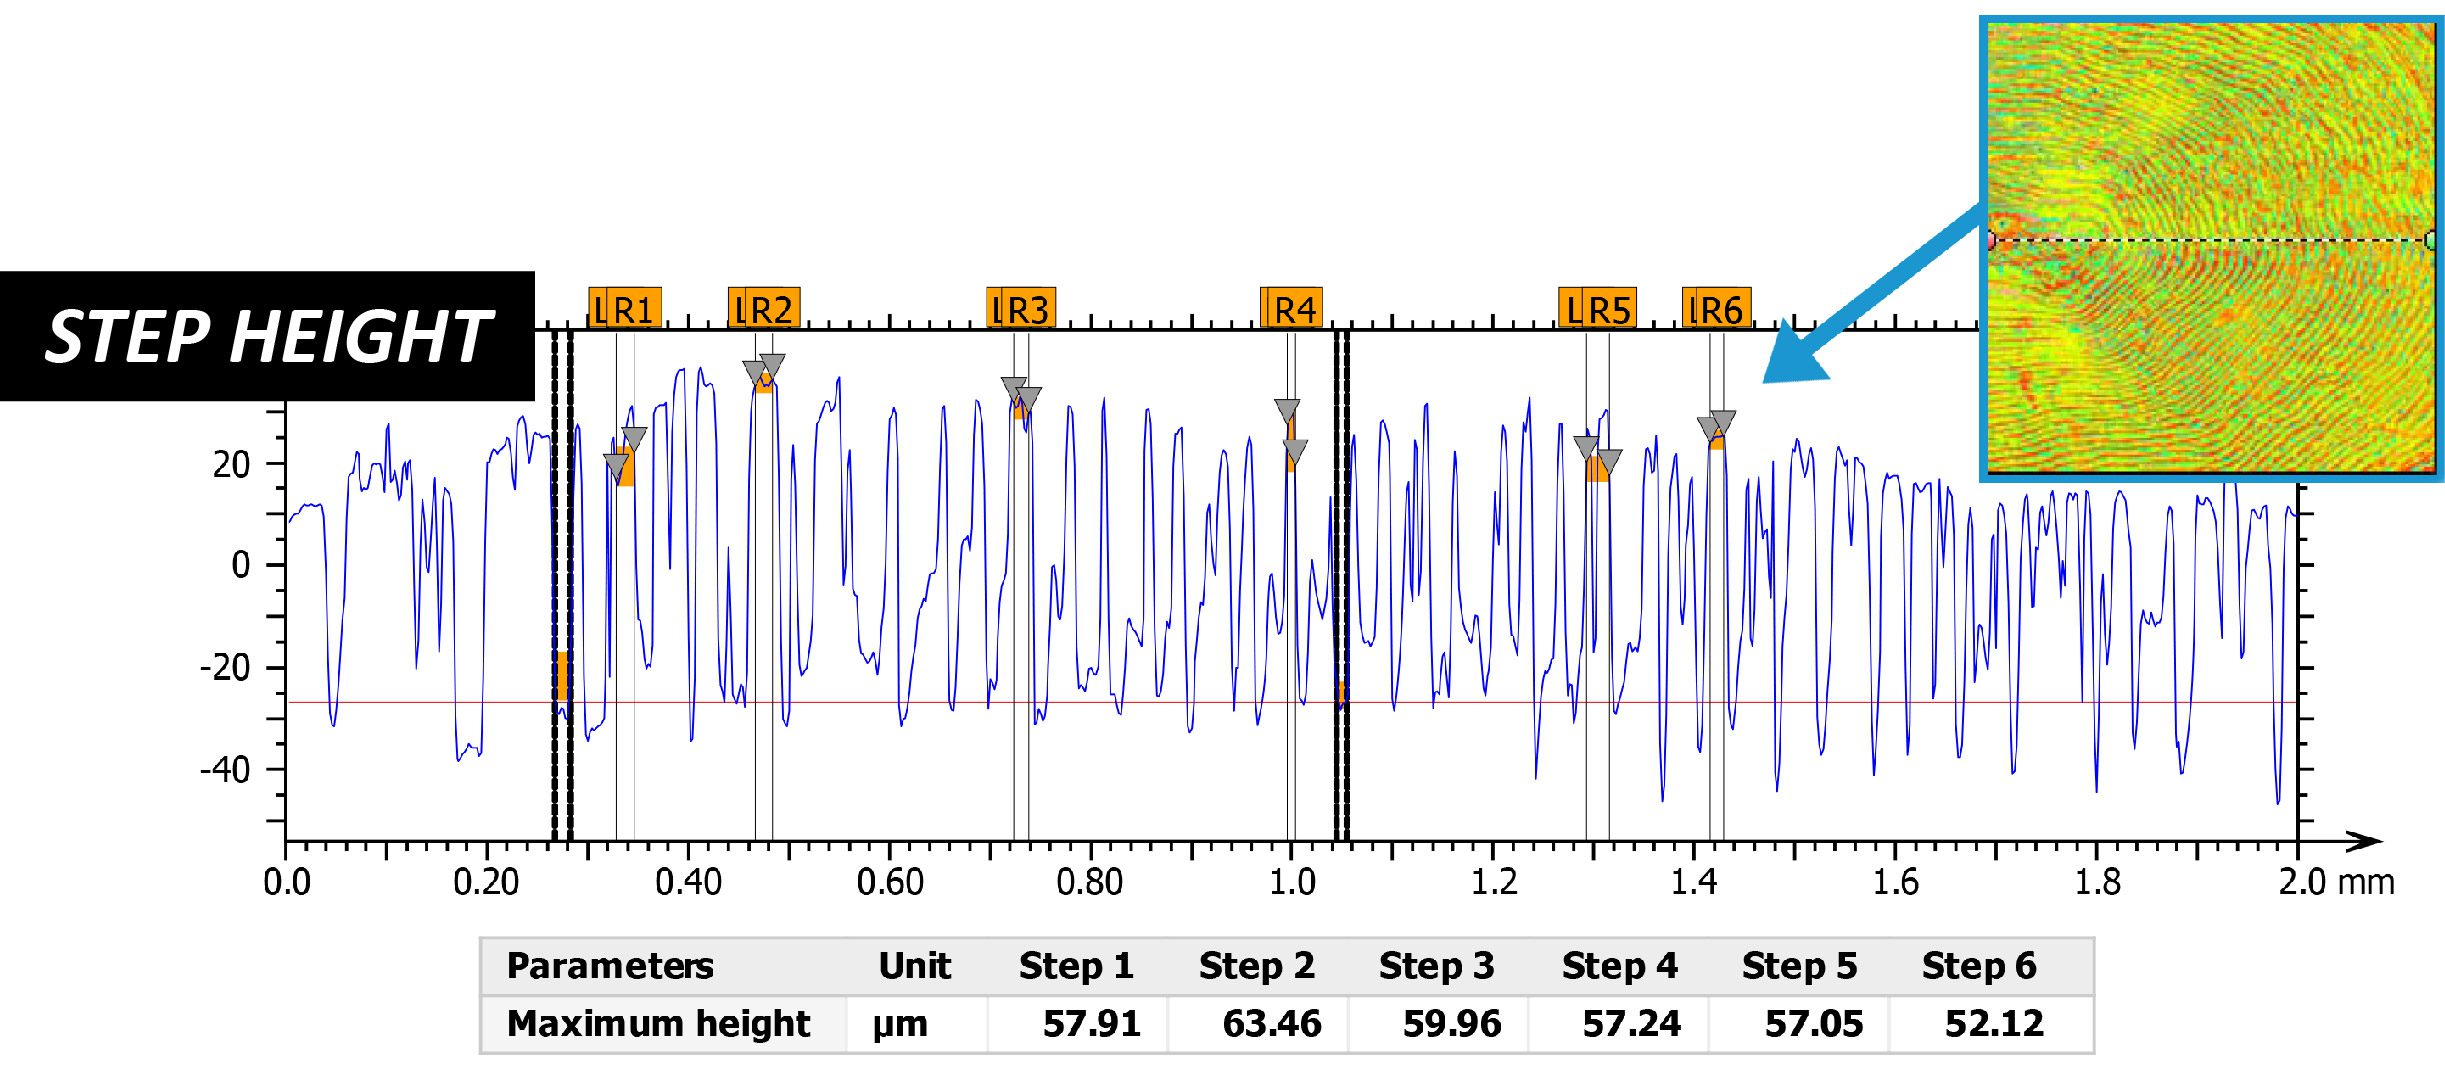
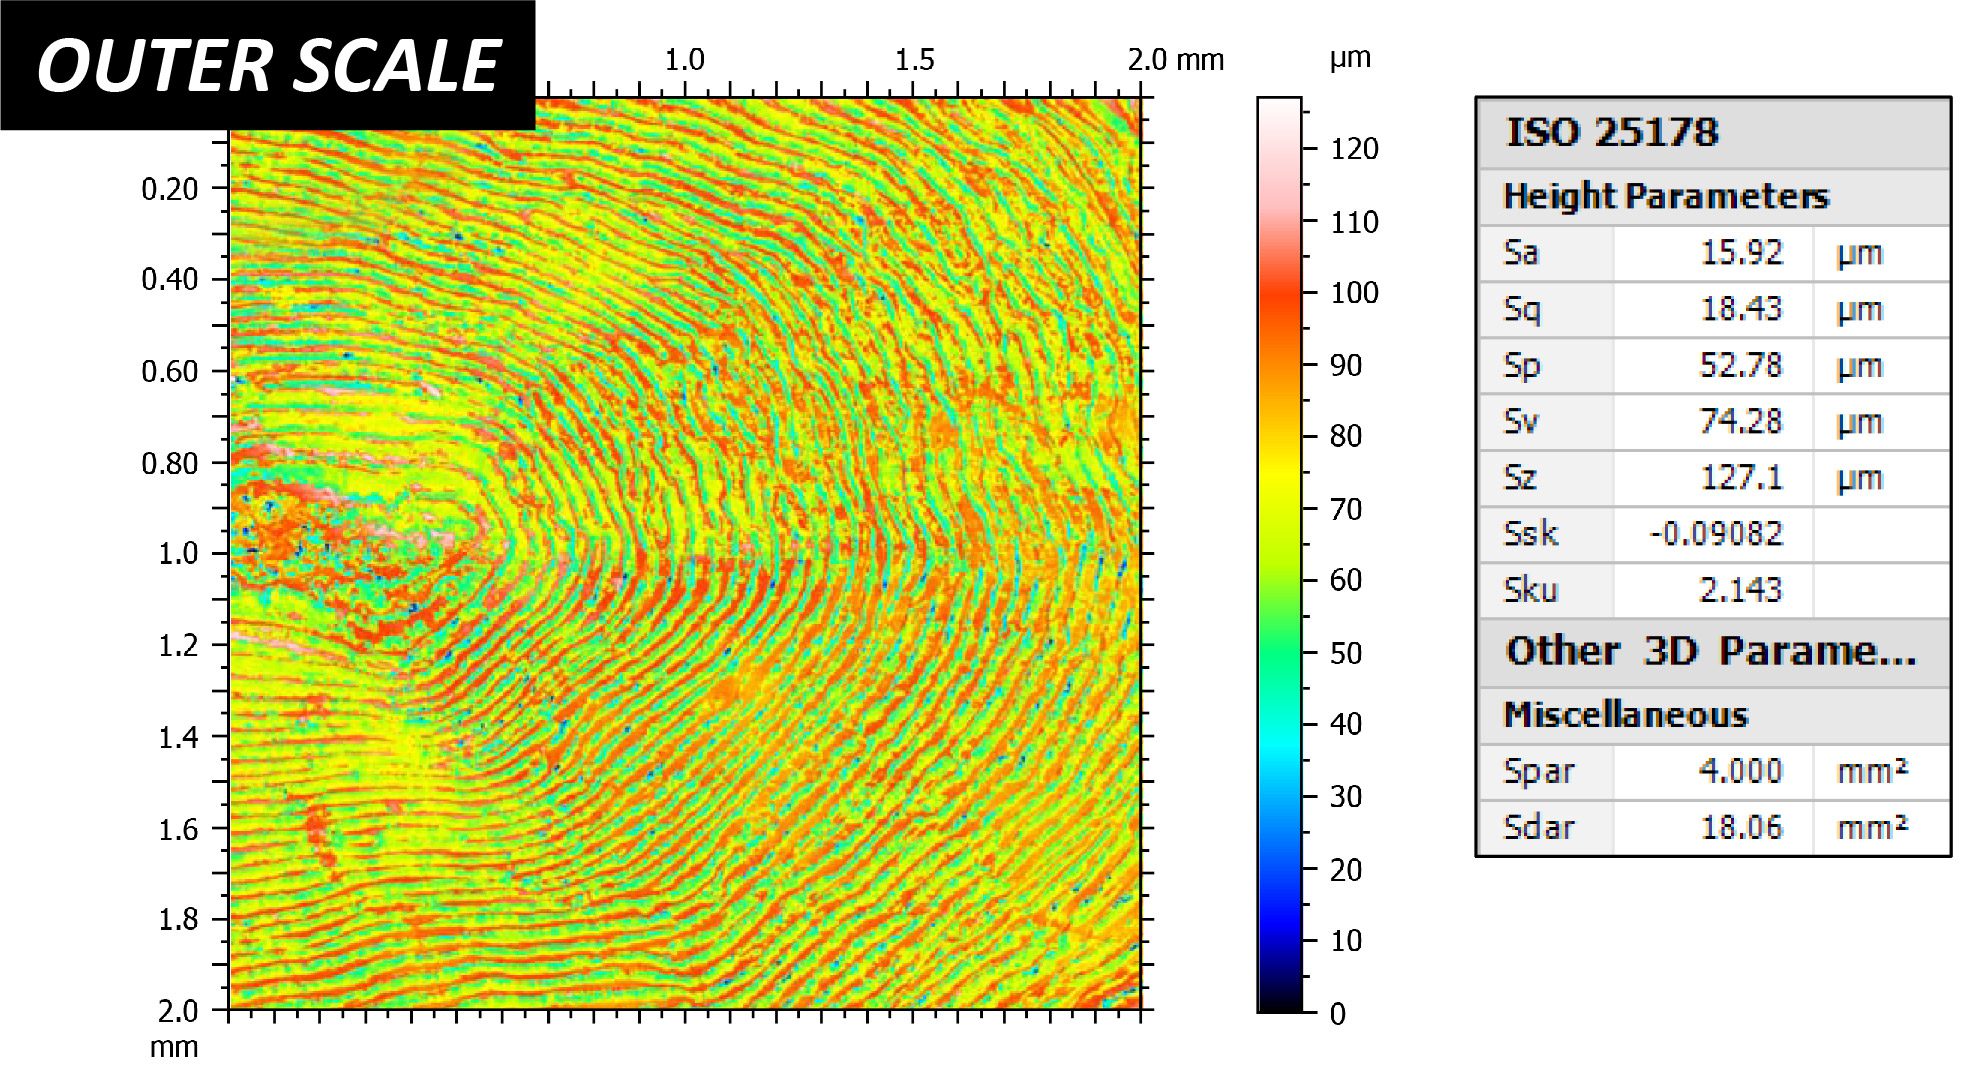
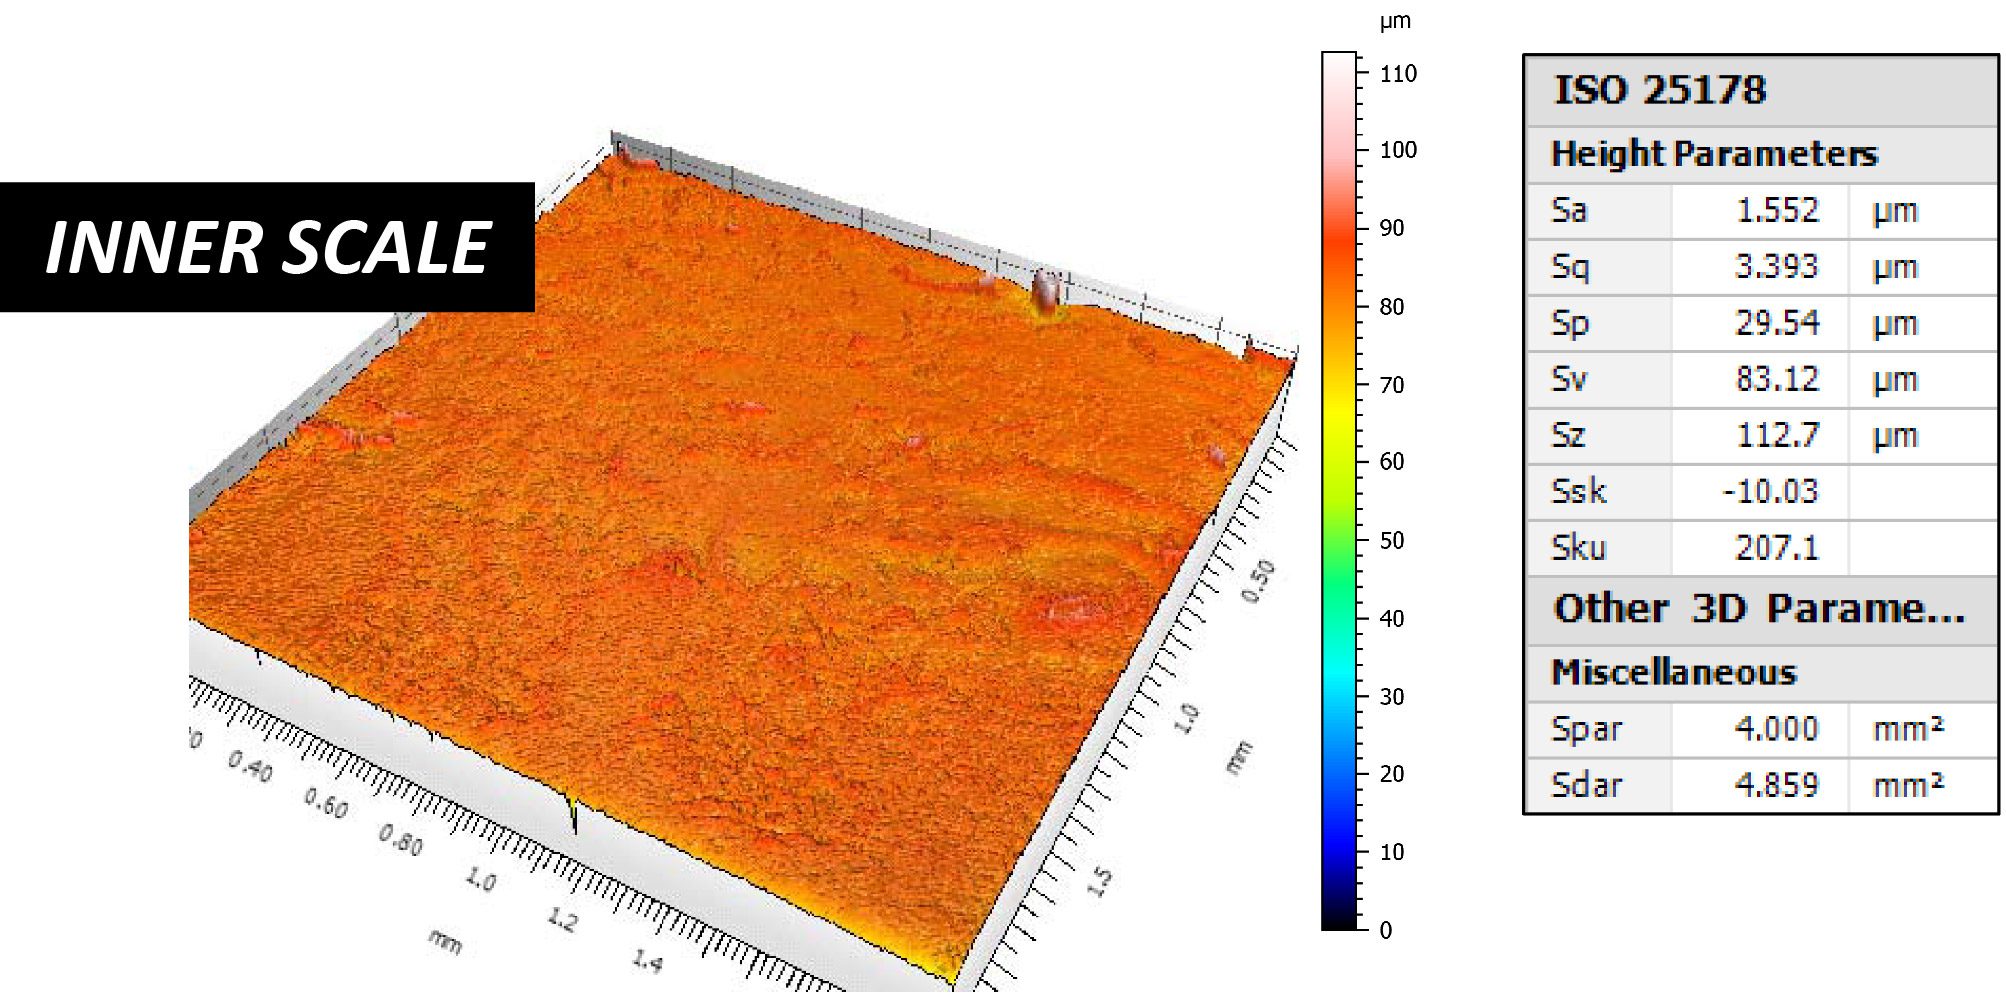
図 4 と図 5 は、それぞれ光学顕微鏡と Nanovea 非接触光学プロファイラーで測定された後のボール ベアリングの摩耗痕を比較しています。表 2 は摩耗痕跡分析の結果をまとめています。 Nanovea 3D プロファイラーはボール ベアリングの摩耗量を正確に測定し、さまざまなボール ベアリングの摩耗率を計算して比較することができます。摩耗試験後、Cr 鋼および SS440 ボールは、セラミック ボール、つまり Al2O3 および WC と比較して、はるかに大きな平らな摩耗傷を示すことが観察できます。 Cr 鋼ボールと SS440 ボールの摩耗率は、それぞれ 3.7×10⁻³ および 3.2×10⁻³ m3/N m です。比較すると、Al2O3 ボールは耐摩耗性が向上し、摩耗率は 7.2×10⁻⁴ m3/N・m です。 WC ボールは、浅い摩耗トラック領域に小さな傷をほとんど示さず、その結果、摩耗率が 3.3×10⁻⁶ mm3/N・m と大幅に減少しました。
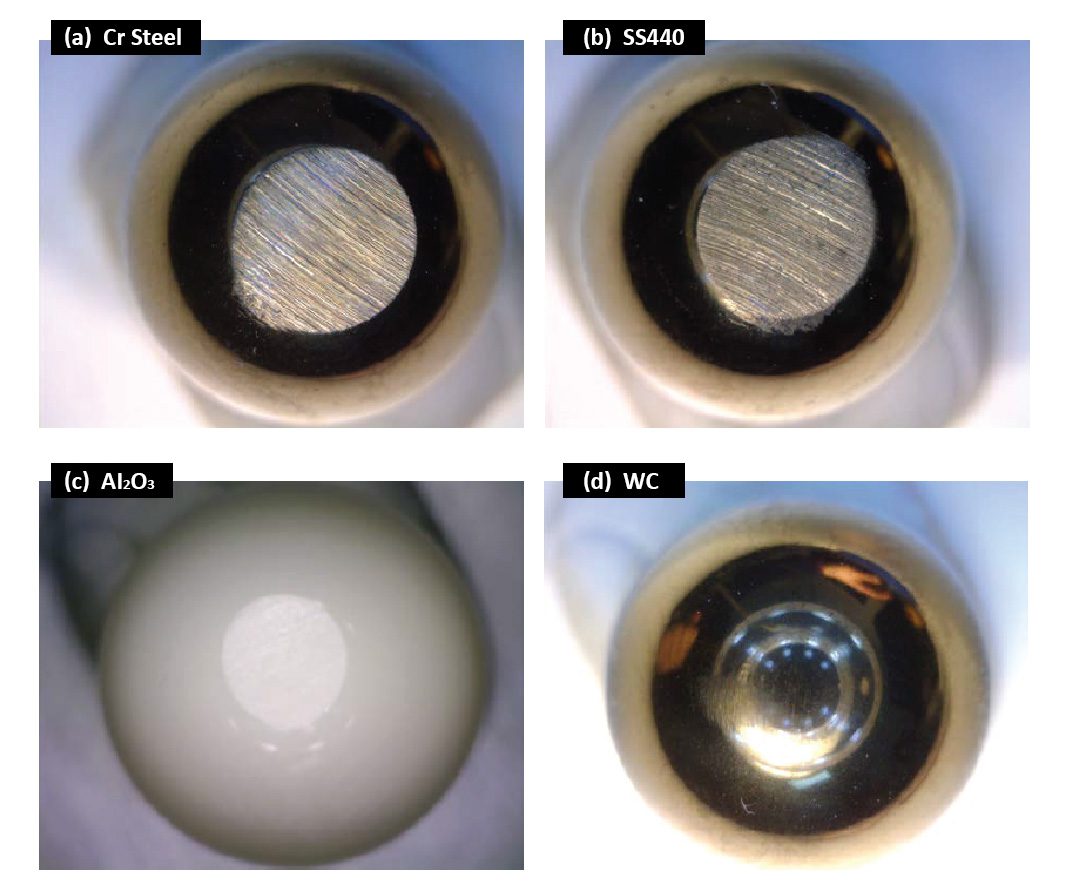
図4: 試験後のボールベアリングの摩耗痕。
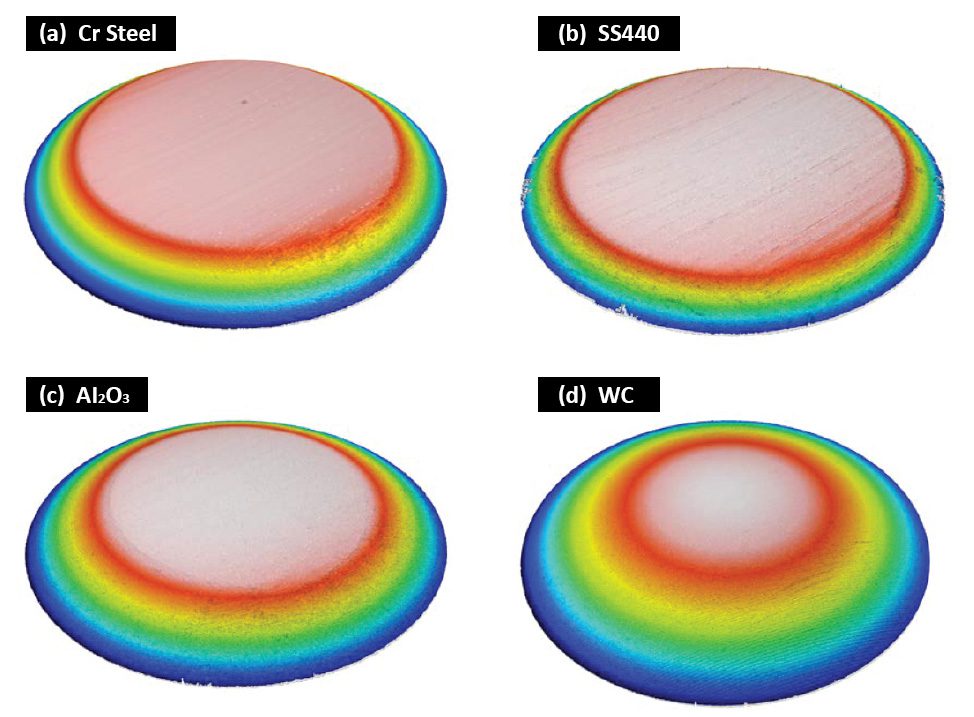
図 5: ボール ベアリングの摩耗痕の 3D 形態。
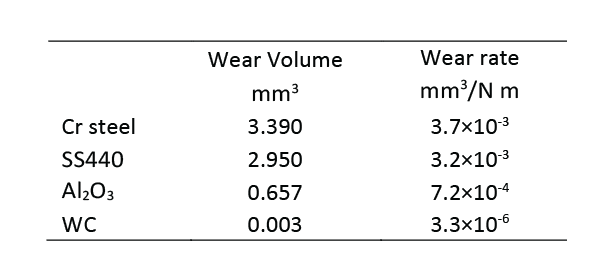
表 2: ボールベアリングの摩耗痕分析。
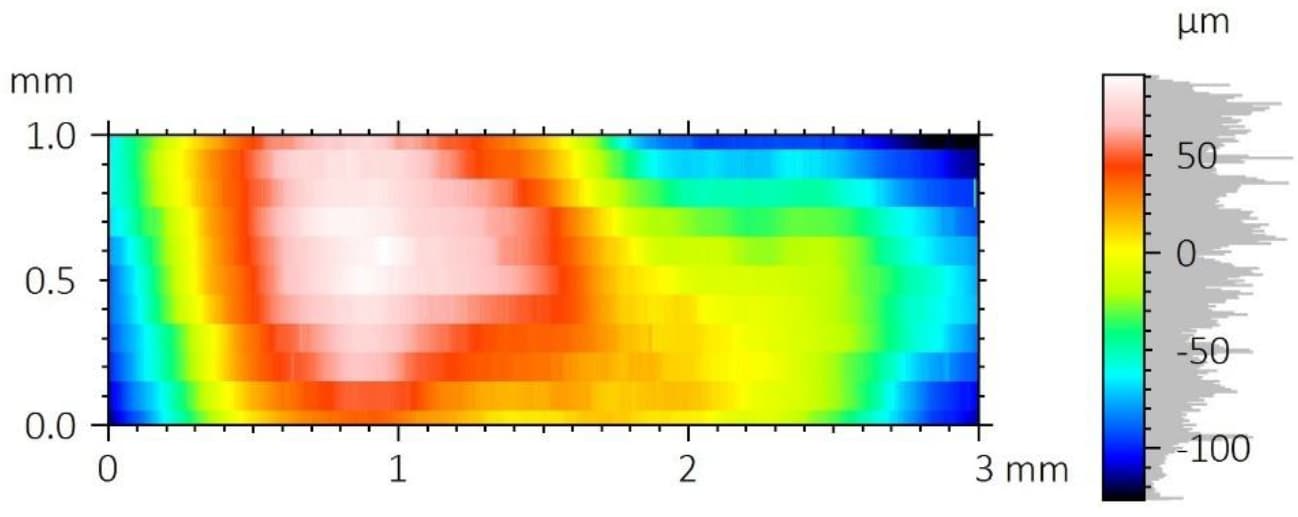
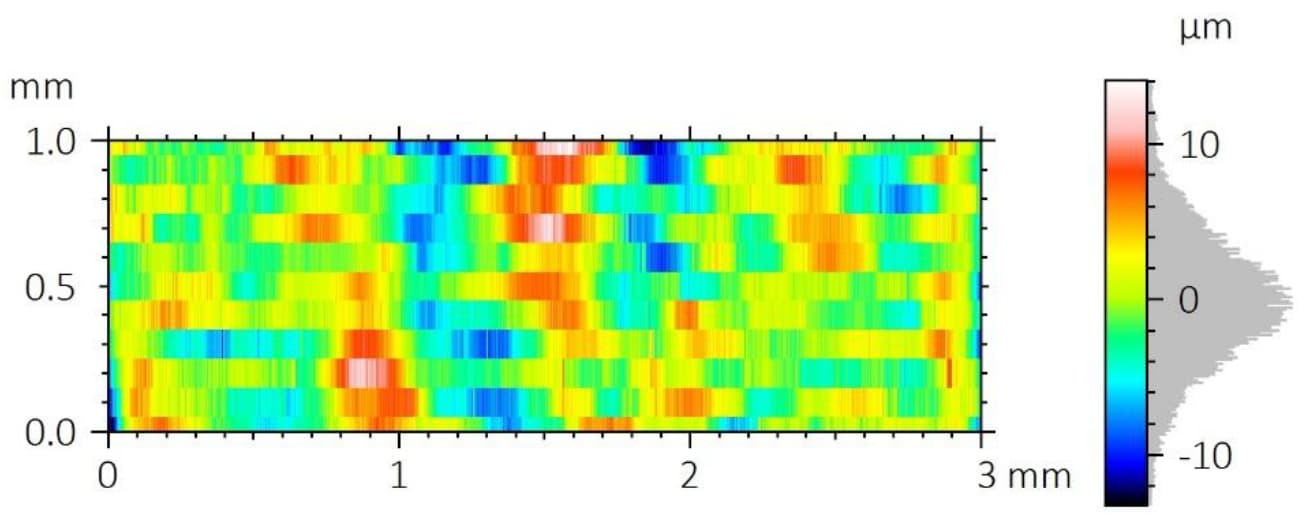
図 6 は、4 つのボール ベアリングによってサンドペーパー上に生じた摩耗跡の顕微鏡画像を示しています。 WC ボールが最も激しい摩耗軌跡を生成し (その経路にあるほとんどすべての砂粒子が除去された)、最高の耐摩耗性を備えていることは明らかです。比較すると、Cr スチールと SS440 のボールでは、サンドペーパーの摩耗跡に大量の金属の破片が残りました。
これらの観察は、スパイラル テストの利点の重要性をさらに示しています。これにより、ボール ベアリングが常にサンドペーパーの新しい表面上で滑ることが保証され、耐摩耗性テストの再現性が大幅に向上します。

図 6: サンドペーパー上のさまざまなボール ベアリングに対する摩耗跡。
まとめ
高圧下でのボール ベアリングの耐摩耗性は、そのサービス性能に重要な役割を果たします。セラミックボールベアリングは、高応力条件下での耐摩耗性が大幅に向上し、ベアリングの修理や交換にかかる時間とコストを削減します。この研究では、WC ボール ベアリングはスチール ベアリングと比較して大幅に高い耐摩耗性を示し、激しい摩耗が発生するベアリング用途の理想的な候補となっています。
Nanovea トライボメーターは、最大 2000 N の負荷に対応する高トルク機能と、0.01 ~ 15,000 rpm の回転速度に対応する正確に制御されたモーターを備えて設計されています。 ISO および ASTM に準拠した回転モードおよび直線モードを使用した反復可能な摩耗および摩擦試験を提供し、オプションの高温摩耗および潤滑モジュールを 1 つの事前統合システムで利用できます。この比類のない範囲により、ユーザーは高応力、摩耗、高温などのボール ベアリングのさまざまな過酷な作業環境をシミュレートできます。また、高荷重下での優れた耐摩耗性材料のトライボロジー挙動を定量的に評価するための理想的なツールとしても機能します。
Nanovea 3D 非接触プロファイラーは、正確な摩耗量測定を提供し、摩耗跡の詳細な形態を分析するツールとして機能し、摩耗メカニズムの基本的な理解にさらなる洞察を提供します。
作成者
Duanjie Li 博士、ジョナサン・トーマス、ピエール・ルルー