USA/GLOBALNE: +1-949-461-9292
EUROPA: +39-011-3052-794
KONTAKT
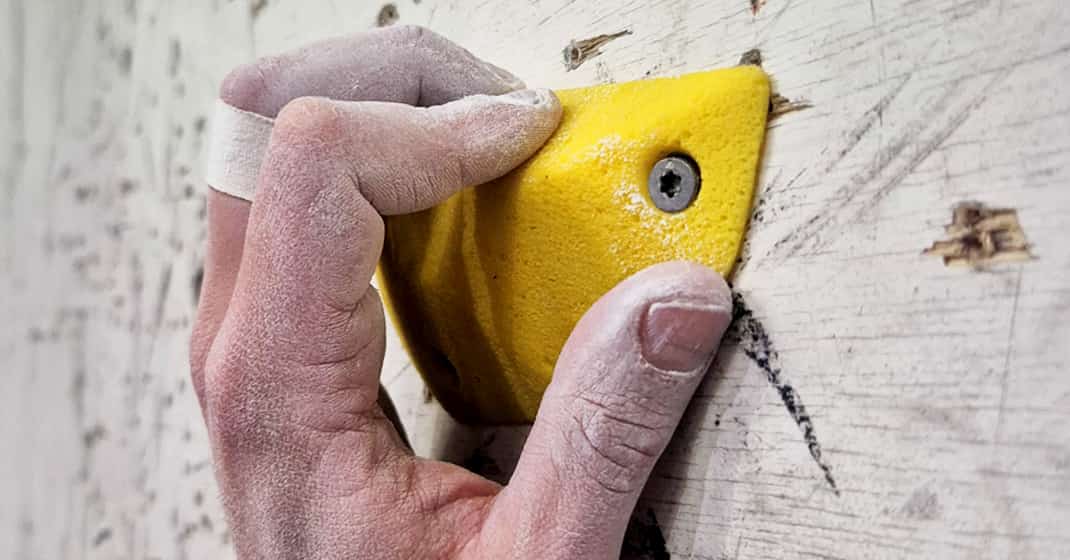
3D optical profilometry image showing climbing hold surface roughness, pore morphology, and grip-related texture features.

Climbing Hold Surface Roughness Analysis

Application Note | 3D Optical Profilometry

Climbing Hold Surface Roughness Analysis Using 3D Optical Profilometry

Measuring Texture, Porosity, and Topography on Bouldering Holds

Bouldering holds analyzed for climbing hold surface roughness using 3D optical profilometry.

Research & Experimental Testing

Walter Alabiso, PhD

Visual Design & Editorial

Andrew Shore

Wstęp

Bouldering requires controlled contact between the climber, the shoe rubber, the hand, and the climbing surface. On slab routes, where the wall is angled below vertical and positive holds may be limited, friction becomes especially important. In these conditions, surface texture can strongly influence how a climber maintains contact with the wall.

Climbing hold surface roughness is shaped by features such as asperities, pores, micro-cracks, and local surface valleys. Roughness provides microtexture for smearing, where high-friction shoe rubber is pressed against the surface to increase contact and generate adherence. Similar contact behavior occurs at the fingers, where skin deformation and fingerprint ridges interact with small surface features.

Porosity can also influence grip behavior by interacting with chalk, sweat, or humidity at the contact point. Pores and cracks may help remove moisture from the interface or create local friction points that support lateral tension. Because these functional features exist at different scales, 3D surface measurement is useful for comparing how different climbing hold textures may perform.

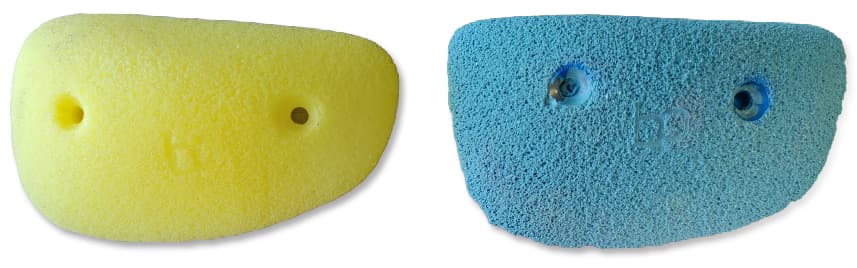
Bouldering grips used to compare surface roughness, pore morphology, and grip-related topography.

Why Use Non-Contact Profilometry for Climbing Hold Surface Analysis

Climbing holds and rock-like surfaces can include deep pores, steep asperities, sharp valleys, and irregular texture. These features are difficult to measure accurately with contact-based profilometry because a physical stylus can lose contact, deform local surface features, or fail to reach narrow cavities.

NANOVEA’s non-contact optical profilometry uses chromatic light technology to capture surface height data without touching the sample. This makes it suitable for reconstructing complex climbing hold topography, including deep nooks, pores, and surface flaws, while avoiding measurement artifacts caused by local plastic deformation.
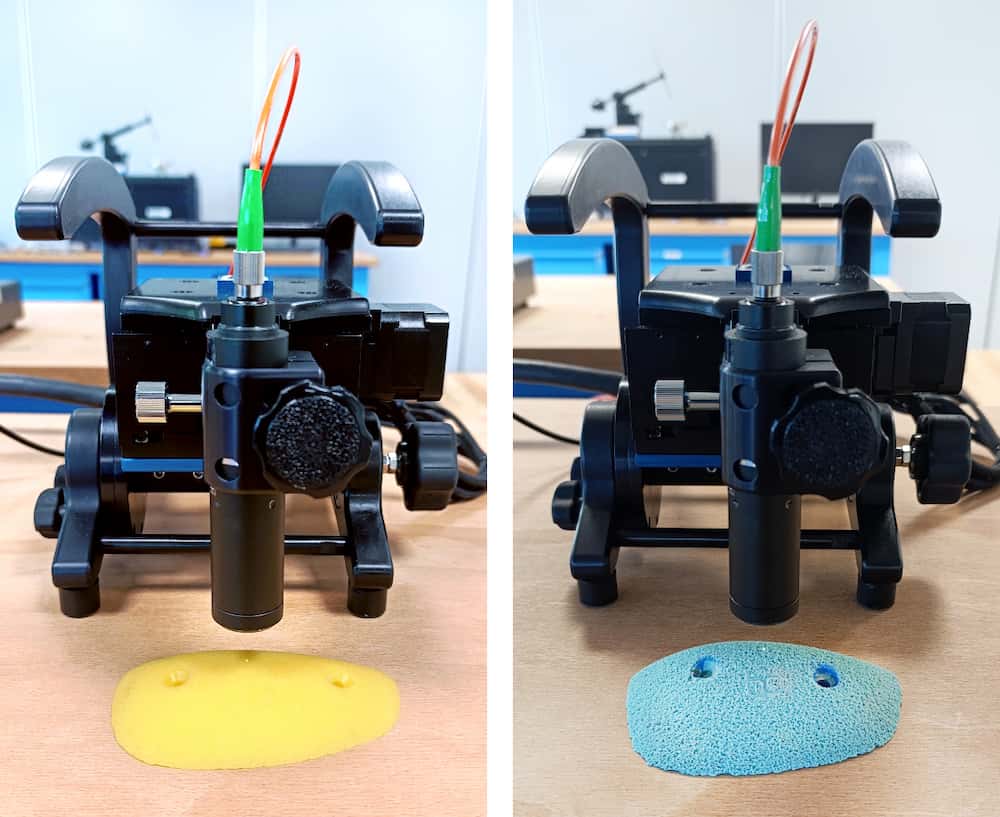
In this study, the NANOVEA JR25 Optical Profiler was used to measure two bouldering grips: a yellow block with a smoother, flatter surface and a green block with a rougher tactile texture. Both samples were scanned using a PS4-MG35 single-point optical sensor with a 3000 µm Z-range and a 4 µm acquisition step in X and Y.

Dual-frequency acquisition was used to reduce light sensor saturation from localized bright spots on the grip surfaces, allowing the profiler to capture roughness and pore morphology across the scanned areas.

Cel pomiaru

The objective of this study was to demonstrate how non-contact 3D optical profilometry can be used to reconstruct and compare the surface roughness, topography, and pore morphology of climbing holds.

Two bouldering grip samples were analyzed: a yellow block with a smoother, flatter surface and a blue block with a rougher tactile texture and sharper grip features. The analysis focused on surface height variation, areal roughness parameters, pore coverage, pore size, pore depth, and functional surface behavior.

The NANOVEA JR25 Optical Profilometer measuring the climbing hold samples using an optical sensor.

Measurement Method

The NANOVEA JR25 Optical Profiler was used to measure the yellow and blue bouldering grip samples. Each surface was scanned with a PS4-MG35 single-point optical sensor with an enhanced 3000 µm Z-range, allowing the system to capture deep pores, sharp valleys, and irregular surface texture while maintaining a 4 µm acquisition step in X and Y.

Dual-frequency acquisition was used to reduce light sensor saturation from localized bright spots on the grip surfaces, improving data capture across rough, porous, and uneven areas.

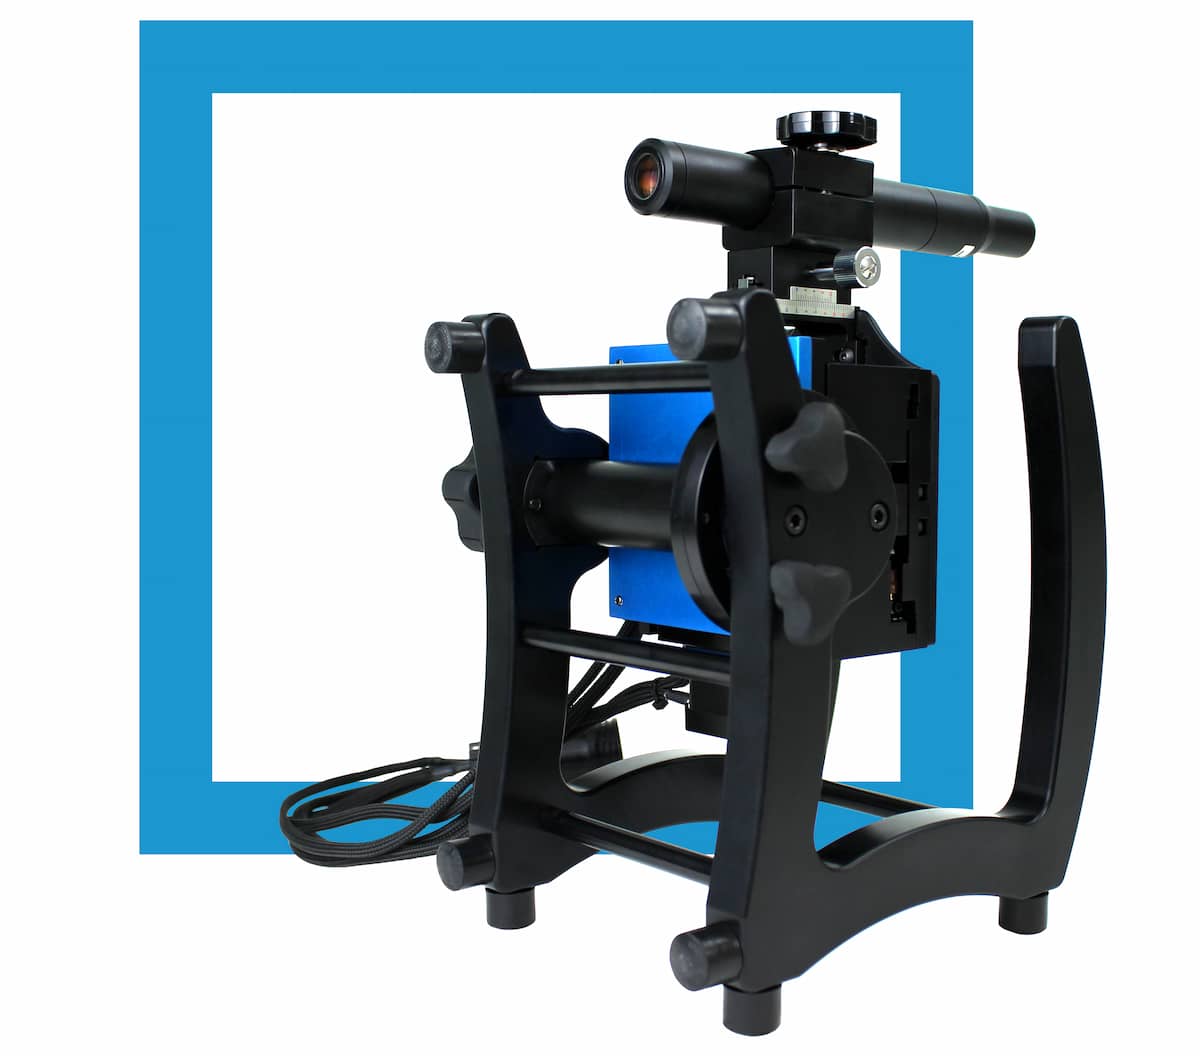
NANOVEA JR25 Portable

Profilometr optyczny

Parametry testowe

Two bouldering grip samples were analyzed: a yellow grip with a smoother, flatter surface and a blue grip with a rougher tactile texture and sharper grip features. The analysis focused on surface height variation, areal roughness parameters, pore coverage, pore size, pore depth, and functional surface behavior.

Measurement Setting Optical Profilometry Setup
Samples measured Yellow and blue bouldering grip samples
Optical pen PS4-MG35
Z-range 3000 µm
Scan area 5.00 mm × 5.00 mm
X-step size 4.00 µm
Y-step size 4.00 µm
Averaging 1
Measurement type Direct
Acquisition mode Dual frequency
Acquisition rate 100–400 Hz
Light intensity 100%

Tabela 1: Optical profilometry test conditions used to measure the bouldering grip samples.

Optical Profilometry Results

Yellow Grip Sample

Surface Roughness Analysis

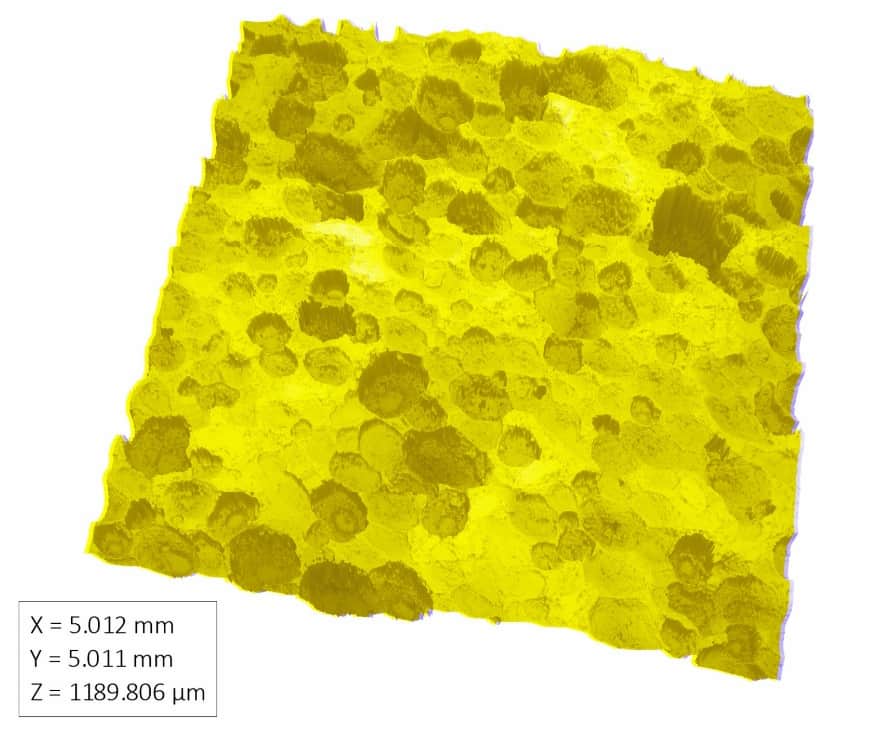
The 3D rendering below shows the reconstructed surface topography of the yellow climbing grip sample.

3D optical profilometry reconstruction of the yellow climbing grip surface showing pores, roughness, and surface height variation.

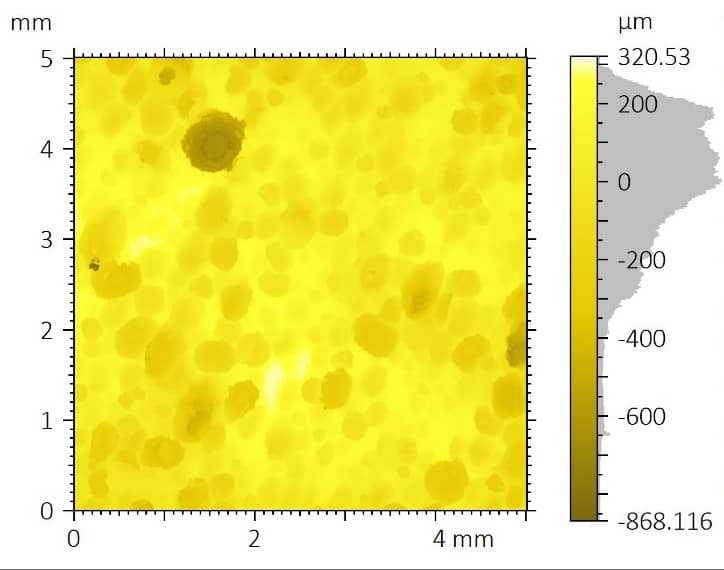
A total least-squares plane was removed to study surface properties. The roughness filters S-Gaussian 2.5 µm was applied following ISO 25178 (1/2 cut-off removed at each side). However, the sharp density of pores and asperities and the elevated average roughness make the use of a Gaussian L-filter (8 mm cut off) inapplicable. Therefore, the primary surface was considered, and the roughness parameters are listed in the table below, alongside the 2D false-color map of the filtered surface.

False-color optical profilometry surface roughness map of the yellow climbing grip sample with ISO 25178 height parameters.
ISO 25178-2 – Primary Surface
S-filter (λs): Gaussian, 2.5 µm, 1/2 cut-off
F-operation: [Workflow] Leveled (TLSPL)
Height Parameters
Sq 168.970 µm Średnia kwadratowa wysokości
Ssk -0.927 Skośność
Sku 4.117 Kurtoza
Sp 320.530 µm Maksymalna wysokość piku
Sv 868.116 µm Maximum pit depth
Sz 1188.645 µm Maksymalna wysokość
Sa 132.953 µm Średnia arytmetyczna wzrostu

The average surface roughness Sa is 132.953 µm, whereas the peak-to-valley roughness, Sz amounts to 1188.645 µm. The surface morphology is skewed towards deep valleys (Ssk < 0, Sv > Sp), with a leptokurtotic (Sku > 3) distribution of peaks and valleys relative to the average plane.

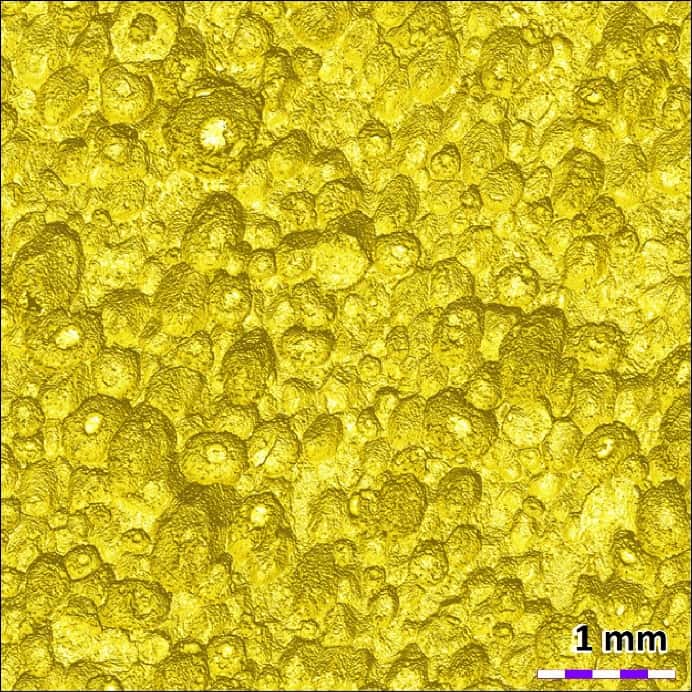
The following picture shows a 2D photo-simulation of the area under artificial lighting, highlighting the region’s morphology.

2D photo simulation of the yellow climbing grip surface showing pores, roughness, and morphology under artificial lighting.

Pore Morphology Analysis

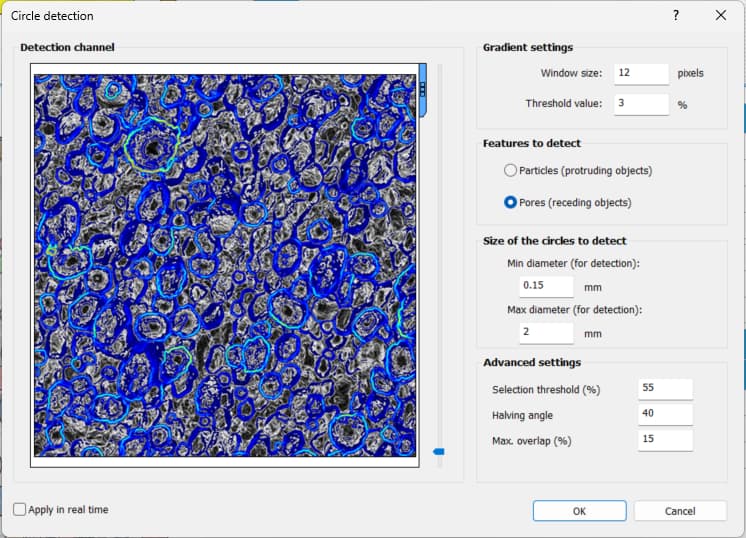
A pore analysis was performed across the full scanned area using a semi-automated edge-detection algorithm. The analysis identified recessed surface features to quantify pore coverage, pore density, radius, void volume, and maximum depth.

Pore detection analysis of the yellow climbing grip surface using semi-automated edge detection to identify recessed surface features.

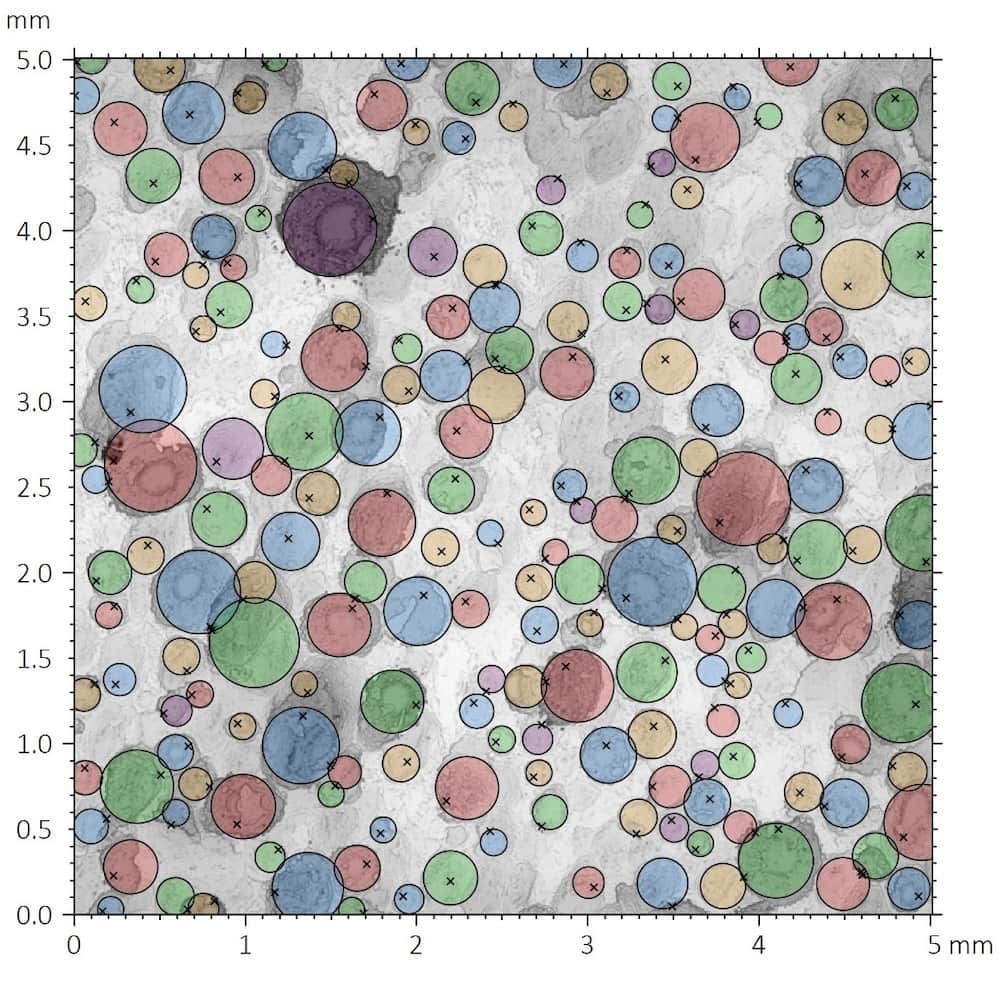
The detected pore locations were then mapped across the scanned 5 mm × 5 mm area to evaluate pore coverage, density, and size distribution.

Pore distribution map of the yellow climbing grip sample showing detected recessed surface features across a 5 mm by 5 mm scanned area.
Information
MethodCircle detection
Features detectedPores, recessed objects
Minimum detection diameter0.150 mm
Maximum detection diameter2.000 mm
Number of detected pores206
Surface coverage47.395%
Pore density8.203 particles/mm²
Global Statistics
ParameterUnitMeanStd. Dev.MinMax
Promieńmm0.1270.0490.0760.275
Void volumeµm³4,724,770.7056,748,143.92523,594.1724.422 × 10⁷
Maximum depthµm173.72994.94228.153716.480

Pores covered nearly half of the yellow grip’s scanned surface, with a measured coverage of 47.395% and a pore density of 8.203 particles/mm². The detected pores and cracks were highly heterogeneous in size, volume, and depth, ranging from large crater-like features with a maximum radius of 0.275 mm and void volume above 4.4 × 10⁷ µm³ to smaller pores with a minimum radius of 0.076 mm and void volume of 23,594.172 µm³. This uneven pore distribution is reflected in the large standard deviation measured for void volume and maximum depth.

Functional Surface Parameters (Abbott-Firestone curve)

The Abbott-Firestone curve shows the cumulative areal material distribution of the yellow climbing grip sample. This analysis defines functional surface parameters including Sk, Spk, and Svk according to ISO 25178-2.

Abbott-Firestone curve for the yellow climbing grip sample showing cumulative areal material distribution and functional surface parameters.
Information
Standard ISO 25178-2
Parameter Value Unit
Sk 409.738 µm
Spk 45.480 µm
Szw 233.446 µm
Smrk1 3.976 %
Smrk2 85.005 %

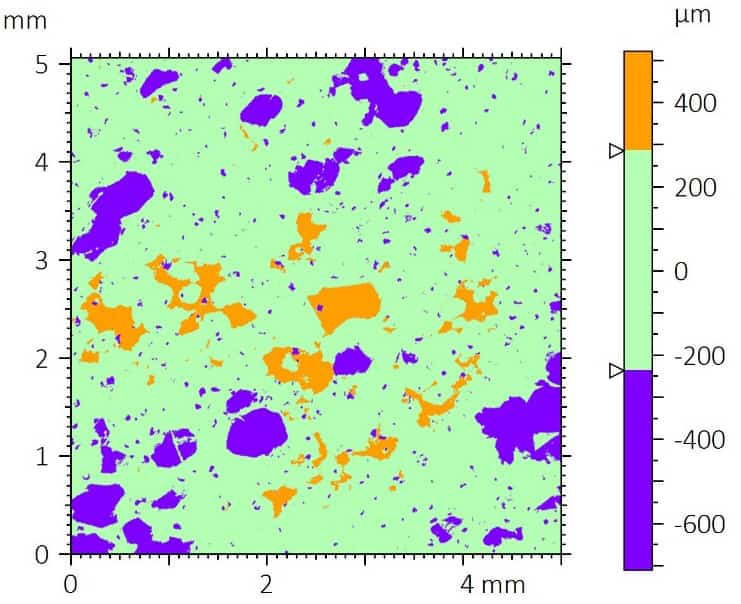
The chart below shows the peak-valley distribution from the mean plane based on the functional parameters derived from the Abbott-Firestone curve. Valleys are shown in purple, the mean plane in green, and peaks in orange.

Peak-valley distribution map of the yellow climbing grip sample showing valleys, mean plane regions, and peaks derived from Abbott-Firestone functional parameters.
Information
1st threshold Height – c1: 229.209 µm
2nd threshold Height – c2: -180.424 µm
Parameters Unit
Projected area (in %) % 14.995 81.029 3.976
Projected area mm² 3.772 20.381 1.000
Volume of material (in %) % 97.451 48.100 0.973
Volume of material µm³ 1.684 × 10¹⁰ 4.956 × 10⁹ 2.275 × 10⁷

The yellow grip sample shows a dominant mean-plane region with scattered recessed pores and a smaller population of raised peaks. This indicates a surface texture characterized mainly by average-sized pores distributed across the scanned area.

Blue Grip Sample

Surface Roughness Analysis

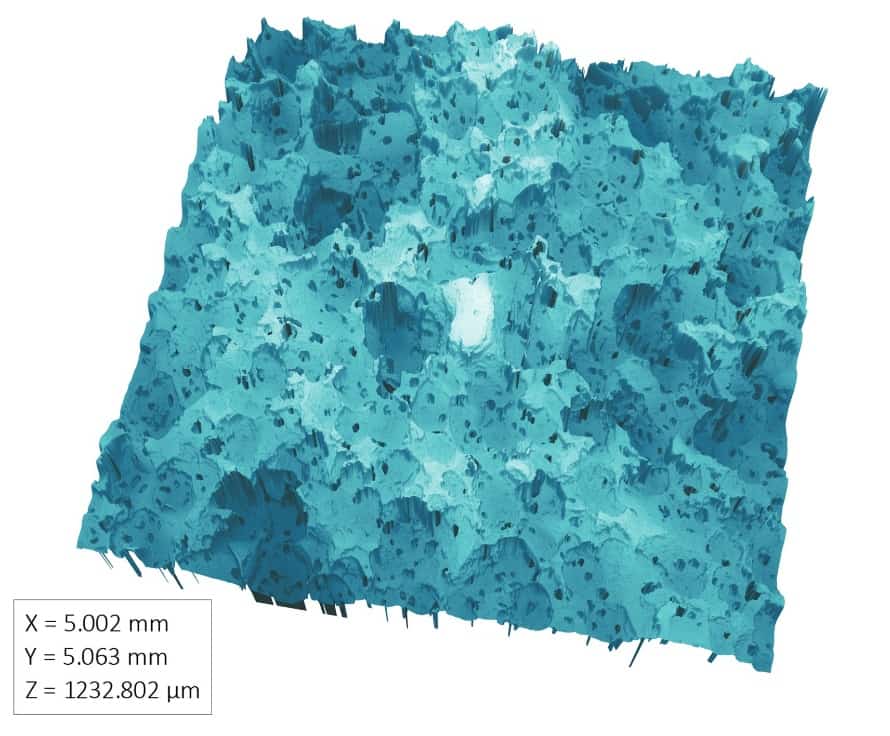
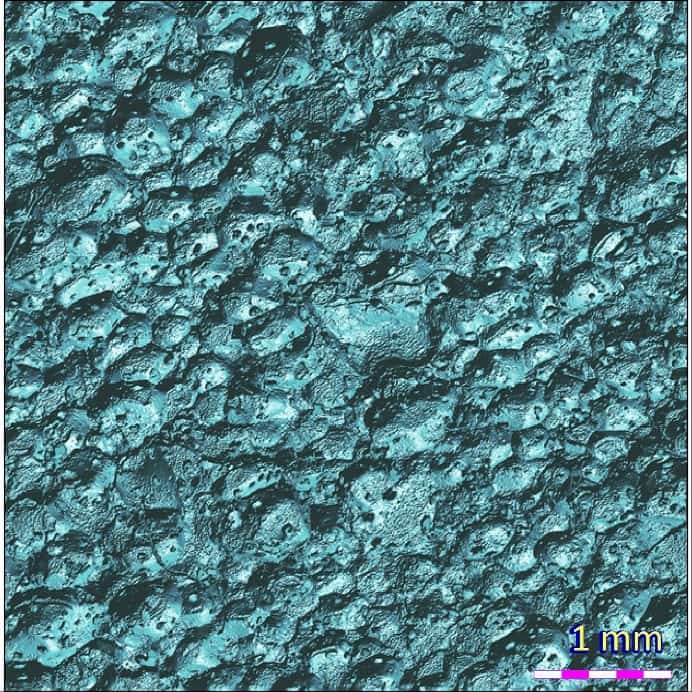
The 3D rendering below shows the reconstructed surface topography of the blue climbing grip sample.

3D optical profilometry reconstruction of the blue climbing grip surface showing roughness, pores, asperities, and surface height variation.

A total least-squares plane was removed to evaluate the blue grip’s surface properties. An S-Gaussian 2.5 µm roughness filter was applied following ISO 25178, with 1/2 cut-off removed at each side.

Because of the dense pores, asperities, and elevated average roughness, a Gaussian L-filter with an 8 mm cut-off was not applied. The primary surface was used for roughness analysis, with the roughness parameters listed alongside the 2D false-color map of the filtered surface.

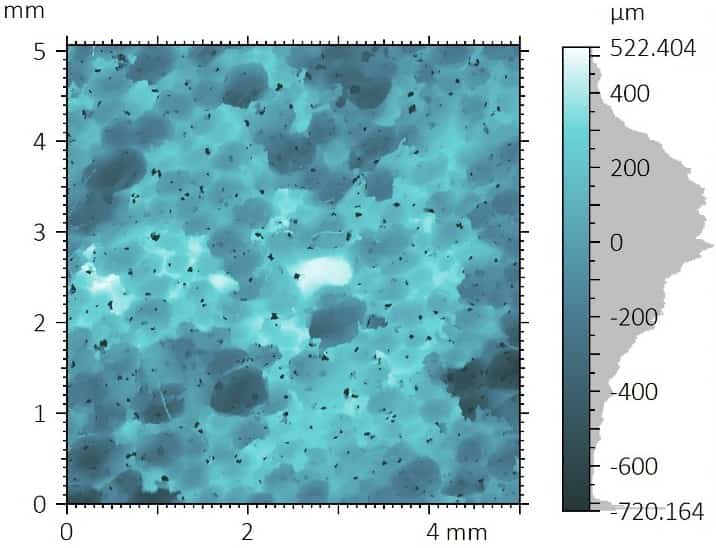
False-color optical profilometry surface roughness map of the blue climbing grip sample with ISO 25178 height parameters.
ISO 25178-2 – Primary Surface
S-filter (λs): Gaussian, 2.5 µm, 1/2 cut-off
F-operation: [Workflow] Leveled (TLSPL)
Height Parameters
Sq 211.440 µm Średnia kwadratowa wysokości
Ssk -0.682 Skośność
Sku 3.672 Kurtoza
Sp 522.404 µm Maksymalna wysokość piku
Sv 720.164 µm Maximum pit depth
Sz 1242.568 µm Maksymalna wysokość
Sa 166.719 µm Średnia arytmetyczna wzrostu

The blue grip sample had an average surface roughness, Sa, of 166.719 µm and a peak-to-valley roughness, Sz, of 1242.568 µm. The negative skewness value, Ssk &lt; 0, indicates that the surface morphology is skewed toward deep valleys, while Sv &gt; Sp shows that the maximum pit depth exceeded the maximum peak height.

The kurtosis value, Sku &gt; 3, indicates a leptokurtotic height distribution, meaning the blue grip surface contains sharper or more extreme peaks and valleys relative to the average plane.

The 2D photo simulation below highlights the blue climbing grip’s surface morphology under artificial lighting.

2D photo simulation of the blue climbing grip surface showing pores, roughness, and morphology under artificial lighting.

Pore Morphology Analysis

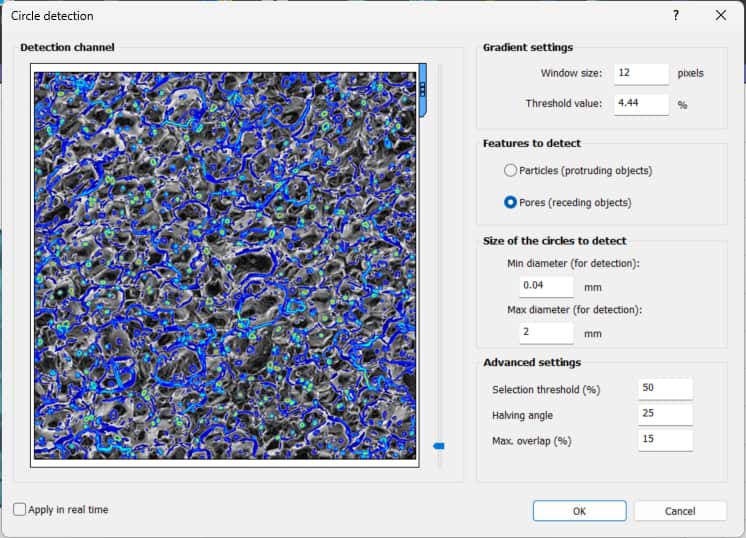
A pore analysis was performed across the full scanned area using a semi-automated edge-detection algorithm. The analysis identified recessed surface features to quantify pore coverage, pore density, radius, void volume, and maximum depth.

Pore detection analysis of the blue climbing grip surface using semi-automated edge detection to identify recessed surface features.

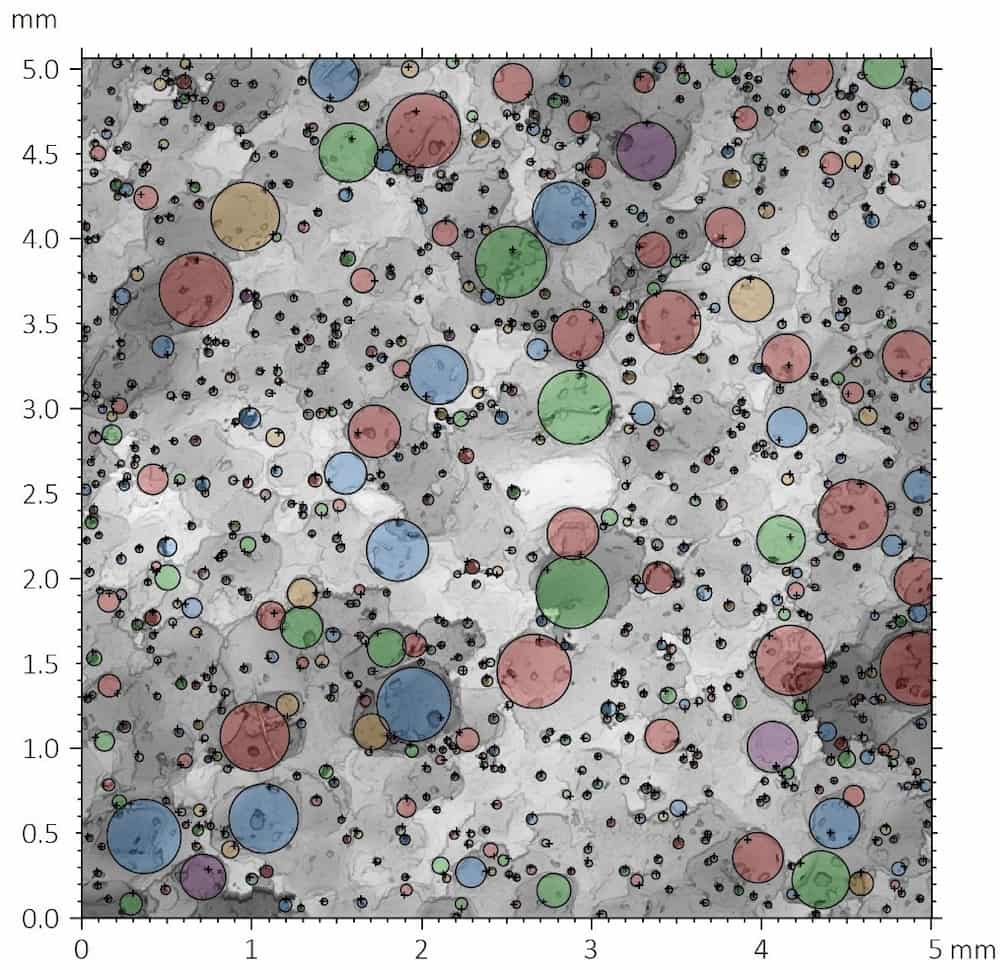
The detected pore locations were mapped across the scanned 5 mm × 5 mm area to evaluate pore coverage, density, and size distribution.

Pore distribution map of the blue climbing grip sample showing detected recessed surface features across a 5 mm by 5 mm scanned area.
Information
Method Circle detection
Features detected Pores, recessed objects
Minimum detection diameter 0.040 mm
Maximum detection diameter 2.000 mm
Number of detected pores 794
Surface coverage 24.208%
Pore density 31.355 particles/mm²
Global Statistics
Parameter Unit Mean Std. Dev. Min Max
Promień mm 0.035 0.035 0.020 0.218
Void volume µm³ 821,872.849 2,495,310.021 11,009.819 2.929 × 10⁷
Maximum depth µm 476.053 305.830 16.132 1044.045

Pores covered 24.208% of the blue grip’s scanned surface, with a pore density of 31.355 particles/mm². The detected pores and cracks were highly heterogeneous in size, volume, and depth, ranging from large crater-like features with a maximum radius of 0.218 mm and void volume greater than 2.9 × 10⁷ µm³ to small pores with a minimum radius of 0.020 mm and void volume of approximately 1.1 × 10⁴ µm³.

This uneven distribution is reflected in the large standard deviation measured for void volume and maximum depth. The pore distribution is bimodal, with one population of fine, deep pores and another population of larger crater-like valleys.

Functional Surface Parameters (Abbott-Firestone curve)

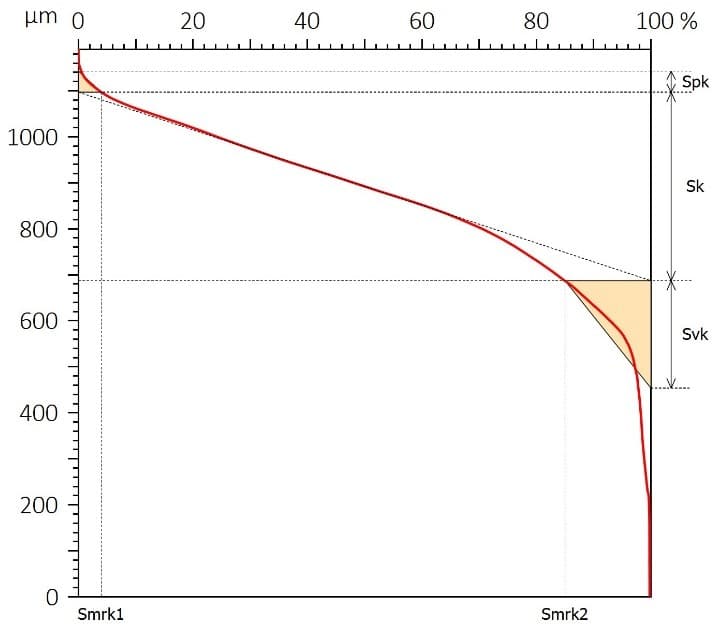
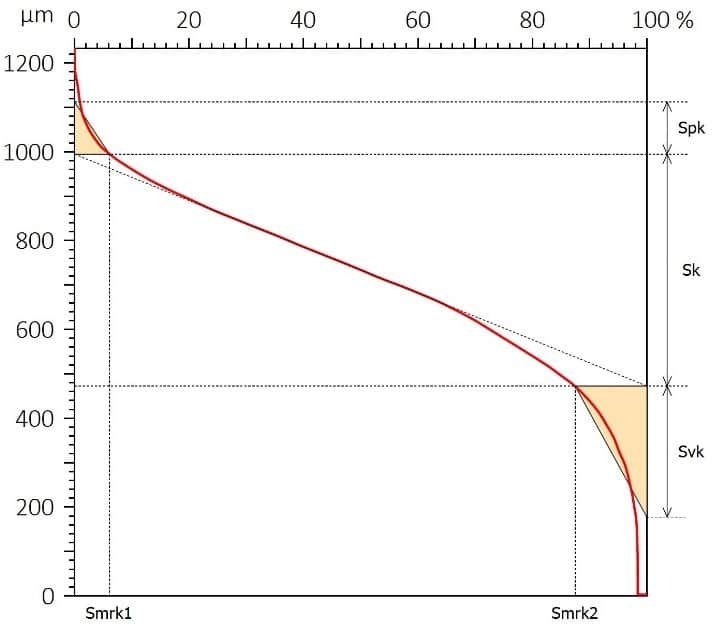
The Abbott-Firestone curve shows the cumulative areal material distribution of the blue climbing grip sample. This analysis defines functional surface parameters including Sk, Spk, and Svk according to ISO 25178-2.

Abbott-Firestone curve for the blue climbing grip sample showing cumulative areal material distribution and functional surface parameters.
Information
Standard ISO 25178-2
Parameter Value Unit
Sk 522.359 µm
Spk 117.670 µm
Szw 295.209 µm
Smrk1 6.122 %
Smrk2 87.456 %

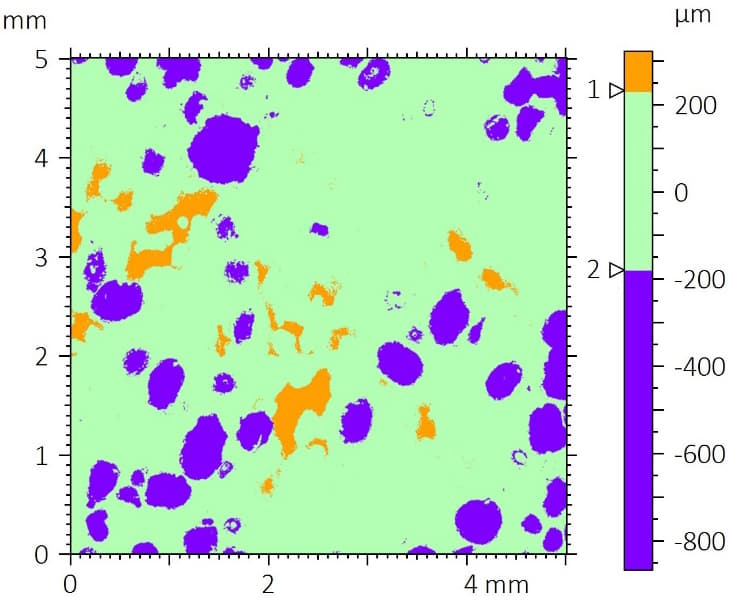
The chart below shows the peak-valley distribution from the mean plane based on the functional parameters derived from the Abbott-Firestone curve. Valleys are shown in purple, the mean plane in green, and peaks in orange.

Peak-valley distribution map of the blue climbing grip sample showing valleys, mean-plane regions, and peaks derived from Abbott-Firestone functional parameters.
Information
1st threshold Height – c1: 283.646 µm
2nd threshold Height – c2: -238.619 µm
Parameters Unit
Projected area (in %) % 12.544 81.334 6.122
Projected area mm² 3.182 20.629 1.553
Volume of material (in %) % 96.079 48.546 1.514
Volume of material µm³ 1.151 × 10¹⁰ 6.431 × 10⁹ 9.142 × 10⁷

The blue grip sample shows a dominant mean-plane region with fine, deep pores distributed across the surface and localized peak features. Compared with the yellow grip, the blue grip contains a higher projected peak area and a bimodal pore structure, combining fine recessed pores with larger crater-like valleys.

Wniosek

In this application, the NANOVEA JR25 Non-Contact Optical Profiler was used to measure the surface roughness, topography, and pore morphology of yellow and blue bouldering grip samples.

Topographic analysis showed that both grip samples had high surface roughness, with Sa values above 100 µm and Sz values above 1000 µm. Both surfaces also showed an asymmetric height distribution skewed toward valleys, indicating that recessed features played a major role in the measured surface morphology.

The yellow grip sample showed higher pore coverage, with pores covering 47.395% of the scanned surface. Its surface was mainly characterized by average-sized pores distributed across the measured area.

The blue grip sample showed lower pore coverage at 24.208%, but a much higher pore density of 31.355 particles/mm². Its pore distribution was bimodal, with a population of fine, deep pores and a separate population of larger crater-like valleys.

These results show how non-contact 3D optical profilometry can quantify grip-related surface features that are difficult to evaluate from visual inspection alone, including roughness, pore coverage, pore depth, surface height distribution, and functional topography.

Frequently Asked Questions About Climbing Hold Surface Roughness

What is climbing hold surface roughness?

Climbing hold surface roughness describes the height variation, texture, pores, asperities, and valleys present on the surface of a climbing grip. These features can influence contact behavior between the hold, shoe rubber, skin, chalk, and moisture.

How can climbing hold surface roughness be measured?

Climbing hold surface roughness can be measured using non-contact 3D optical profilometry. This method reconstructs the surface topography and calculates areal roughness parameters such as Sa, Sz, Sp, Sv, Ssk, and Sku without touching or deforming the sample.

Why use non-contact optical profilometry for climbing hold analysis?

Non-contact optical profilometry is useful for climbing hold analysis because climbing grips can contain deep pores, sharp valleys, rough asperities, and irregular surface texture. A contact stylus may lose contact, fail to reach recessed features, or introduce artifacts on complex surfaces.

What does Sa mean in surface roughness analysis?

Sa is the arithmetic mean height of a surface and is commonly used to describe average areal surface roughness. In this app note, both climbing grip samples showed high Sa values above 100 µm, indicating strongly textured surfaces.

What does Sz mean in optical profilometry results?

Sz is the maximum height of the measured surface, calculated from the highest peak to the deepest valley. In climbing hold surface roughness analysis, Sz helps describe the full vertical range of the grip’s surface texture.

Why is pore morphology important for climbing grips?

Pore morphology can affect how a climbing grip interacts with chalk, sweat, humidity, skin, and shoe rubber. Measuring pore coverage, density, depth, and volume helps quantify surface features that are difficult to evaluate by visual inspection alone.