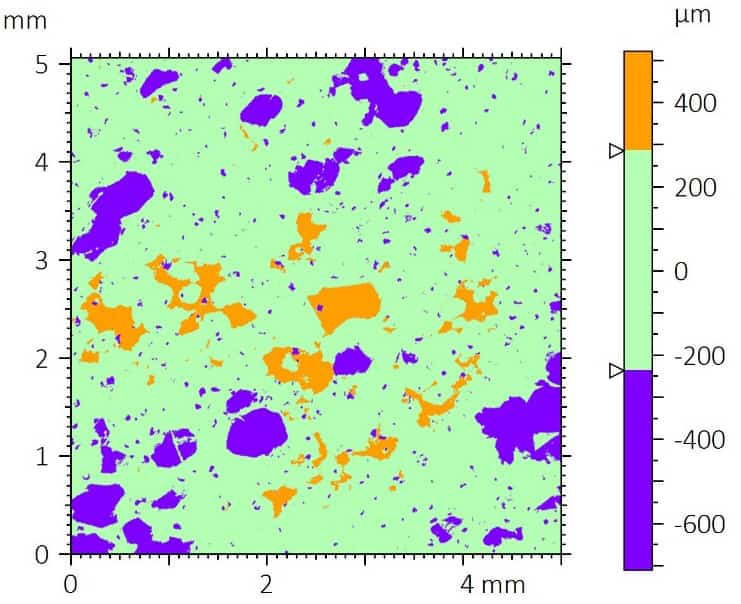
Peak-valley distribution map generated from optical profilometry data of the blue bouldering grip sample. The visualization separates valleys, mean-plane material, and peaks based on functional surface parameters derived from the Abbott-Firestone curve.
カテゴリー
- アプリケーションノート
- ブロック・オン・リングトライボロジー
- 腐食トライボロジー
- 摩擦試験|摩擦係数
- 高温機械試験
- 高温トライボロジー
- 湿度・ガス トライボロジー
- 湿度機械試験
- 圧痕|クリープとリラクゼーション
- 圧痕|破壊靭性
- 圧痕|硬度・弾性率
- 圧痕|紛失と保管
- 圧痕|応力と歪み
- 圧痕|降伏強度と疲労の関係
- ラボラトリーテスト
- リニアトライボロジー
- 液体機械試験
- 液状トライボロジー
- 低温トライボロジー
- メカニカルテスト
- プレスリリース
- プロフィロメトリー|平坦度・反り率
- プロフィロメトリー|幾何学と形状
- プロフィロメトリー|粗さと仕上がり
- プロフィロメトリー|段差の高さと厚み
- プロフィロメトリー|テクスチャーとグレーン
- プロフィロメトリー|体積・面積
- プロフィロメトリーテスト
- リング・オン・リング トライボロジー
- 回転トライボロジー
- スクラッチテスト|接着剤の不具合について
- スクラッチテスト|コヒーシブフェール
- スクラッチテスト|マルチパス摩耗
- スクラッチテスト|スクラッチハードネス
- スクラッチテスト トライボロジー
- トライボロジー試験
- 未分類
月別アーカイブ
- 2026年6月
- 2026年5月
- 2026年3月
- 2025年11月
- 2023年9月
- 2023年8月
- 2023年6月
- 2023年5月
- 2022年7月
- 2022年5月
- 2022年4月
- 2022年1月
- 2021年12月
- 2021年11月
- 2021年10月
- 2021年9月
- 2021年8月
- 2021年7月
- 2021年6月
- 2021年5月
- 2021年3月
- 2021年2月
- 2020年12月
- 2020年11月
- 2020年10月
- 2020年9月
- 2020年7月
- 2020年5月
- 2020年4月
- 2020年3月
- 2020年2月
- 2020年1月
- 2019年11月
- 2019年10月
- 2019年9月
- 2019年8月
- 2019年7月
- 2019年6月
- 2019年5月
- 2019年4月
- 2019年3月
- 2019年1月
- 2018年12月
- 2018年11月
- 2018年10月
- 2018年9月
- 2018年7月
- 2018年6月
- 2018年4月
- 2018年3月
- 2018年2月
- 2017年11月
- 2017年10月
- 2017年9月
- 2017年8月
- 2017年6月
- 2017年5月
- 2017年3月
- 2017年2月
- 2017年1月
- 2016年11月
- 2016年10月
- 2016年8月
- 2016年7月
- 2016年6月
- 2016年5月
- 2016年4月
- 2016年3月
- 2016年2月
- 2016年1月
- 2015年12月
- 2015年11月
- 2015年10月
- 2015年9月
- 2015年8月
- 2015年7月
- 2015年6月
- 2015年5月
- 2015年4月
- 2015年3月
- 2015年2月
- 2015年1月
- 2014年11月
- 2014年10月
- 2014年9月
- 2014年8月
- 2014年7月
- 2014年6月
- 2014年5月
- 2014年4月
- 2014年3月
- 2014年2月
- 2014年1月
- 2013年12月
- 2013年11月
- 2013年10月
- 2013年9月
- 2013年8月
- 2013年7月
- 2013年6月
- 2013年5月
- 2013年4月
- 2013年3月
- 2013年2月
- 2013年1月
- 2012年12月
- 2012年11月
- 2012年10月
- 2012年9月
- 2012年8月
- 2012年7月
- 2012年6月
- 2012年5月
- 2012年4月
- 2012年3月
- 2012年2月
- 2012年1月
- 2011年12月
- 2011年11月
- 2011年10月
- 2011年9月
- 2011年8月
- 2011年7月
- 2011年6月
- 2011年5月
- 2010年11月
- 2010年1月
- 2009年4月
- 2009年3月
- 2009年1月
- 2008年12月
- 2008年10月
- 2007年8月
- 2006年7月
- 2006年3月
- 2005年1月
- 2004年4月


