USA/GLOBAL: +1-949-461-9292
EUROPE: +39-011-3052-794
CONTACT US

Category: Profilometry | Geometry and Shape


Weld Surface Inspection Using a Portable 3D Profilometer

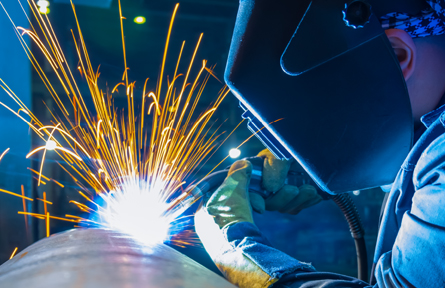
WELd surface inspection

using a portable 3d profilometer

Prepared by

CRAIG LEISING

INTRODUCTION

It may become critical for a particular weld, typically done by visual inspection, to be investigated with an extreme level of precision. Specific areas of interest for precise analysis include surface cracks, porosity and unfilled craters, regardless of subsequent inspection procedures. Weld characteristics such as dimension/shape, volume, roughness, size etc. can all be measured for critical evaluation.

IMPORTANCE OF 3D NON-CONTACT PROFILOMETER FOR WELD SURFACE INSPECTION

Unlike other techniques such as touch probes or interferometry, the NANOVEA 3D Non-Contact Profilometer, using axial chromatism, can measure nearly any surface, sample sizes can vary widely due to open staging and there is no sample preparation needed. Nano through macro range is obtained during surface profile measurement with zero influence from sample reflectivity or absorption, has advanced ability to measure high surface angles and there is no software manipulation of results. Easily measure any material: transparent, opaque, specular, diffusive, polished, rough etc. The 2D and 2D capabilities of the NANOVEA Portable Profilometers make them ideal instruments for full complete weld surface inspection both in the lab and in the field.

MEASUREMENT OBJECTIVE

In this application, the NANOVEA JR25 Portable Profiler is used to measure the surface roughness, shape and volume of a weld, as well as the surrounding area. This information can provide critical information to properly investigate the quality of the weld and weld process.

NANOVEA

JR25

TEST RESULTS

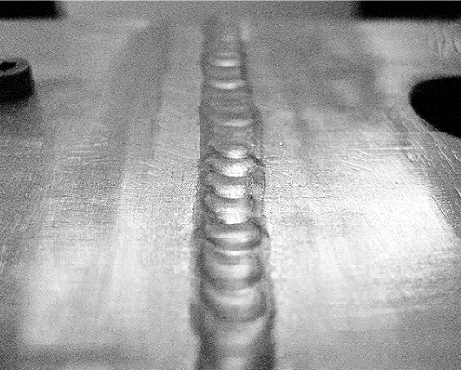
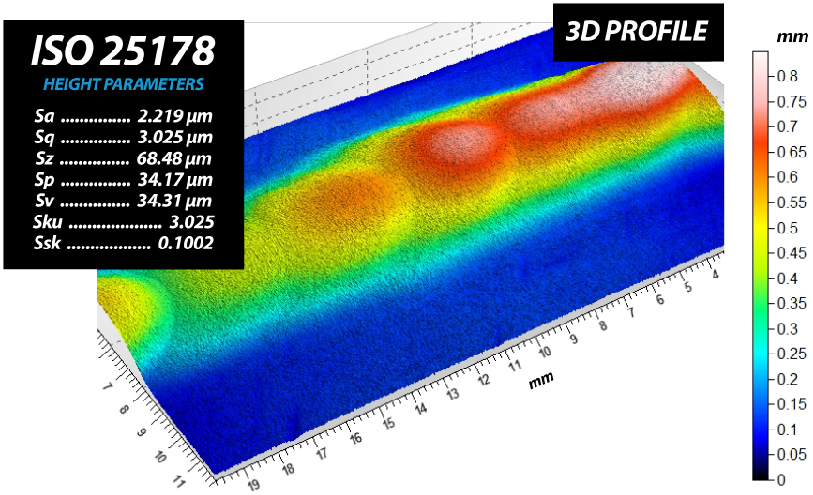
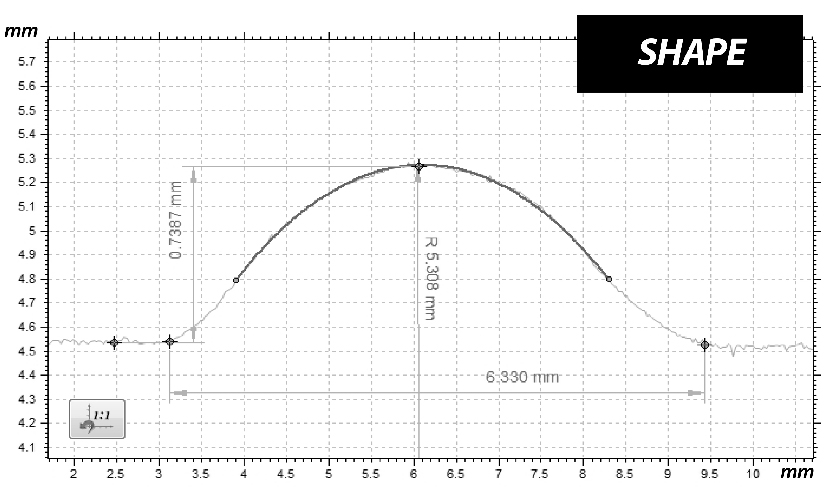
The image below shows the full 3D view of the weld and the surrounding area along with the surface parameters of the weld only. The 2D cross section profile is shown below.

the sample

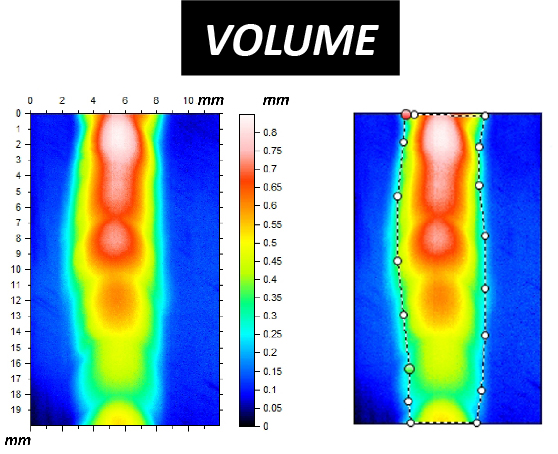
With the above 2D cross section profile removed from the 3D, dimensional information of the weld is calculated below. Surface area and volume of material calculated for the weld only below.

 HOLEPEAK
SURFACE1.01 mm214.0 mm2
VOLUME8.799e-5 mm323.27 mm3
MAX DEPTH/HEIGHT0.0276 mm0.6195 mm
MEAN DEPTH/HEIGHT 0.004024 mm 0.2298 mm

CONCLUSION

In this application, we have shown how the NANOVEA 3D Non-Contact Profiler can precisely characterize critical characteristics of a weld and the surrounding surface area. From the roughness, dimensions and volume, a quantitative method for quality and repeatability can be determined and or further investigated. Sample welds, such as the example in this app note, can be easily analyzed, with a standard tabletop or portable NANOVEA Profiler for in-house or field testing

NOW, LET'S TALK ABOUT YOUR APPLICATION

Fractography Analysis Using 3D Profilometry

FRACTOGRAPHY ANALYSIS

USING 3D PROFILOMETRY

Prepared by

CRAIG LEISING

INTRODUCTION

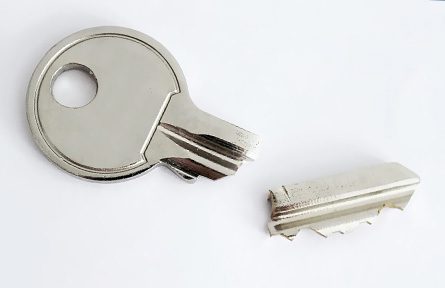
Fractography is the study of features on fractured surfaces and has historically been investigated via Microscope or SEM. Depending on the size of the feature, a microscope (macro features) or SEM (nano and micro features) are selected for the surface analysis. Both ultimately allowing for the identification of the fracture mechanism type. Although effective, the Microscope has clear limitations and the SEM in most cases, other than atomic-level analysis, is unpractical for fracture surface measurement and lacks broader use capability. With advances in optical measurement technology, the NANOVEA 3D Non-Contact Profilometer is now considered the instrument of choice, with its ability to provide nano through macro-scale 2D & 3D surface measurements

IMPORTANCE OF 3D NON-CONTACT PROFILOMETER FOR FRACTURE INSPECTION

Unlike an SEM, a 3D Non-Contact Profilometer can measure nearly any surface, sample size, with minimal sample prep, all while offering superior vertical/horizontal dimensions to that of an SEM. With a profiler, nano through macro range features are captured in a single measurement with zero influence from sample reflectivity. Easily measure any material: transparent, opaque, specular, diffusive, polished, rough etc. The 3D Non-Contact Profilometer provides broad and user-friendly capability to maximize surface fracture studies at a fraction of the cost of an SEM.

MEASUREMENT OBJECTIVE

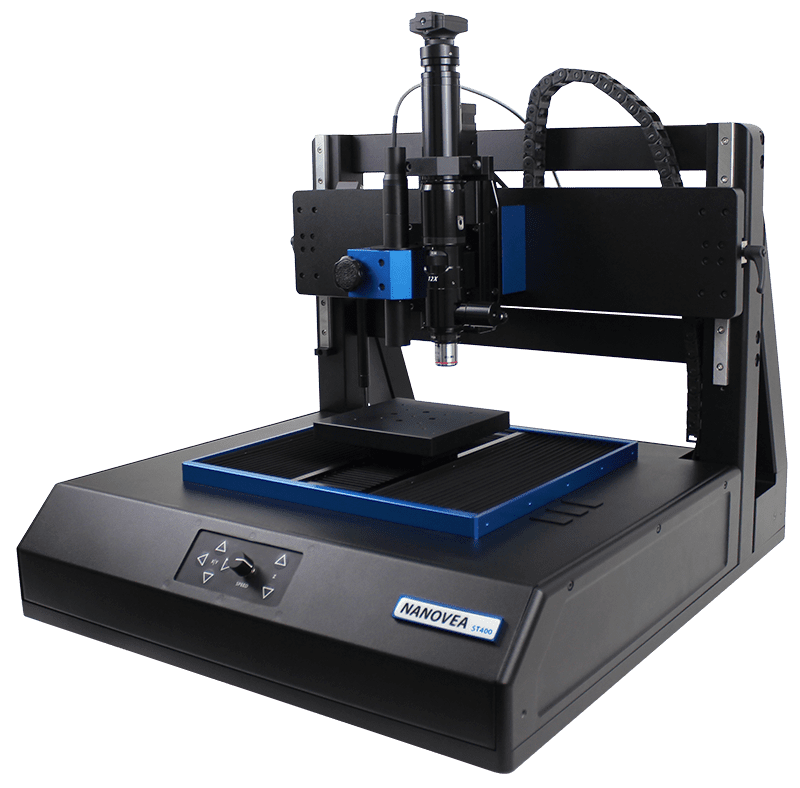
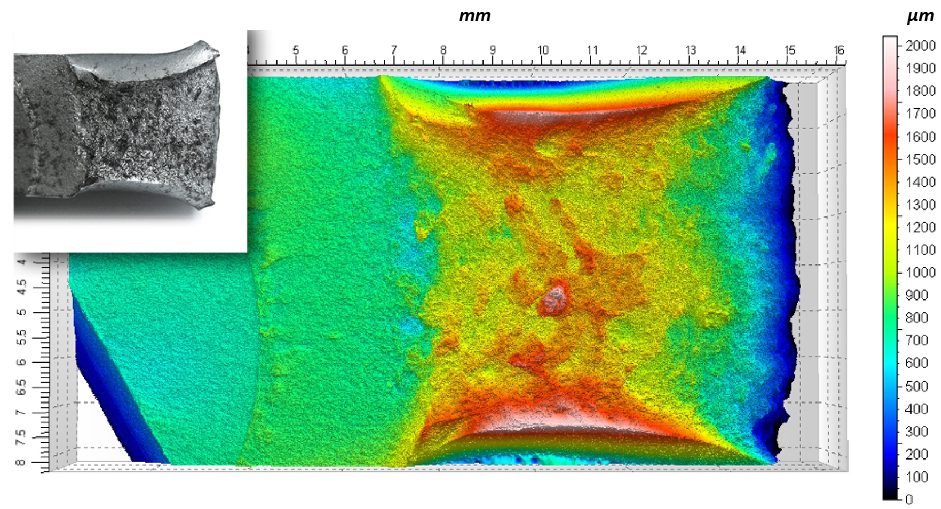
In this application, the NANOVEA ST400 is used to measure the fractured surface of a steel sample. In this study, we will showcase a 3D area, 2D profile extraction and surface directional map of the surface.

NANOVEA

ST400

RESULTS

TOP SURFACE

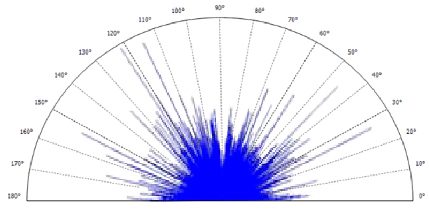
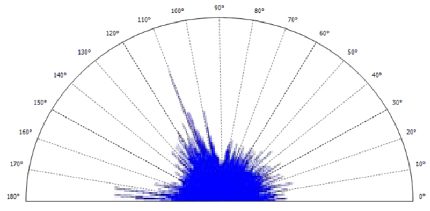
3D Surface Texture Direction

Isotropy51.26%
First Direction123.2º
Second Direction116.3º
Third Direction0.1725º

Surface Area, Volume, Roughness and many others can be automatically calculated from this extraction.

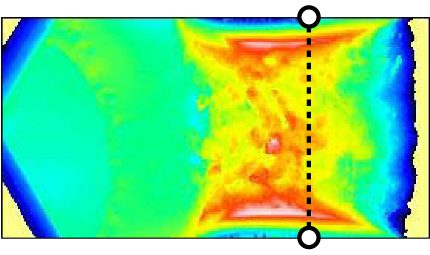
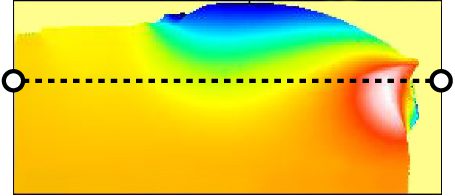
2D Profile Extraction

RESULTS

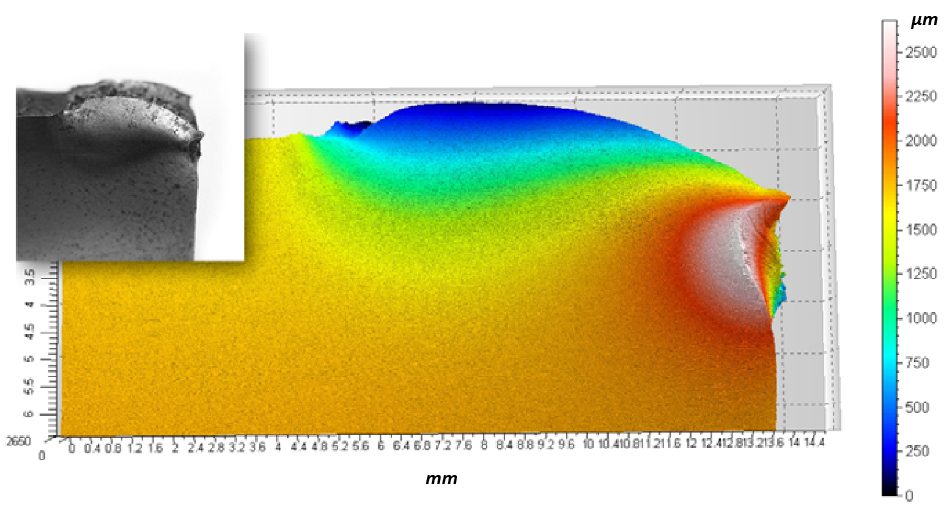
SIDE SURFACE

3D Surface Texture Direction

Isotropy15.55%
First Direction0.1617º
Second Direction110.5º
Third Direction171.5º

Surface Area, Volume, Roughness and many others can be automatically calculated from this extraction.

2D Profile Extraction

CONCLUSION

In this application, we have shown how the NANOVEA ST400 3D Non-Contact Profilometer can precisely characterize the full topography (nano, micro and macro features) of a fractured surface. From the 3D area, the surface can be clearly identified and subareas or profiles/cross-sections can be quickly extracted and analyzed with an endless list of surface calculations. Sub nanometer surface features can be further analyzed with an integrated AFM module.

Additionally, NANOVEA has included a portable version to their Profilometer line-up, especially critical for field studies where a fracture surface is immovable. With this broad list of surface measurement capabilities, fracture surface analysis has never been easier and more convenient with a single instrument.

NOW, LET'S TALK ABOUT YOUR APPLICATION

Polymer Belt Wear and Friction using a Tribometer

POLYMER BELTS

WEAR AND FRICTION USING a TRIBOMETER

Prepared by

DUANJIE LI, PhD

INTRODUCTION

Belt drive transmits power and tracks relative movement between two or more rotating shafts. As a simple and inexpensive solution with minimal maintenance, belt drives are widely used in a variety of applications, such as bucksaws, sawmills, threshers, silo blowers and conveyors. Belt drives can protect the machinery from overload as well as damp and isolate vibration.

IMPORTANCE OF WEAR EVALUATION FOR BELT DRIVES

Friction and wear are inevitable for the belts in a belt-driven machine. Sufficient friction ensures effective power transmission without slipping, but excessive friction may rapidly wear the belt. Different types of wear such as fatigue, abrasion and friction take place during the belt drive operation. In order to extend the lifetime of the belt and to cut the cost and time on belt repairing and replacement, reliable evaluation of the wear performance of the belts is desirable in improving belt lifespan, production efficiency and application performance. Accurate measurement of the coefficient of friction and wear rate of the belt facilitates R&D and quality control of belt production.

MEASUREMENT OBJECTIVE

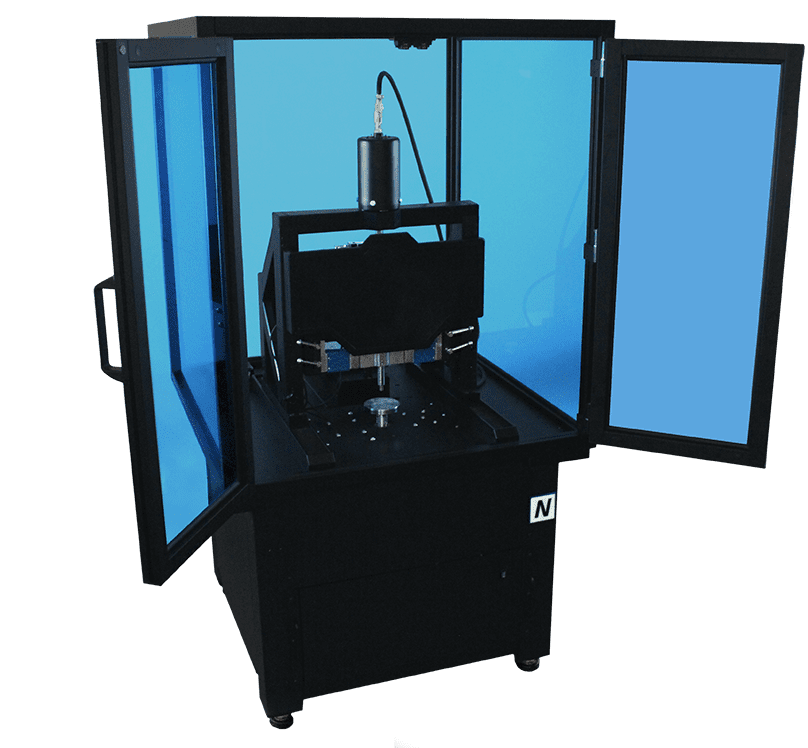
In this study, we simulated and compared the wear behaviors of belts with different surface textures to showcase the capacity of the NANOVEA T2000 Tribometer in simulating the wear process of the belt in a controlled and monitored manner.

NANOVEA

T2000

TEST PROCEDURES

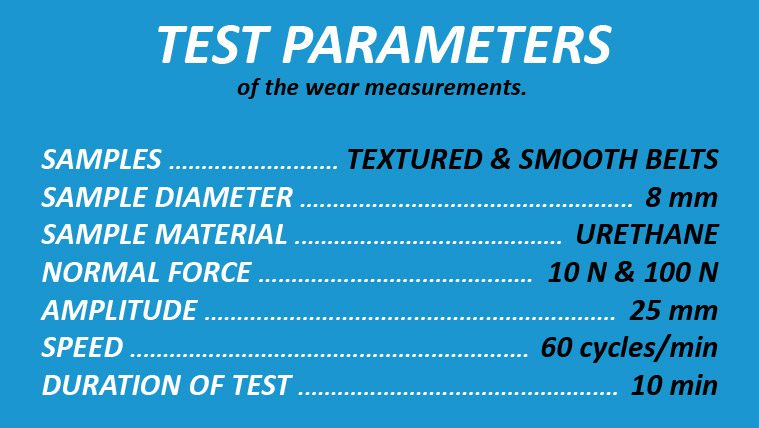
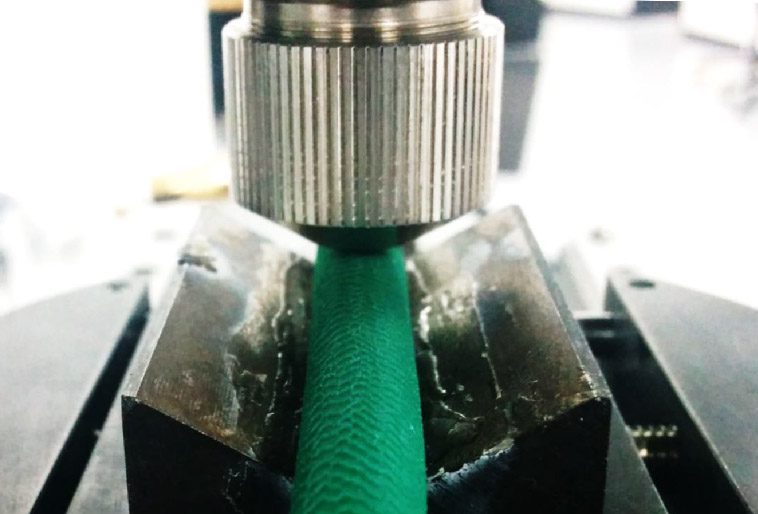
The coefficient of friction, COF, and the wear resistance of two belts with different surface roughness and texture were evaluated by the NANOVEA High-Load Tribometer using Linear Reciprocating Wear Module. A Steel 440 ball (10 mm diameter) was used as the counter material. The surface roughness and wear track were examined using an integrated 3D Non-Contact profilometer. The wear rate, K, was evaluated using the formula K=Vl(Fxs), where V is the worn volume, F is the normal load and s is the sliding distance.


Please note that a smooth Steel 440 ball counterpart was used as an example in this study, any solid material with different shapes and surface finish can be applied using custom fixtures to simulate the actual application situation.

RESULTS & DISCUSSION

The Textured Belt and Smooth Belt have a surface roughness Ra of 33.5 and 8.7 um, respectively, according to the analyzed surface profiles taken with a NANOVEA 3D Non-Contact Optical profiler. The COF and wear rate of the two tested belts were measured at 10 N and 100 N, respectively, to compare the wear behavior of the belts at different loads.

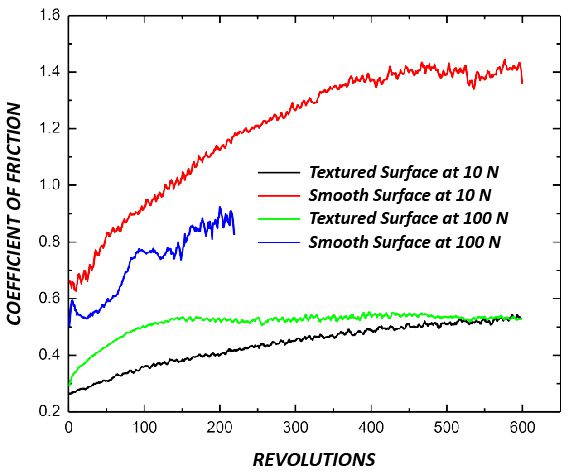
FIGURE 1 shows the evolution of COF of the belts during the wear tests. The belts with different textures exhibit substantially different wear behaviors. It is interesting that after the run-in period during which the COF progressively increases, the Textured Belt reaches a lower COF of ~0.5 in both the tests conducted using loads of 10 N and 100 N. In comparison, the Smooth Belt tested under the load of 10 N exhibits a significantly higher COF of~ 1.4 when the COF gets stable and maintains above this value for the rest of the test. The Smooth Belt tested under the load of 100 N rapidly was worn out by the steel 440 ball and formed a large wear track. The test was therefore stopped at 220 revolutions.

FIGURE 1: Evolution of COF of the belts at different loads.

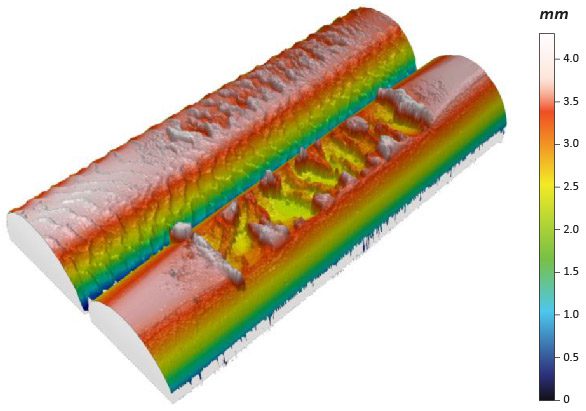
FIGURE 2 compares the 3D wear track images after the tests at 100 N. The NANOVEA 3D non-contact profilometer offers a tool to analyze the detailed morphology of the wear tracks, providing more insight in fundamental understanding of wear mechanism.

TABLE 1: Result of wear track analysis.

FIGURE 2:  3D view of the two belts
after the tests at 100 N.

The 3D wear track profile allows direct and accurate determination of the wear track volume calculated by the advanced analysis software as shown in TABLE 1. In a wear test for 220 revolutions, the Smooth Belt has a much larger and deeper wear track with a volume of 75.7 mm3, compared to a wear volume of 14.0 mm3 for the Textured Belt after a 600-revolution wear test. The significantly higher friction of the Smooth Belt against the steel ball leads to a 15 fold higher wear rate compared to the Textured Belt.


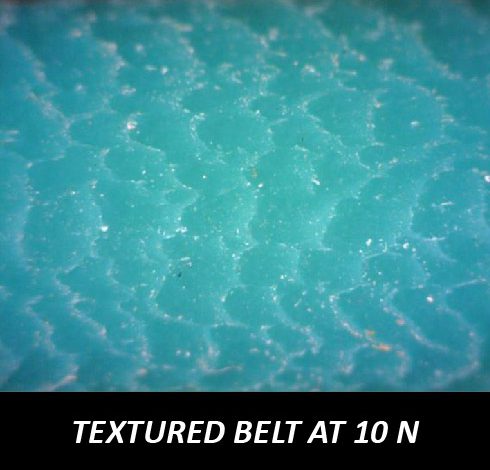
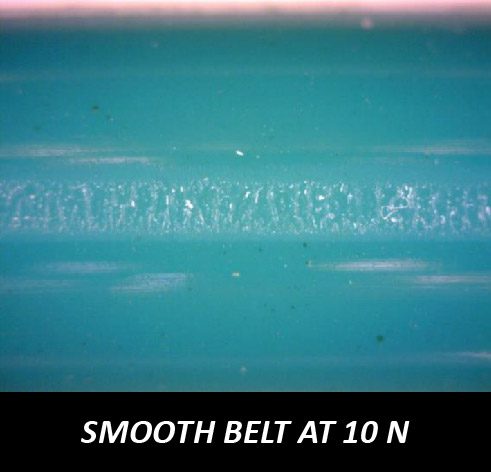
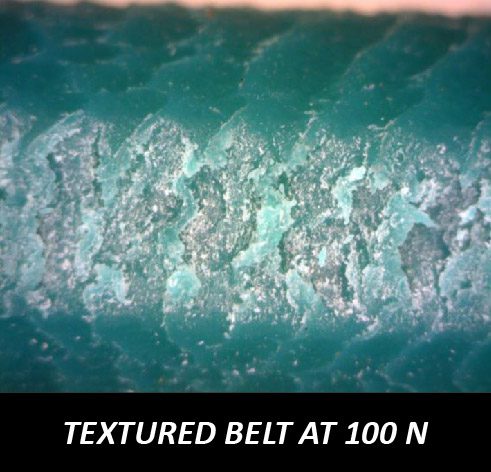
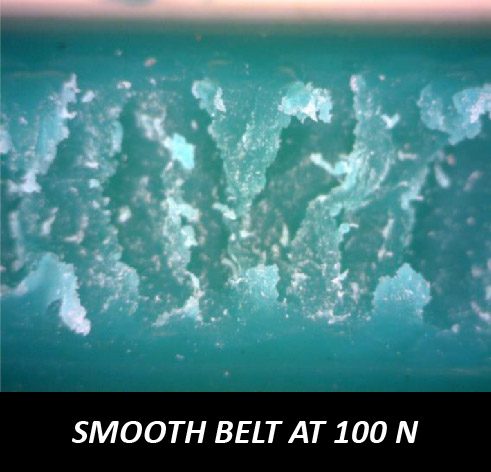
Such a drastic difference of COF between the Textured Belt and Smooth Belt is possibly related to the size of the contact area between the belt and the steel ball, which also leads to their different wear performance. FIGURE 3 shows the wear tracks of the two belts under the optical microscope. The wear track examination is in agreement with the observation on COF evolution: The Textured Belt, which maintains a low COF of ~0.5, exhibits no sign of wear after the wear test under a load of 10 N. The Smooth Belt shows a small wear track at 10 N. The wear tests carried out at 100 N create substantially larger wear tracks on both the Textured and Smooth Belts, and the wear rate will be calculated using 3D profiles as will be discussed in the following paragraph.

FIGURE 3:  Wear tracks under optical microscope.

CONCLUSION

In this study, we showcased the capacity of the NANOVEA T2000 Tribometer in evaluating the coefficient of friction and wear rate of belts in a well-controlled and quantitative manner. The surface texture plays a critical role in the friction and wear resistance of the belts during their service performance. The textured belt exhibits a stable coefficient of friction of ~0.5 and possesses a long lifetime, which results in reduced time and cost on tool repairing or replacement. In comparison, the excessive friction of the smooth belt against the steel ball rapidly wears the belt. Further, the loading on the belt is a vital factor of its service lifetime. Overload creates very high friction, leading to accelerated wear to the belt.

The NANOVEA T2000 Tribometer offers precise and repeatable wear and friction testing using ISO and ASTM compliant rotative and linear modes, with optional high temperature wear, lubrication and tribocorrosion modules available in one pre-integrated system. NANOVEA’s unmatched range is an ideal solution for determining the full range of tribological properties of thin or thick, soft or hard coatings, films and substrates.

NOW, LET'S TALK ABOUT YOUR APPLICATION

Fossil Microstructure Using 3D Profilometry

FOSSIL MICROSTRUCTURE

USING 3D PROFILOMETRY

Prepared by

DUANJIE LI, PhD

INTRODUCTION

Fossils are the preserved remains of traces of plants, animals and other organisms buried in sediment under ancient seas, lakes and rivers. The soft body tissue usually decays after death, but the hard shells, bones and teeth fossilize. Microstructure surface features are often preserved when mineral replacement of the original shells and bones takes place, which provides an insight into the evolution of weather and the formation mechanism of fossils.

IMPORTANCE OF A 3D NON-CONTACT PROFILOMETER FOR FOSSIL EXAMINATION

3D profiles of the fossil enable us to observe the detailed surface features of the fossil sample from a closer angle. The high resolution and accuracy of the NANOVEA profilometer may not be discernible by the naked eye. The profilometer’s analysis software offers a wide range of studies applicable to these unique surfaces. Unlike other techniques such as touch probes, the NANOVEA 3D Non-Contact Profilometer measures the surface features without touching the sample. This allows for the preservation of the true surface features of certain delicate fossil samples. Moreover, the portable model Jr25 profilometer enables 3D measurement on fossil sites, which substantially facilitates fossil analysis and protection after excavation.

MEASUREMENT OBJECTIVE

In this study, the NANOVEA Jr25 Profilometer is used to measure the surface of two representative fossil samples. The entire surface of each fossil was scanned and analyzed in order to characterize its surface features which include roughness, contour and texture direction.

NANOVEA

Jr25

BRACHIOPOD FOSSIL

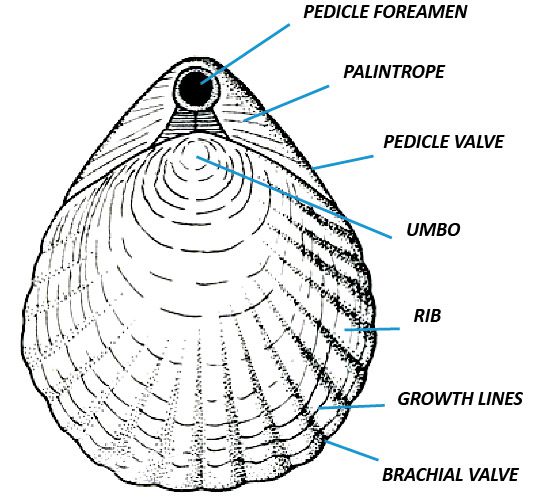
The first fossil sample presented in this report is a Brachiopod fossil, which came from a marine animal that has hard “valves” (shells) on its upper and lower surfaces. They first appeared in the Cambrian period, which is more than 550 million years ago.

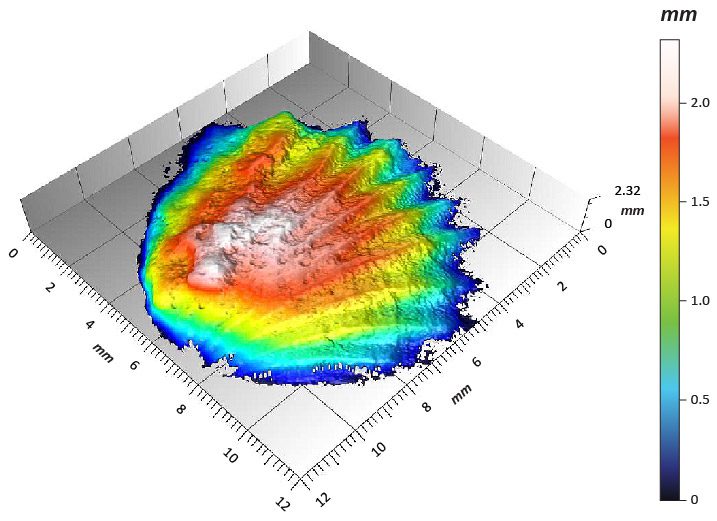
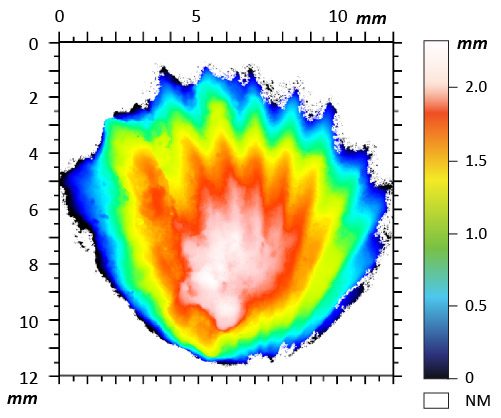
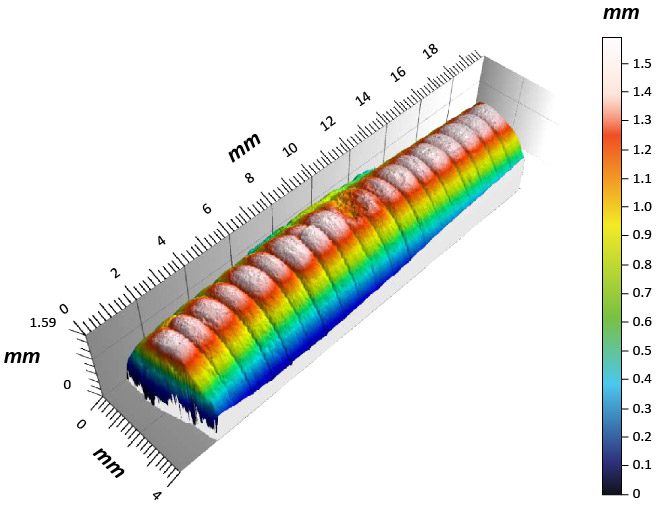
The 3D View of the scan is shown in FIGURE 1 and False Color View is shown in FIGURE 2. 

FIGURE 1: 3D View of the Brachiopod fossil sample.

FIGURE 2: False Color View of the Brachiopod fossil sample.

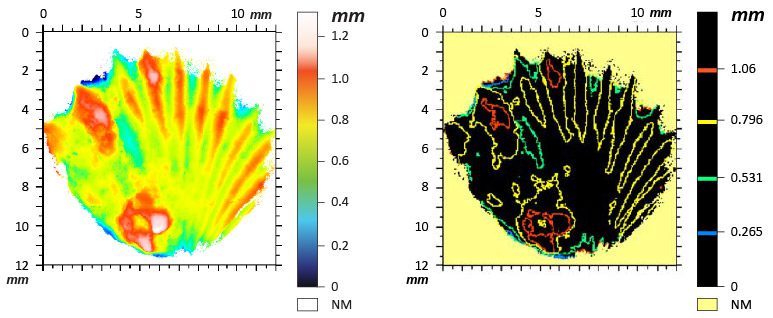
The overall form was then removed from the surface in order to investigate the local surface morphology and contour of the Brachiopod fossil as shown in FIGURE 3. A peculiar divergent groove texture can now be observed on the Brachiopod fossil sample.

FIGURE 3: False Color View and Contour Lines View after form removal.

A line profile is extracted from the textured area to show a crossectional view of the fossil surface in FIGURE 4. The Step Height study measures precise dimensions of the surface features. The grooves possess an average width of ~0.38 mm and depth of ~0.25 mm.

FIGURE 4: Line profile and Step Height studies of the textured surface.

CRINOID STEM FOSSIL

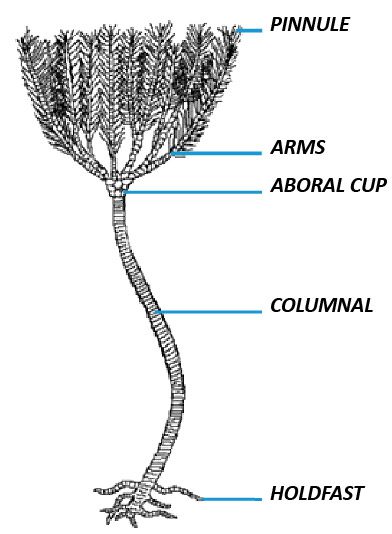
The second fossil sample is a Crinoid stem fossil. Crinoids first appeared in the seas of the Middle Cambrian Period, about 300 million years before dinosaurs. 


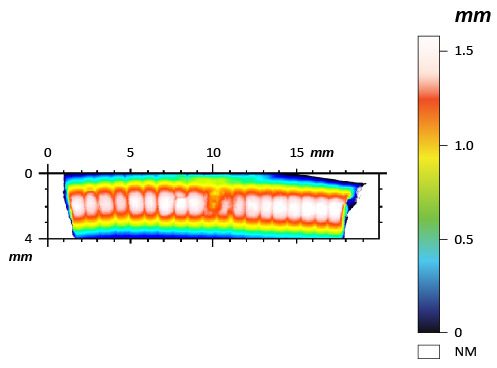
The 3D View of the scan is shown in FIGURE 5 and False Color View is shown in FIGURE 6. 

FIGURE 5: 3D View of the Crinoid fossil sample.

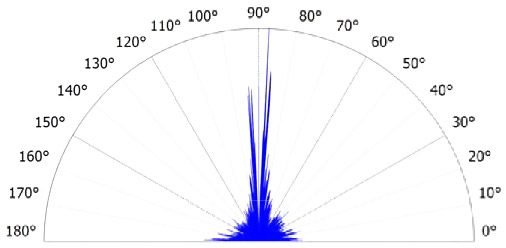
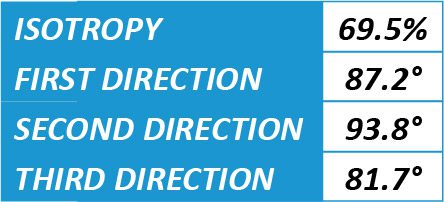
The surface texture isotropy and roughness of the Crinoid stem fossil are analyzed in FIGURE 7. 

 This fossil has a preferential texture direction in the angle close to 90°, leading to texture isotropy of 69%.

FIGURE 6: False Color View of the Crinoid stem sample.


FIGURE 7: Surface texture isotropy and roughness of the Crinoid stem fossil.

The 2D profile along the axial direction of the Crinoid stem fossil is shown in FIGURE 8. 

The size of the peaks of the surface texture is fairly uniform.

FIGURE 8: 2D profile analysis of the Crinoid stem fossil.

CONCLUSION

In this application, we comprehensively studied the 3D surface features of a Brachiopod and Crinoid stem fossil using the NANOVEA Jr25 Portable Non-Contact Profilometer. We showcase that the instrument can precisely characterize the 3D morphology of the fossil samples. The interesting surface features and texture of the samples are then further analyzed. The Brachiopod sample possesses a divergent groove texture, while the Crinoid stem fossil shows  preferential texture isotropy. The detailed and precise 3D surface scans prove to be ideal tools for palaeontologists and geologists to study the evolution of lives and the formation of fossils.

The data shown here represent only a portion of the calculations available in the analysis software. NANOVEA Profilometers measure virtually any surface in fields including Semiconductor, Microelectronics, Solar, Fiber Optics, Automotive, Aerospace, Metallurgy, Machining, Coatings, Pharmaceutical, Biomedical, Environmental and many others.

NOW, LET'S TALK ABOUT YOUR APPLICATION

Styrofoam Surface Boundary Measurement Profilometry

Surface Boundary Measurement

Surface Boundary Measurement Using 3D Profilometry

Learn more

SURFACE BOUNDARY MEASUREMENT

USING 3D PROFILOMETRY

Prepared by

Craig Leising

INTRODUCTION

In studies where the interface of surface features, patterns, shapes etc., are being evaluated for orientation, it will be useful to quickly identify areas of interest over the entire profile of measurement. By segmenting a surface into significant areas the user can quickly evaluate boundaries, peaks, pits, areas, volumes and many others to understand their functional role in the entire surface profile under study. For example, like that of a grain boundary imaging of metals, the importance of analysis is the interface of many structures and their overall orientation. By understanding each area of interest defects and or abnormalities within the overall area can be identified. Although grain boundary imaging is typically studied at a range surpassing Profilometer capability, and is only 2D image analysis, it is a helpful reference to illustrate the concept of what will be shown here on a larger scale along with 3D surface measurement advantages.

IMPORTANCE OF 3D NON CONTACT PROFILOMETER FOR SURFACE SEPARATION STUDY

Unlike other techniques such as touch probes or interferometry, the 3D Non Contact Profilometer, using axial chromatism, can measure nearly any surface, sample sizes can vary widely due to open staging and there is no sample preparation needed. Nano through macro range is obtained during surface profile measurement with zero influence from sample reflectivity or absorption, has advanced ability to measure high surface angles and there is no software manipulation of results. Easily measure any material: transparent, opaque, specular, diffusive, polished, rough etc. The technique of the Non Contact Profilometer provides an ideal, broad and user friendly capability to maximize surface studies when surface boundary analysis will be needed; along with the benefits of combined 2D & 3D capability.

MEASUREMENT OBJECTIVE

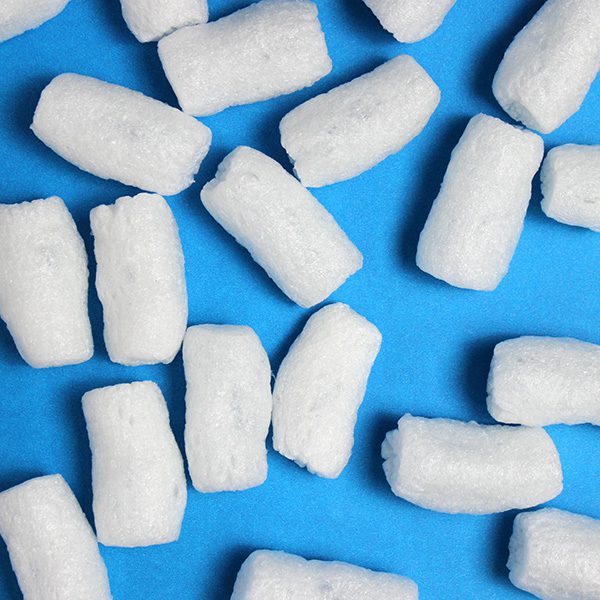
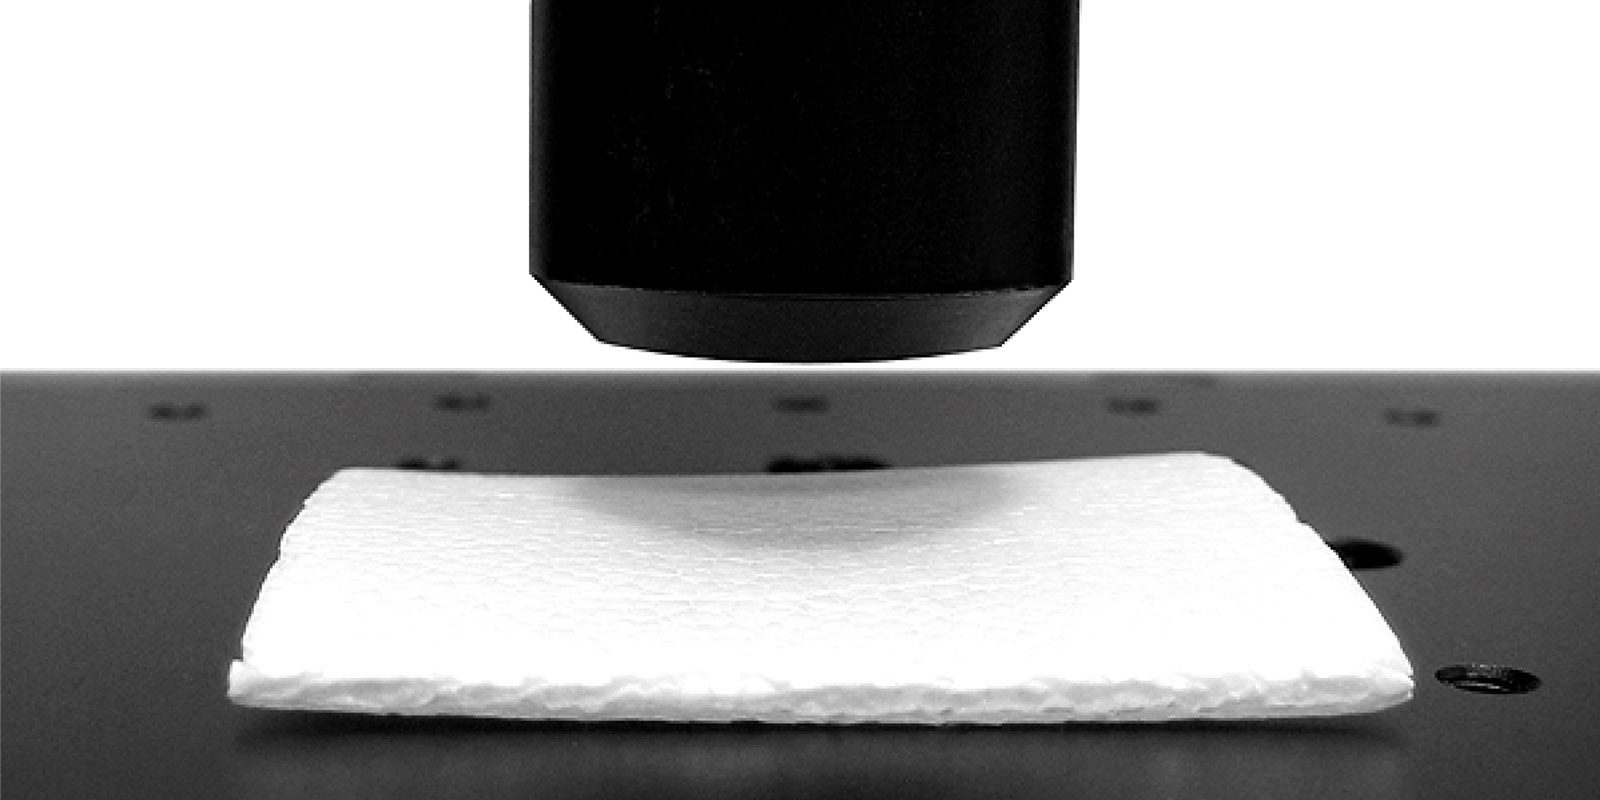
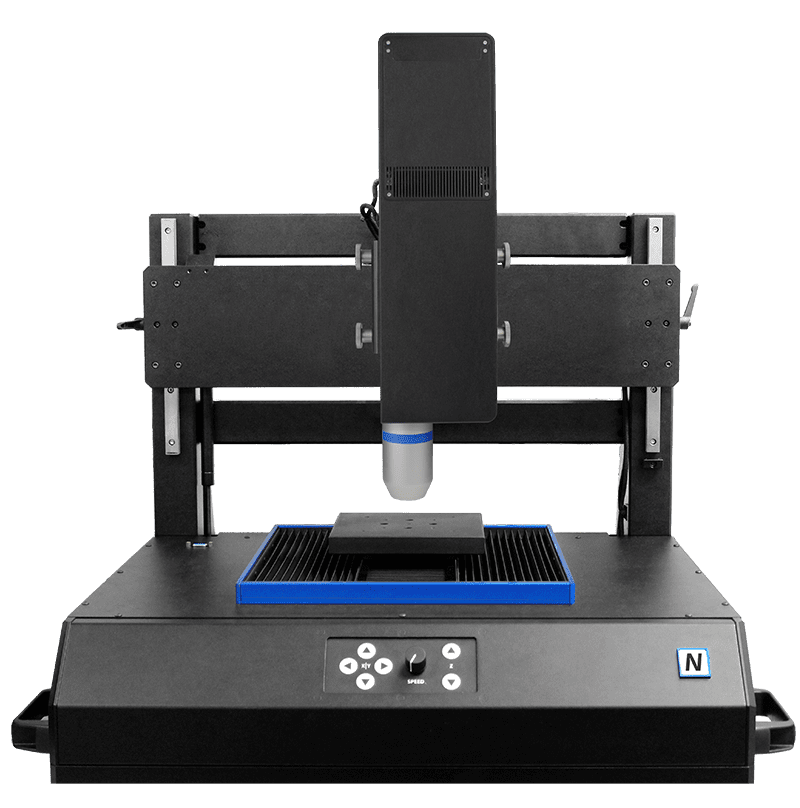
In this application the Nanovea ST400 Profilometer is used to measure the surface area of Styrofoam. Boundaries were established by combining a reflected intensity file along with the topography, which are simultaneously acquired using the NANOVEA ST400. This data was then used to calculate different shape and size information of each Styrofoam “grain”.

NANOVEA

ST400

RESULTS & DISCUSSION: 2D Surface Boundary Measurement

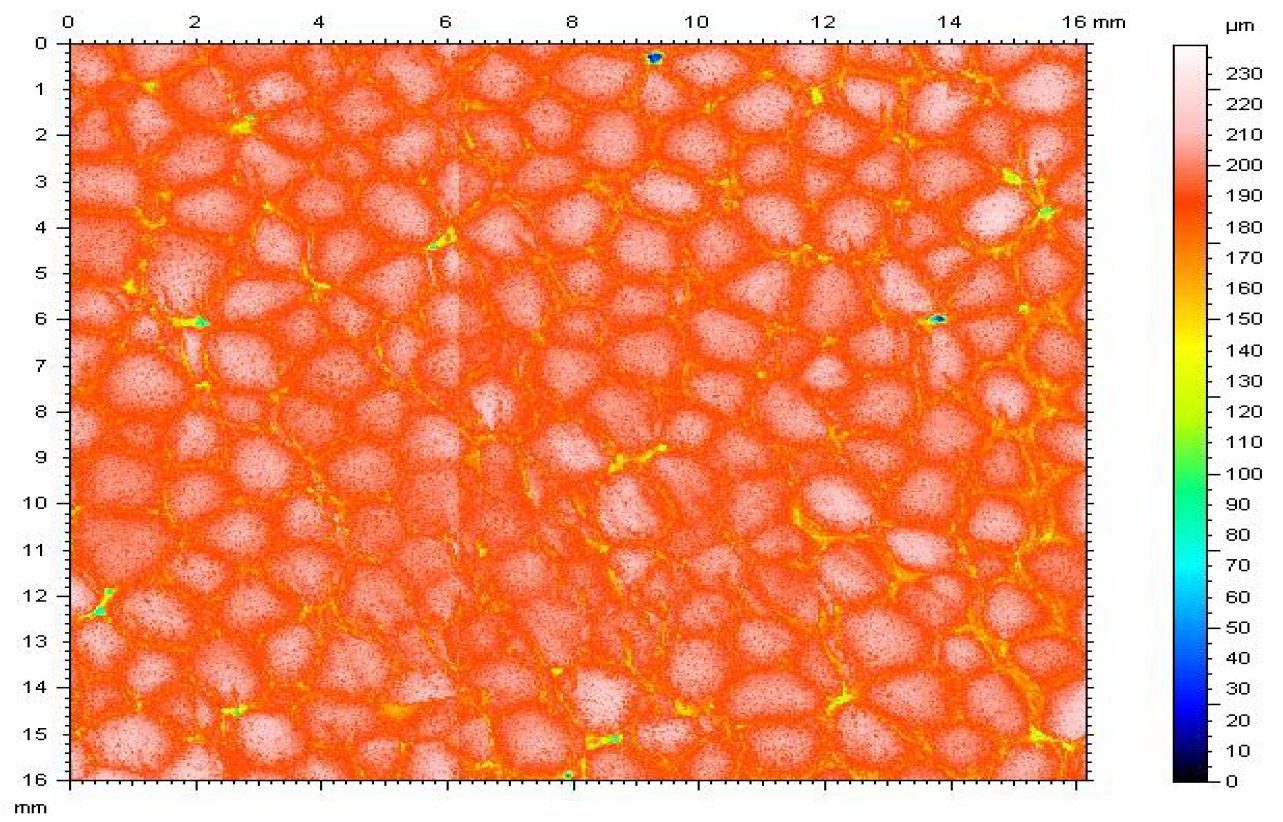
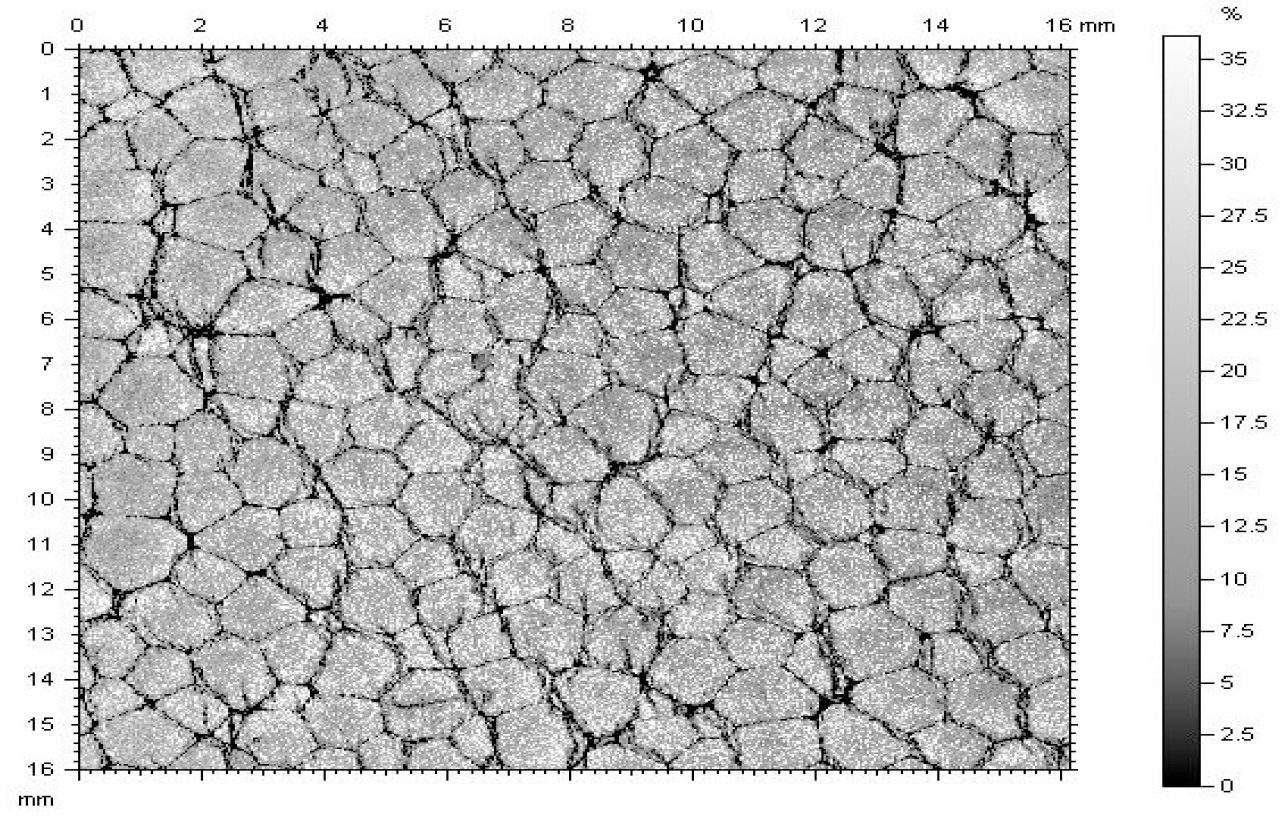
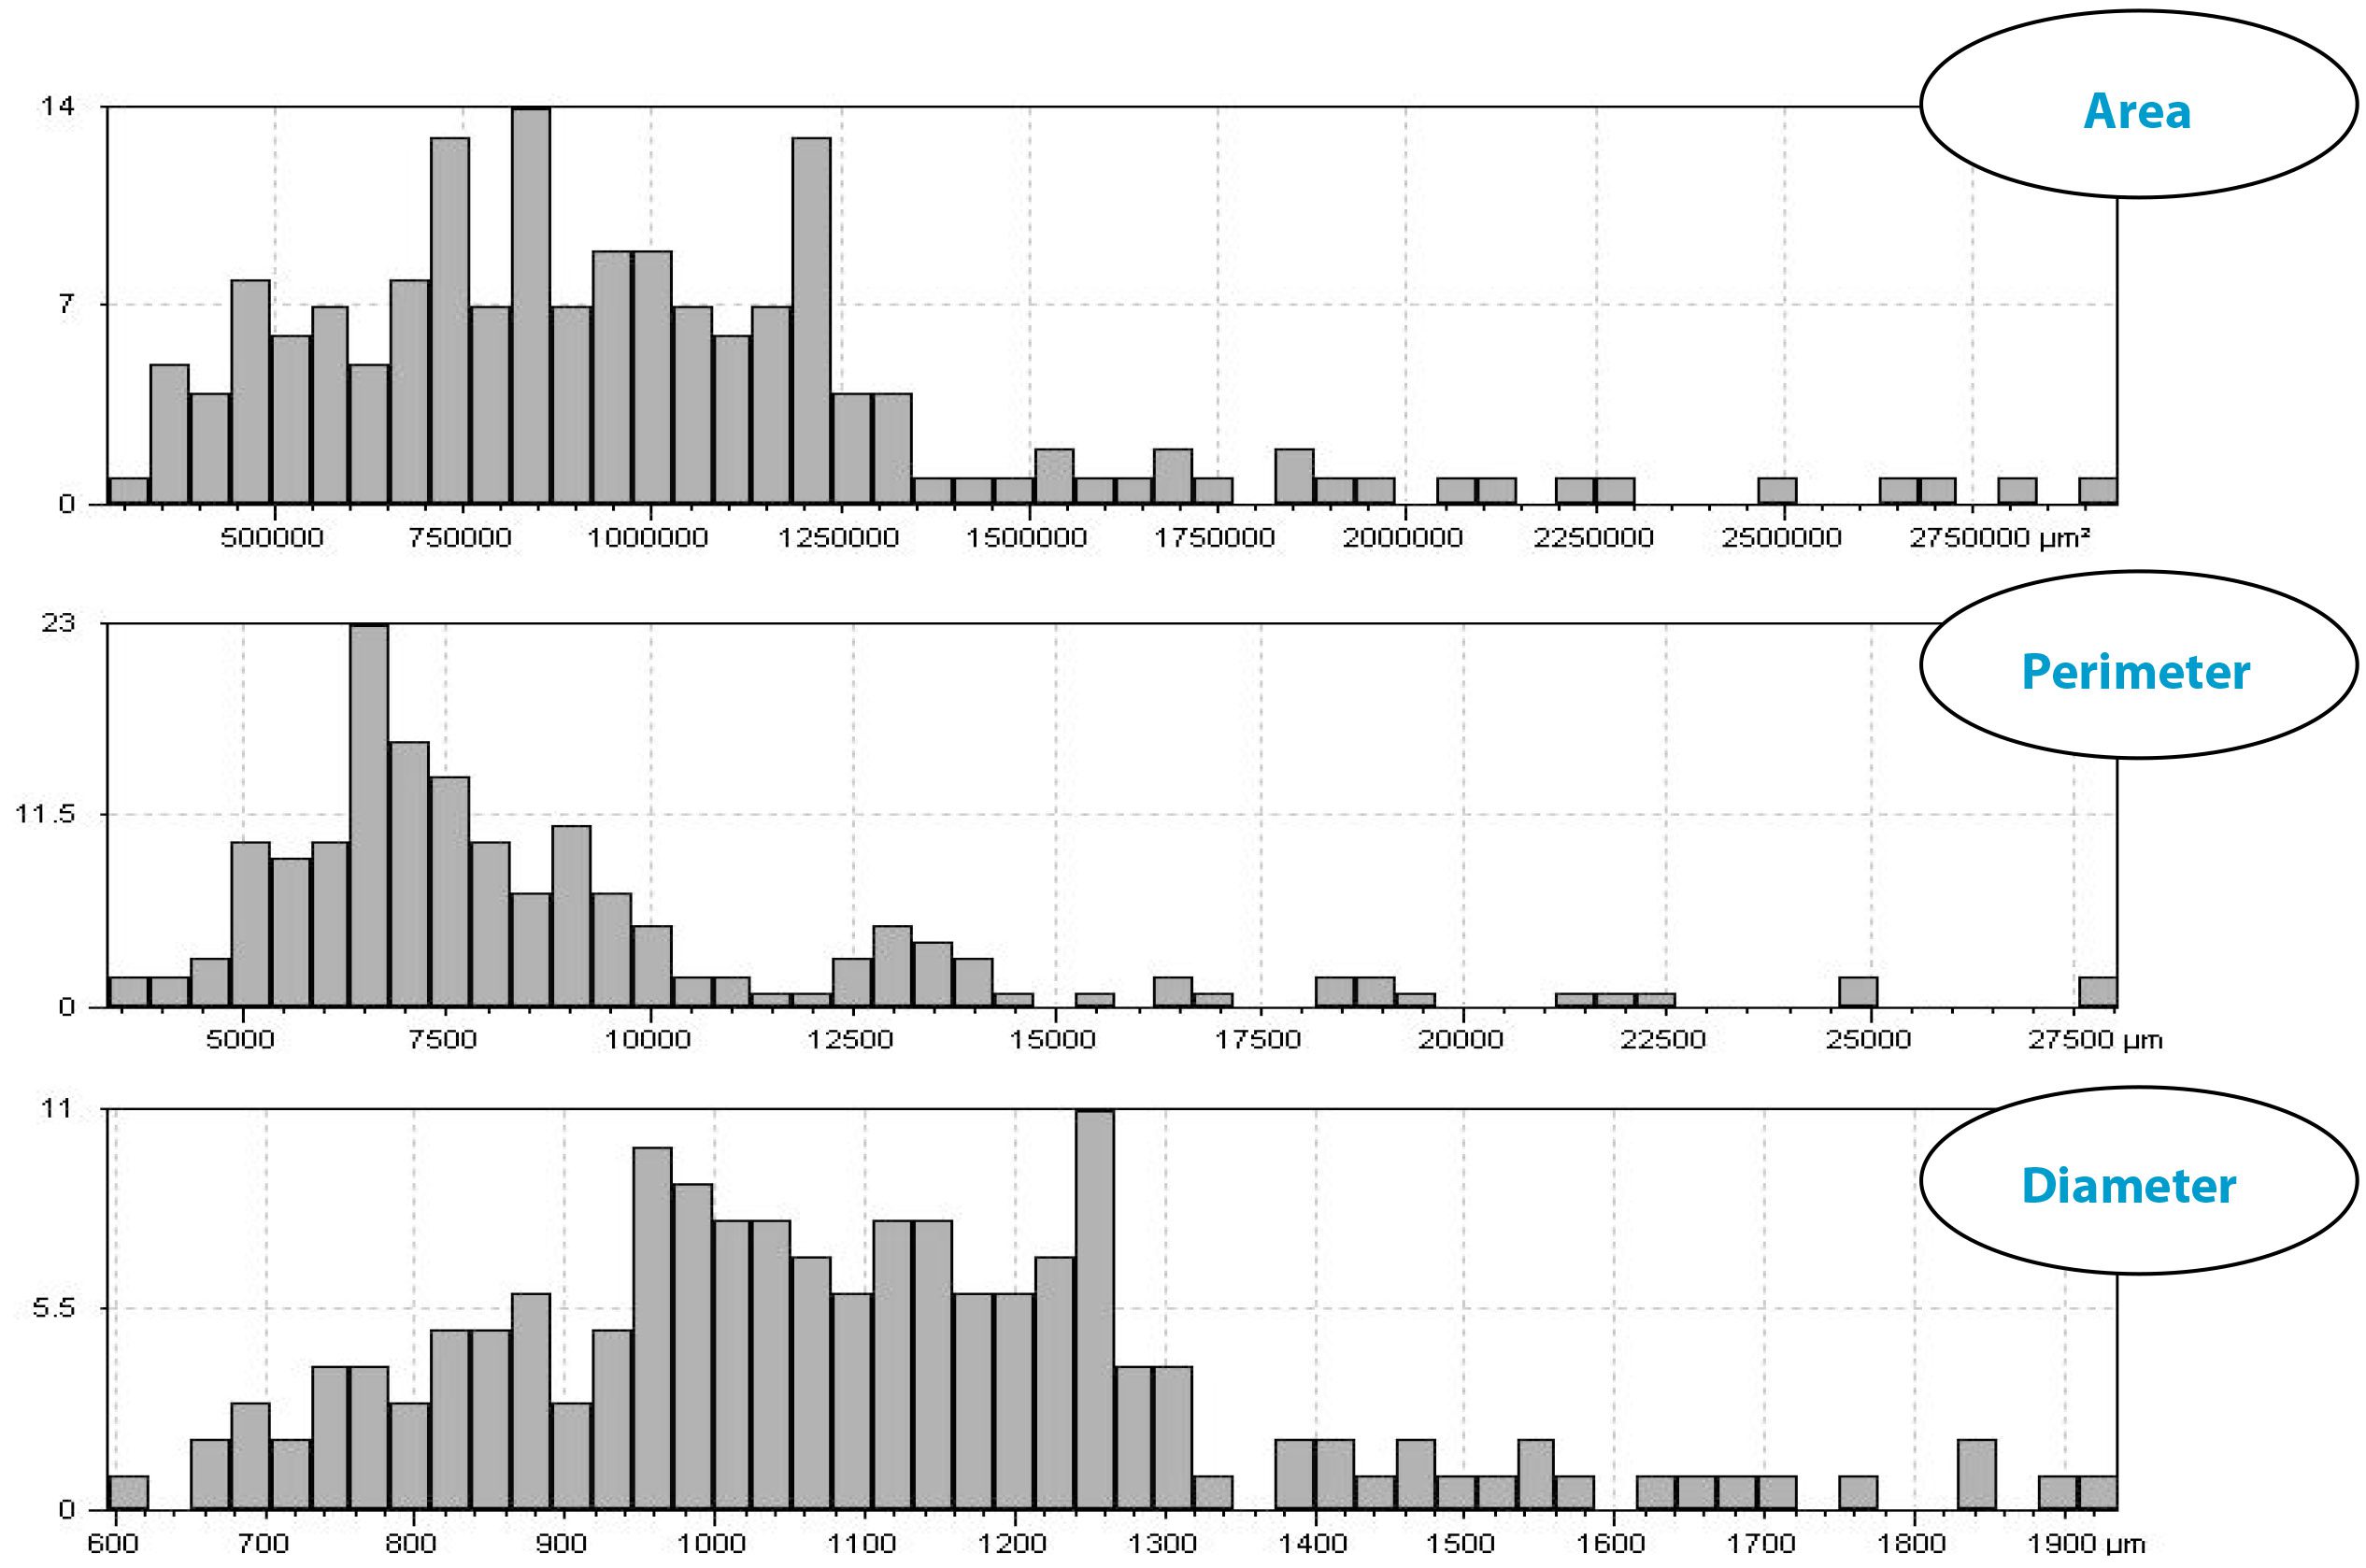
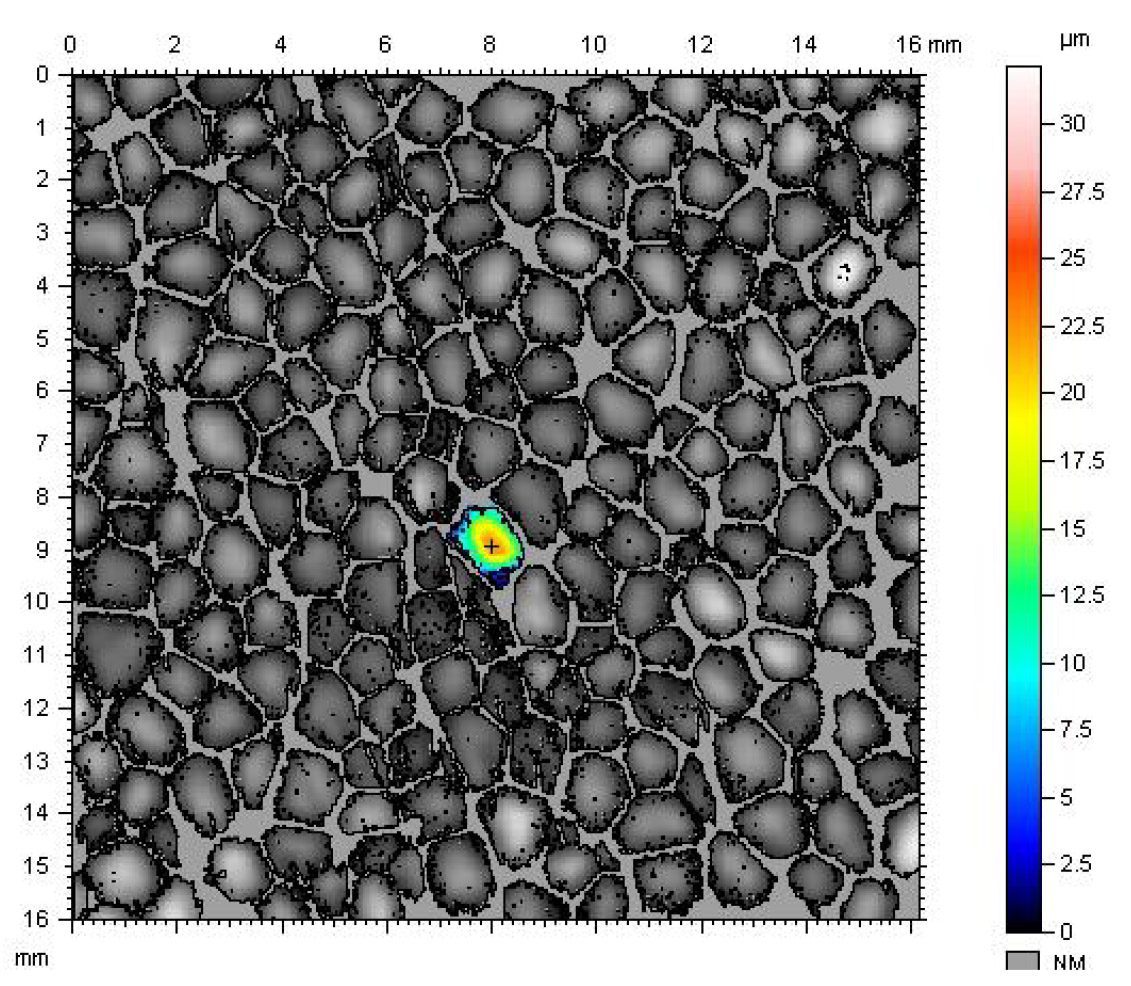
Topography image(below left) masked by reflected intensity image(below right) to clearly define grain boundaries. All grains below 565µm diameter have been ignored by applying filter.

Total number of grains: 167
Total projected area occupied by the grains: 166.917 mm² (64.5962 %)
Total projected area occupied by boundaries: (35.4038 %)
Density of grains: 0.646285 grains / mm2

Area = 0.999500 mm² +/- 0.491846 mm²
Perimeter = 9114.15 µm +/- 4570.38 µm
Equivalent diameter = 1098.61 µm +/- 256.235 µm
Mean diameter = 945.373 µm +/- 248.344 µm
Min diameter = 675.898 µm +/- 246.850 µm
Max diameter = 1312.43 µm +/- 295.258 µm

RESULTS & DISCUSSION: 3D Surface Boundary Measurement

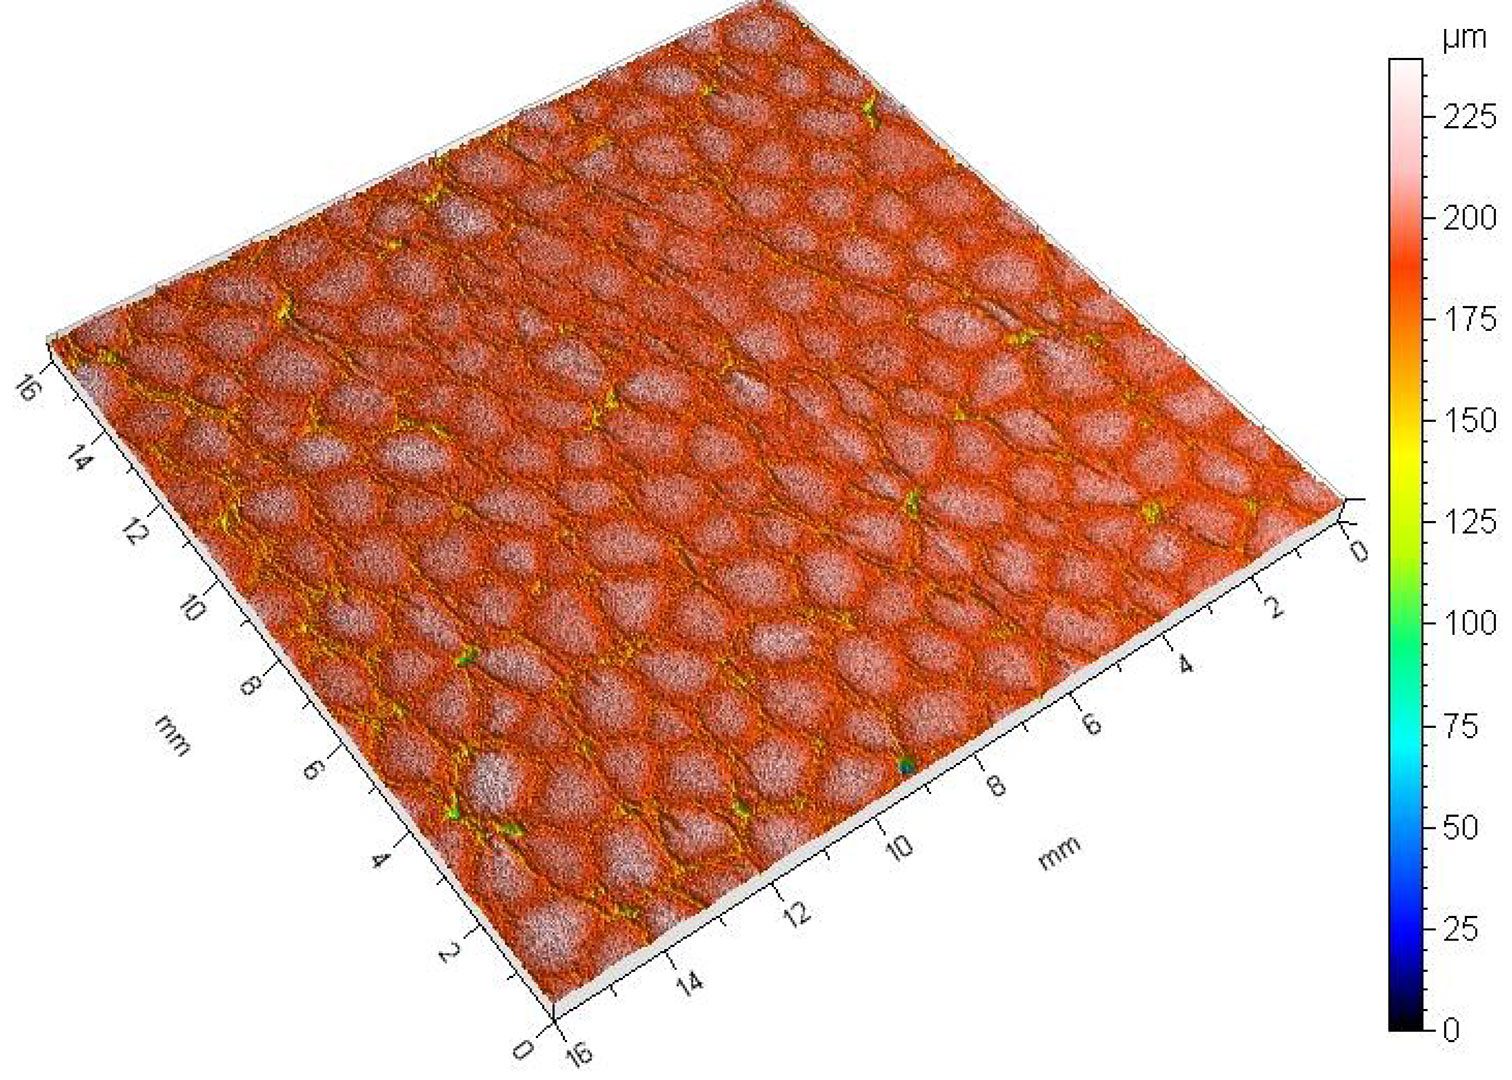
By using the 3D topography data obtained, the volume, height, peak, aspect ratio and general shape information can be analyzed on each grain. Total 3D area occupied: 2.525mm3

CONCLUSION

In this application, we have shown how the NANOVEA 3D Non Contact Profilometer can precisely characterize the surface of Styrofoam. Statistical information can be gained over the entire surface of interest or on individual grains, whether they are peaks or pits. In this example all grains larger than a user defined size were used to show the area, perimeter, diameter and height. The features shown here can be critical to research and quality control of natural and pre fabricated surfaces ranging from bio medical to micromachining applications along with many others. 

NOW, LET'S TALK ABOUT YOUR APPLICATION

Contour Measurement using Profilometer by NANOVEA

Rubber Tread Contour Measurement

Rubber Tread Contour Measurement

Learn More


RUBBER TREAD CONTOUR MEASUREMENT

USING 3D OPTICAL PROFILER

Rubber Tread Contour Measurement - NANOVEA Profiler

Prepared by

ANDREA HERRMANN

INTRODUCTION

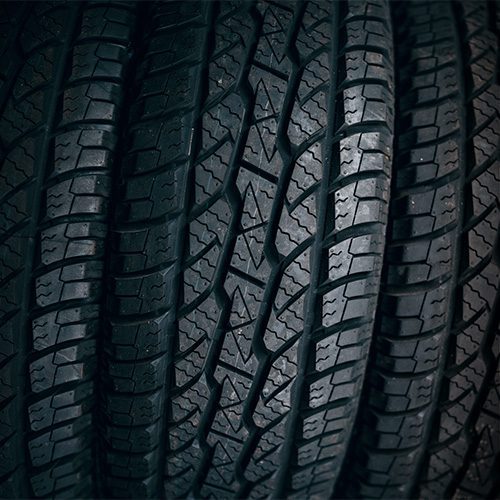
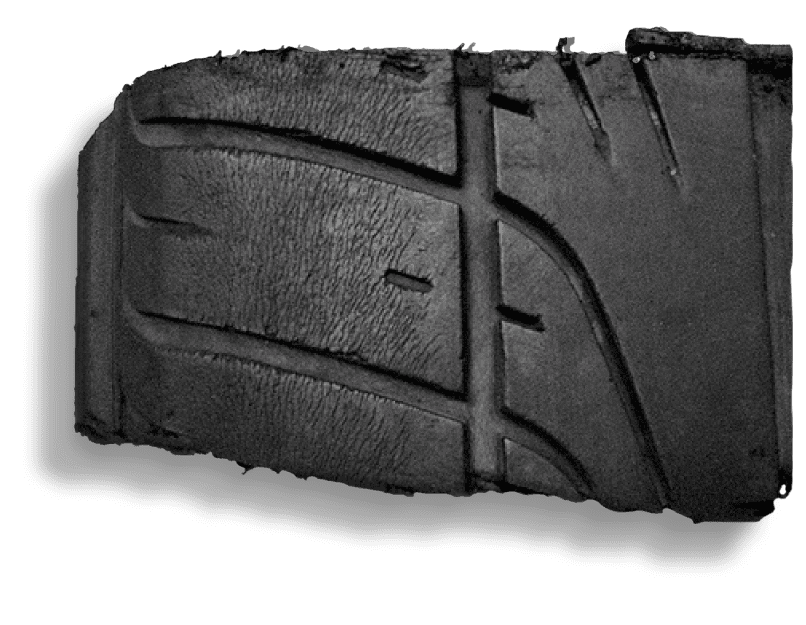
Like all materials, rubber’s coefficient of friction is related in part to its surface roughness. In vehicle tire applications, traction with the road is very important. Surface roughness and the tire’s treads both play a role in this. In this study, the rubber surface and tread’s roughness and dimensions are analyzed.

* THE SAMPLE

IMPORTANCE

OF 3D NON-CONTACT PROFILOMETRY

FOR RUBBER STUDIES

Unlike other techniques such as touch probes or interferometry, NANOVEA’s 3D Non-Contact Optical Profilers use axial chromatism to measure nearly any surface. 

The Profiler system’s open staging allows for a wide variety of sample sizes and requires zero sample preparation. Nano through macro range features can be detected during a single scan with zero influence from sample reflectivity or absorption. Plus, these profilers have the advanced ability to measure high surface angles without requiring software manipulation of results.

Easily measure any material: transparent, opaque, specular, diffusive, polished, rough etc. The measurement technique of the NANOVEA 3D Non-Contact Profilers provides an ideal, broad and user friendly capability to maximize surface studies along with the benefits of combined 2D & 3D capability.

MEASUREMENT OBJECTIVE

In this application, we showcase the NANOVEA ST400, a 3D Non-Contact Optical Profiler measuring the surface and treads of a rubber tire.

A sample surface area large enough to represent the entire tire surface was selected at random for this study. 

To quantify the rubber’s characteristics, we used the NANOVEA Ultra 3D analysis software to measure the contour dimensions, depth, roughness and developed area of the surface.

NANOVEA

ST400

ANALYSIS: TIRE TREAD

The 3D View and False Color View of the treads show the value of mapping 3D surface designs. It provides users a straightforward tool to directly observe the size and shape of the treads from different angles. The Advanced Contour Analysis and Step Height Analysis are both extremely powerful tools for measuring precise dimensions of sample shapes and design

ADVANCED CONTOUR ANALYSIS

STEP HEIGHT ANALYSIS

ANALYSIS: RUBBER SURFACE

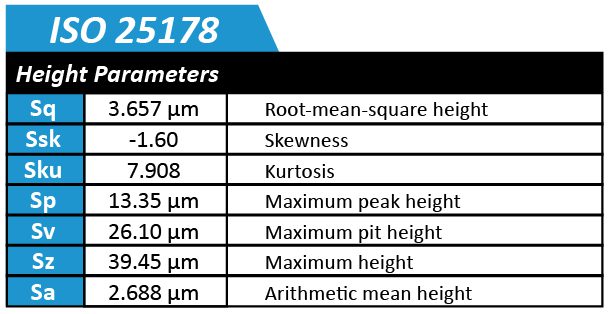
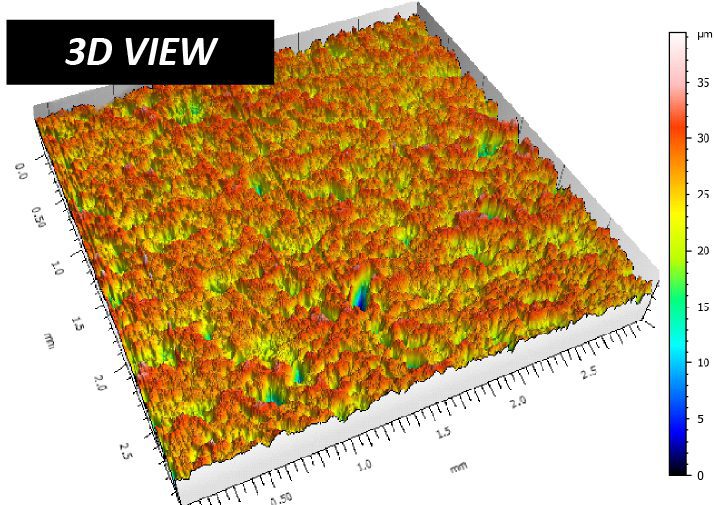
The rubber surface can be quantified in numerous ways using built-in software tools as shown in the following figures as examples. It can be observed that the surface roughness is 2.688 μm, and the developed area vs. projected area is 9.410 mm² vs. 8.997 mm². This information allows us to examine the relationship between surface finish and the traction of different rubber formulations or even rubber with varying degrees of surface wear.

CONCLUSION

In this application, we have shown how the NANOVEA 3D Non-Contact Optical Profiler can precisely characterize the surface roughness and tread dimensions of rubber.

The data shows a surface roughness of 2.69 ­µm and a developed area of 9.41 mm² with a projected area of 9 mm². Various dimensions and radii of the rubber treads were measured as well.

The information presented in this study can be used to compare the performance of rubber tires with di­fferent tread designs, formulations, or varying degrees of wear. The data shown here represents only a portion of the calculations available in the Ultra 3D analysis software.

NOW, LET'S TALK ABOUT YOUR APPLICATION

Machined Parts QC

Machined Parts Inspection

MACHINED PARTS

inspection from CAD model using 3D profilometry

Author:

Duanjie Li, PhD

Revised by

Jocelyn Esparza

Machined Parts Inspection with a Profilometer

INTRODUCTION

The demand for precision machining able to create complex geometries has been on the rise across a spectrum of industries. From aerospace, medical and automobile, to tech gears, machinery and musical instruments, the continuous innovation and evolution push expectations and accuracy standards to new heights. Consequently, we see the rise of the demand for rigorous inspection techniques and instruments to ensure the highest quality of the products.

Importance of 3D Non-Contact Profilometry for Parts Inspection

Comparing properties of machined parts to their CAD models is essential to verify tolerances and adherence to production standards. Inspection during the service time is also crucial as wear and tear of the parts may call for their replacement. Identification of any deviations from the required specifications in a timely manner will help avoid costly repairs, production halts and tarnished reputation.

Unlike a touch probe technique, the NANOVEA Optical Profilers perform 3D surface scans with zero contact, allowing for quick, precise and non-destructive measurements of complex shapes with the highest accuracy.

MEASUREMENT OBJECTIVE

In this application, we showcase NANOVEA HS2000, a 3D Non-Contact Profiler with a high-speed sensor, performing a comprehensive surface inspection of dimension, radius, and roughness. 

All in under 40 seconds.

NANOVEA

HS2000

CAD MODEL

A precise measurement of the dimension and surface roughness of the machined part is critical to make sure it meets the desired specifications, tolerances and surface finishes. The 3D model and the engineering drawing of the part to be inspected are presented below. 

FALSE COLOR VIEW

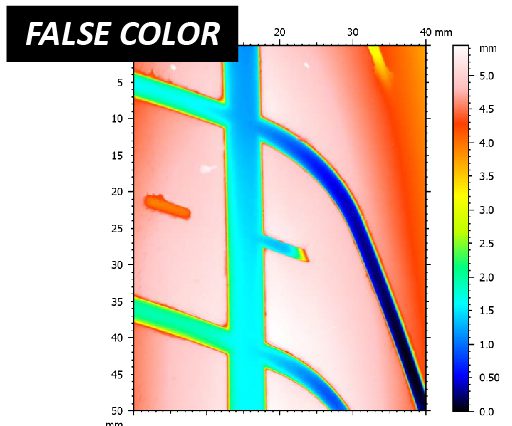
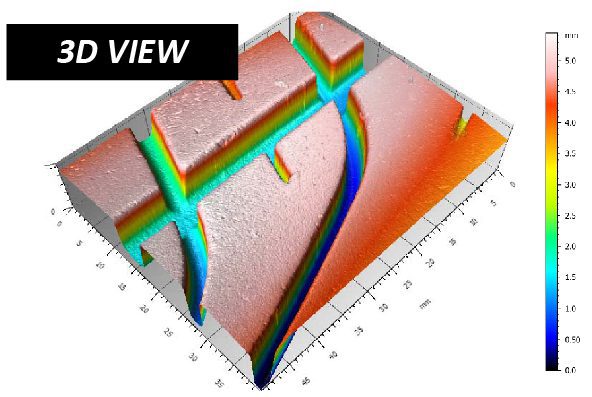
The false color view of the CAD model and the scanned machined part surface are compared in FIGURE 3. The height variation on the sample surface can be observed by the change in color.

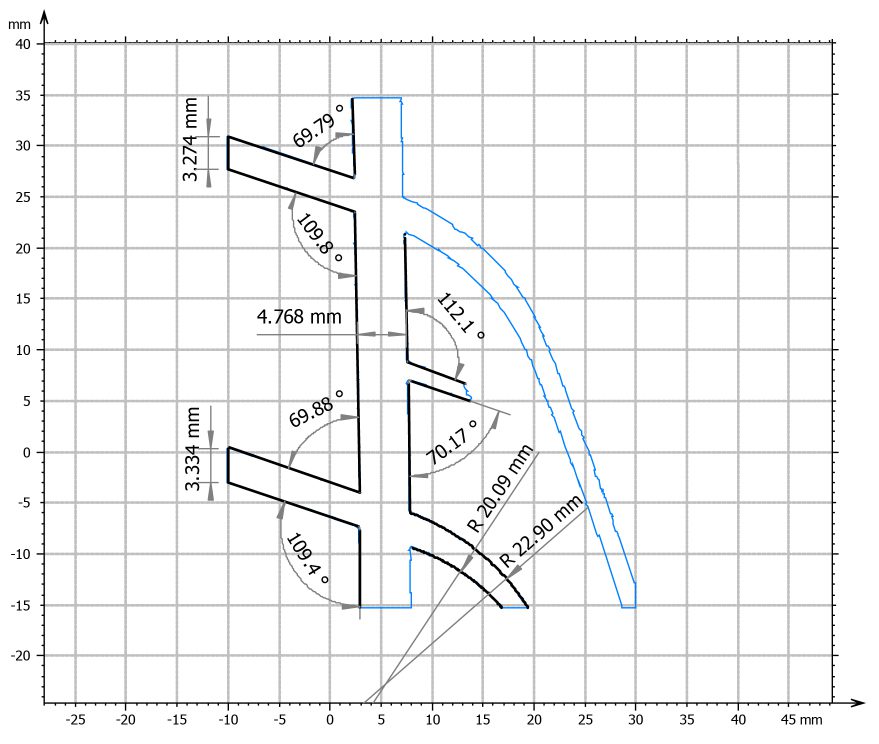
Three 2D profiles are extracted from the 3D surface scan as indicated in FIGURE 2 to further verify the dimensional tolerance of the machined part.

PROFILES COMPARISON & RESULTS

Profile 1 through 3 are shown in FIGURE 3 through 5. Quantitative tolerance inspection is carried out by comparing the measured profile with the CAD model to uphold rigorous manufacturing standards. Profile 1 and Profile 2 measure the radius of different areas on the curved machined part. The height variation of Profile 2 is 30 µm over a length of 156 mm which meets the desired ±125 µm tolerance requirement. 

By setting up a tolerance limit value, the analysis software can automatically determine pass or fail of the machined part.

Machine Parts Inspection with a Profilometer

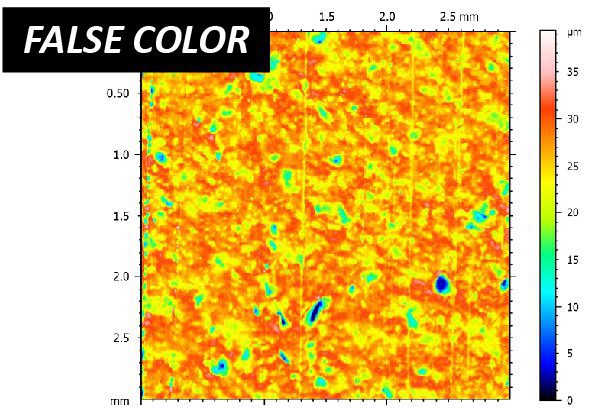
The roughness and uniformity of the machined part’s surface play an important role in ensuring its quality and functionality. FIGURE 6 is an extracted surface area from the parent scan of the machined part which was used to quantify the surface finish. The average surface roughness (Sa) was calculated to be 2.31 µm.

CONCLUSION

In this study, we have showcased how the NANOVEA HS2000 Non-Contact Profiler equipped with a high speed sensor performs comprehensive surface inspection of dimensions and roughness. 

High-resolution scans enable users to measure detailed morphology and surface features of machined parts and to quantitatively compare them with their CAD models. The instrument is also capable of detecting any defects including scratches and cracks. 

The advanced contour analysis serves as an unparalleled tool not only to determine whether the machined parts satisfy the set specifications, but also to evaluate the failure mechanisms of the worn components.

The data shown here represents only a portion of the calculations possible with the advanced analysis software that comes equipped with every NANOVEA Optical Profiler.


NOW, LET'S TALK ABOUT YOUR APPLICATION

Dental-Screws-dimensional-measurement-using-3d-profilometer

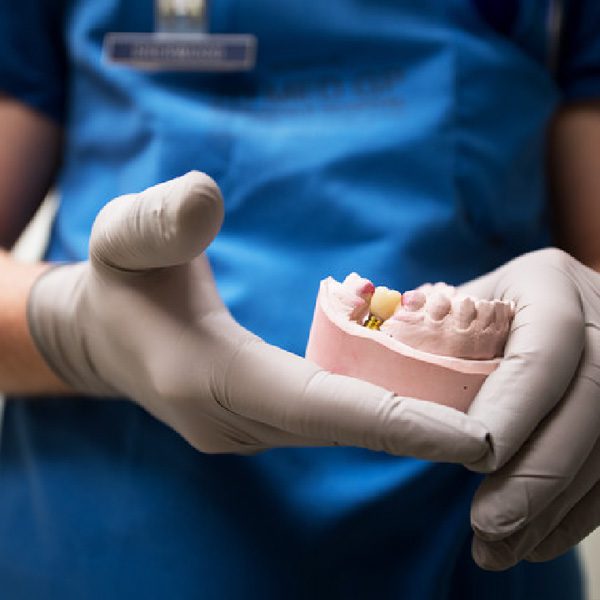
Dental Tools: Dimensional and Surface Roughness Analysis


INTRODUCTION


Having precise dimensions and optimal surface roughness are vital to the functionality of dental screws. Many dental screw dimensions require high precision such as radii, angles, distances, and step heights. Understanding local surface roughness is also highly important for any medical tool or part being inserted inside the human body to minimize sliding friction.


NON-CONTACT PROFILOMETRY FOR DIMENSIONAL STUDY


Nanovea 3D Non-Contact Profilers use a chromatic light-based technology to measure any material surface: transparent, opaque, specular, diffusive, polished or rough. Unlike a touch probe technique, the non-contact technique can measure inside tight areas and will not add any intrinsic errors due to deformation caused by the tip pressing on a softer plastic material.  Chromatic light-based technology also offers superior lateral and height accuracies compared to focus variation technology. Nanovea Profilers can scan large surfaces directly without stitching and profile the length of a part in a few seconds. Nano through macro range surface features and high surface angles can be measured due to the profiler’s ability to measure surfaces without any complex algorithms manipulating the results.


MEASUREMENT OBJECTIVE


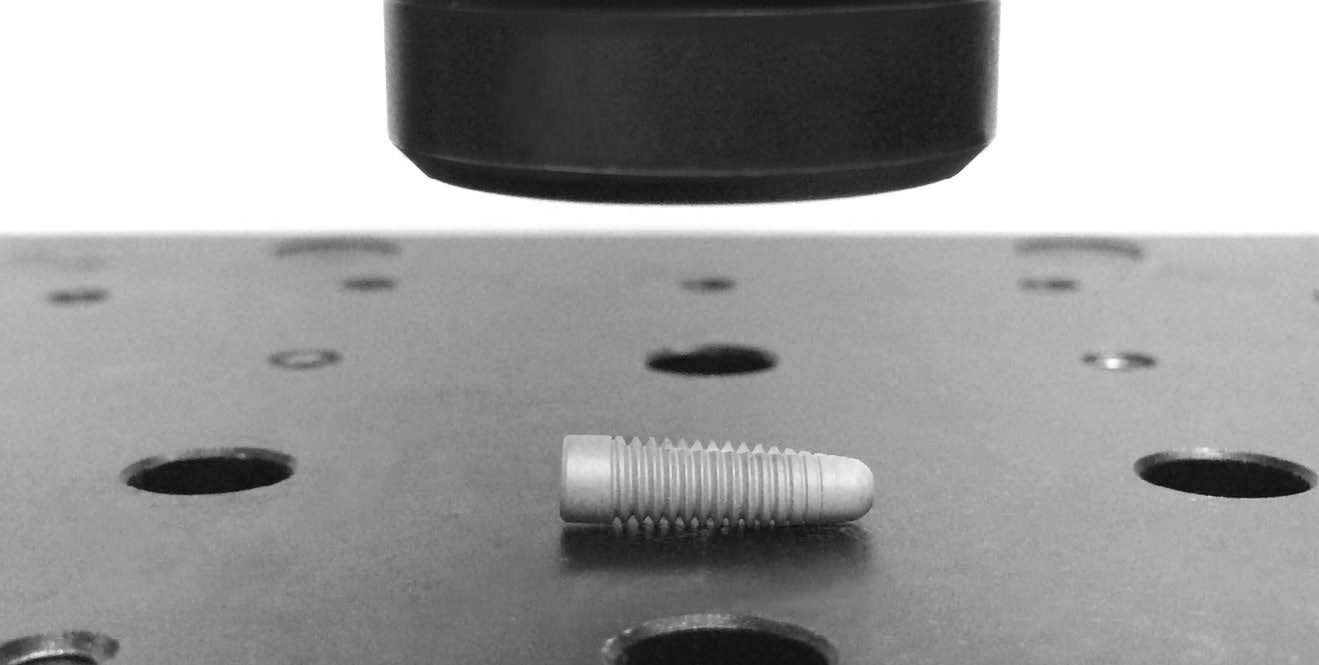
In this application, the Nanovea ST400 Optical Pro­filer was used to measure a dental screw along flat and thread features in a single measurement. The surface roughness was calculated from the flat area, and various dimensions of the threaded features were determined.


dental screw quality control

Sample of dental screw analyzed by NANOVEA Optical Profiler.


Dental screw sample analyzed.


RESULTS


3D Surface

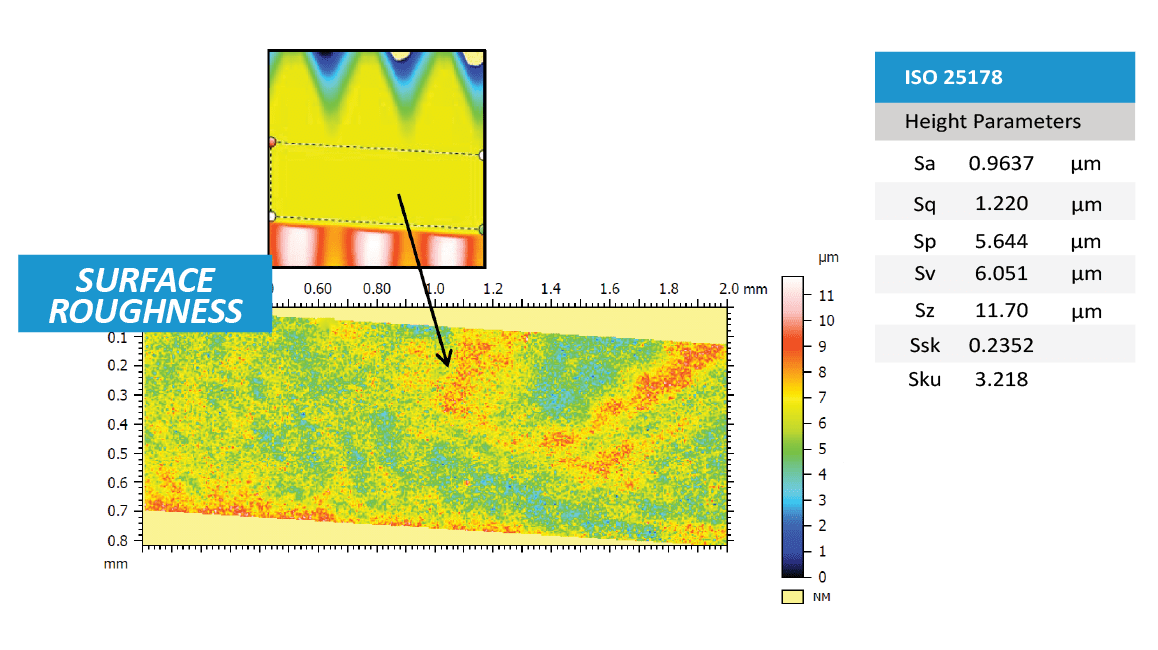
The 3D View and False Color View of the dental screw shows a flat area with threading starting on either side. It provides users a straightforward tool to directly observe the morphology of the screw from different angles. The flat area was extracted from the full scan to measure its surface roughness.


2D Surface Analysis

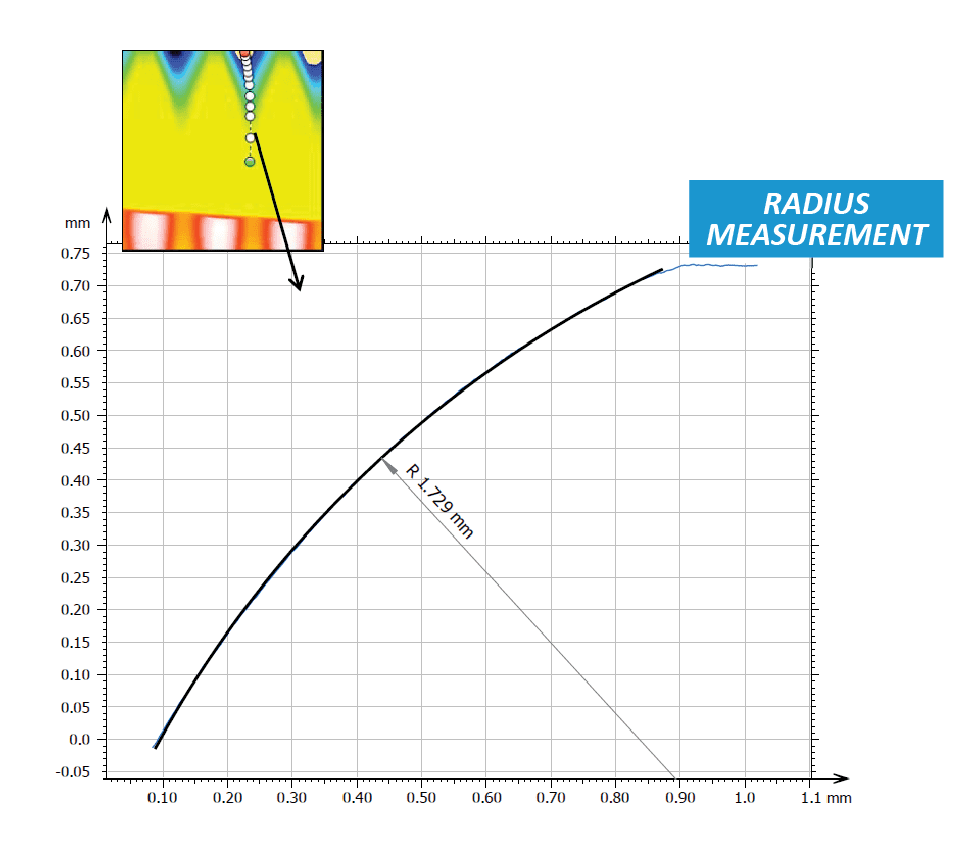
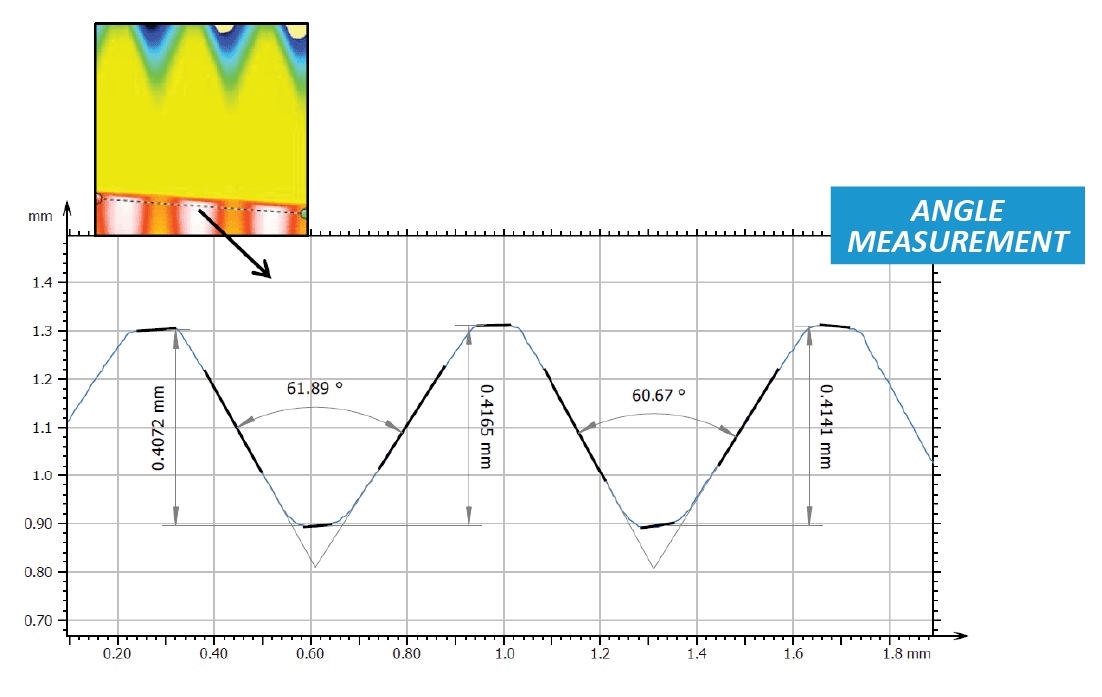
Line profiles can also be extracted from the surface to show a cross-sectional view of the screw. The Contour Analysis and step height studies were used to measure precise dimensions at a certain location on the screw.


CONCLUSION


In this application, we have showcase the Nanovea 3D Non-Contact Profiler’s ability to precisely calculate local surface roughness and measure large dimensional features in a single scan.

The data shows a local surface roughness of 0.9637 μm. The radius of the screw between threads was found to be 1.729 mm, and the threads had an average height of 0.413 mm. The average angle between the threads was determined to be 61.3°.

The data shown here represents only a portion of the calculations available in the analysis software.


Prepared by
Duanjie Li, PhD., Jonathan Thomas, and Pierre Leroux

Wear and Scratch Evaluation of Surface Treated Copper Wire

Importance of Wear and Scratch Evaluation of Copper Wire

Copper has a long history of use in electric wiring since the invention of the electromagnet and telegraph. Copper wires are applied in a wide range of electronic equipment such as panels, meters, computers, business machines, and appliances thanks to its corrosion resistance, solderability, and performance at elevated temperatures up to 150°C. Approximately half of all mined copper is used for manufacturing electrical wire and cable conductors.

Copper wire surface quality is critical to application service performance and lifetime. Micro defects in wires may lead to excessive wear, crack initiation and propagation, decreased conductivity, and inadequate solderability. Proper surface treatment of copper wires removes surface defects generated during wire drawing improving corrosion, scratch, and wear resistance. Many aerospace applications with copper wires require controlled behavior to prevent unexpected equipment failure. Quantifiable and reliable measurements are needed to properly evaluate the wear and scratch resistance of the copper wire surface.


Measurement Objective

In this application we simulate a controlled wear process of different copper wire surface treatments. Scratch testing measures the load required to cause failure on the treated surface layer. This study showcases the Nanovea Tribometer and Mechanical Tester as ideal tools for evaluation and quality control of electric wires.


Test Procedure and Procedures

Coefficient of friction (COF) and wear resistance of two different surface treatments on copper wires (Wire A and Wire B) were evaluated by the Nanovea tribometer using a linear reciprocating wear module. An Al₂O₃ ball (6 mm diameter) is the counter material used in this application. The wear track was examined using Nanovea’s 3D non-contact profilometer. Test parameters are summarized in Table 1.

A smooth Al₂O₃ ball as a counter material was used as an example in this study. Any solid material with different shape and surface finish can be applied using a custom fixture to simulate the actual application situation.


Nanovea’s mechanical tester equipped with a Rockwell C diamond stylus (100 μm radius) performed progressive load scratch tests on the coated wires using micro scratch mode. Scratch test parameters and tip geometry are shown in Table 2.


Results and Discussion

Wear of copper wire:

Figure 2 shows COF evolution of the copper wires during wear tests. Wire A shows a stable COF of ~0.4 throughout the wear test while wire B exhibits a COF of ~0.35 in the first 100 revolutions and progressively increases to ~0.4.


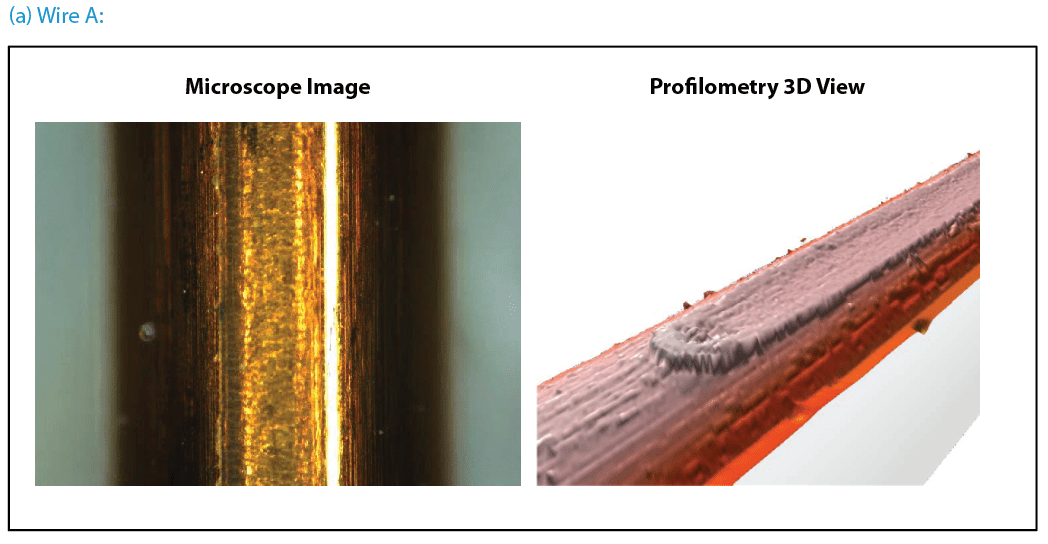
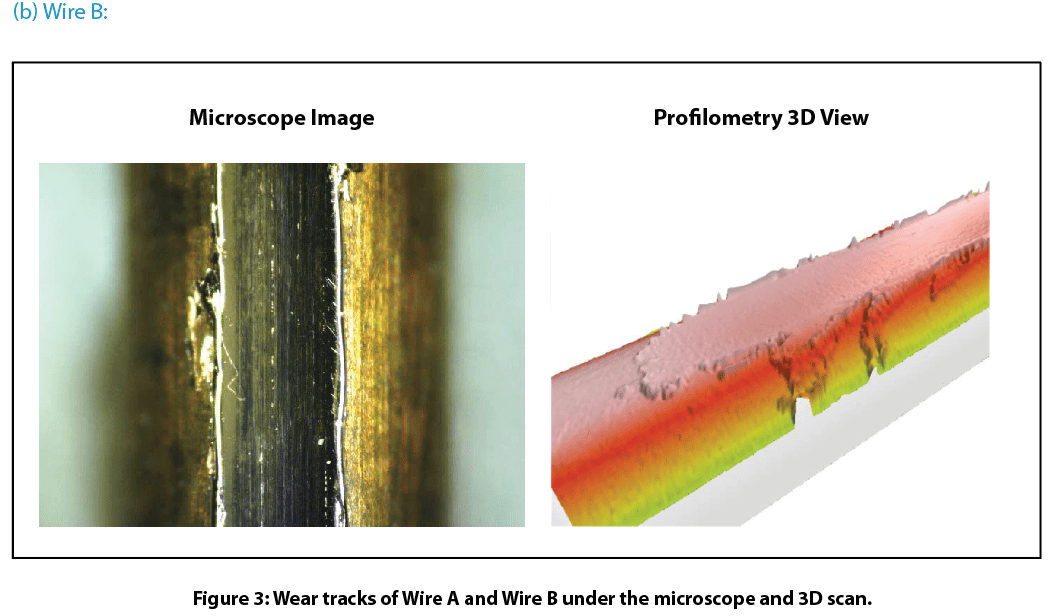
Figure 3 compares wear tracks of the copper wires after tests. Nanovea’s 3D non-contact profilometer offered superior analysis of the detailed morphology of wear tracks. It allows direct and accurate determination of the wear track volume by providing a fundamental understanding of the wear mechanism. Wire B’s surface has signi¬ficant wear track damage after a 600-revolution wear test. The profilometer 3D view shows the surface treated layer of Wire B removed completely which substantially accelerated the wear process. This left a flattened wear track on Wire B where copper substrate is exposed. This may result in significantly shortened lifespan of electrical equipment where Wire B is used. In comparison, Wire A exhibits relatively mild wear shown by a shallow wear track on the surface. The surface treated layer on Wire A did not remove like the layer on Wire B under the same conditions.

Scratch resistance of the copper wire surface:

Figure 4 shows the scratch tracks on the wires after testing. The protective layer of Wire A exhibits very good scratch resistance. It delaminates at a load of ~12.6 N. In comparison, the protective layer of Wire B failed at a load of ~1.0 N. Such a significant difference in scratch resistance for these wires contributes to their wear performance, where Wire A possesses substantially enhanced wear resistance. The evolution of normal force, COF, and depth during the scratch tests shown in Fig. 5 provides more insight on coating failure during tests.

Conclusion

In this controlled study we showcased the Nanovea’s tribometer conducting quantitative evaluation of wear resistance for surface treated copper wires and Nanovea’s mechanical tester providing reliable assessment of copper wire scratch resistance. Wire surface treatment plays a critical role in the tribo-mechanical properties during their lifetime. Proper surface treatment on Wire A significantly enhanced wear and scratch resistance, critical in the performance and lifespan of electrical wires in rough environments.

Nanovea’s tribometer offers precise and repeatable wear and friction testing using ISO and ASTM compliant rotative and linear modes, with optional high temperature wear, lubrication, and tribo-corrosion modules available in one pre-integrated system. Nanovea’s unmatched range is an ideal solution for determining the full range of tribological properties of thin or thick, soft or hard coatings, films, and substrates.

NOW, LET'S TALK ABOUT YOUR APPLICATION

3D Surface Analysis of a Penny with Non-contact Profilometry

Importance of Non-contact Profilometry for Coins

Currency is highly valued in modern society because it is traded for goods and services. Coin and paper bill currency circulates around the hands of many people. Constant transfer of physical currency creates surface deformation. Nanovea’s 3D Profilometer scans the topography of coins minted in different years to investigate surface differences.

Coin features are easily recognizable to the general public since they are common objects. A penny is ideal for introducing the strength of Nanovea’s Advanced Surface Analysis Software: Mountains 3D. Surface data collected with our 3D Profilometer allows for high level analyses on complex geometry with surface subtraction and 2D contour extraction. Surface subtraction with a controlled mask, stamp, or mold compares the quality of manufacturing processes while contour extraction identifies tolerances with dimensional analysis. Nanovea’s 3D Profilometer and Mountains 3D software investigates the submicron topography of seemingly simple objects, like pennies.


Measurement Objective

The full upper surface of five pennies were scanned using Nanovea’s High-Speed Line Sensor. The inner and outer radius of each penny was measured using Mountains Advanced Analysis Software. An extraction from each penny surface at an area of interest with direct surface subtraction quantified surface deformation.


Results and Discussion

3D Surface

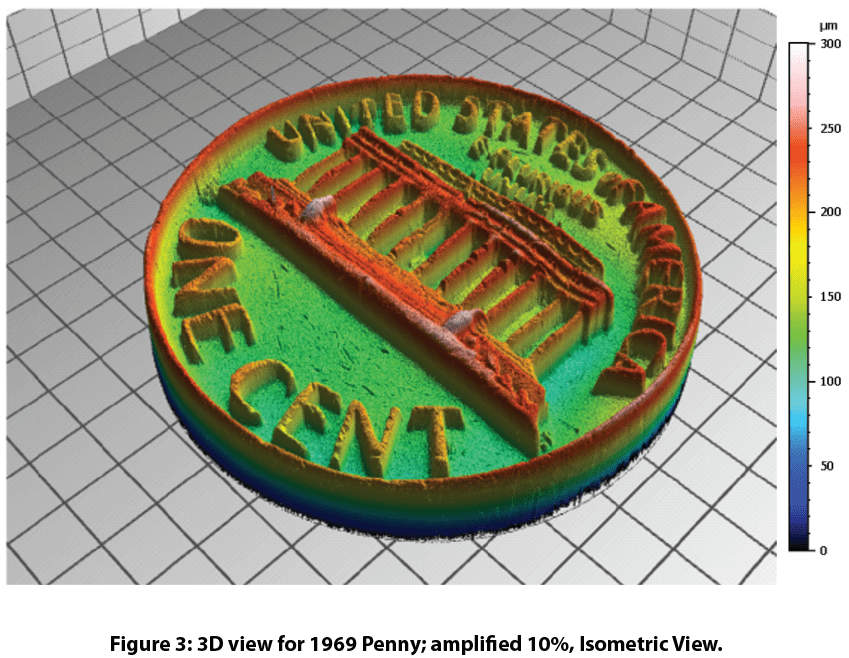
The Nanovea HS2000 profilometer took only 24 seconds to scan 4 million points in a 20mm x 20mm area with a 10um x 10um step size to acquire the surface of a penny. Below is a height map and 3D visualization of the scan. The 3D view shows the High-Speed sensor’s ability to pick up small details unperceivable to the eye. Many small scratches are visible across the surface of the penny. Texture and roughness of the coin seen in the 3D view are investigated.


Dimensional Analysis

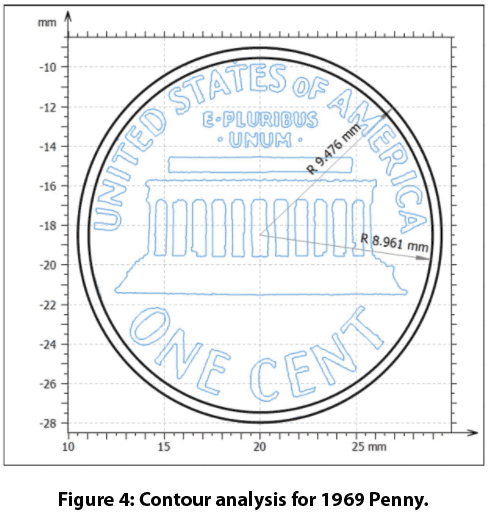
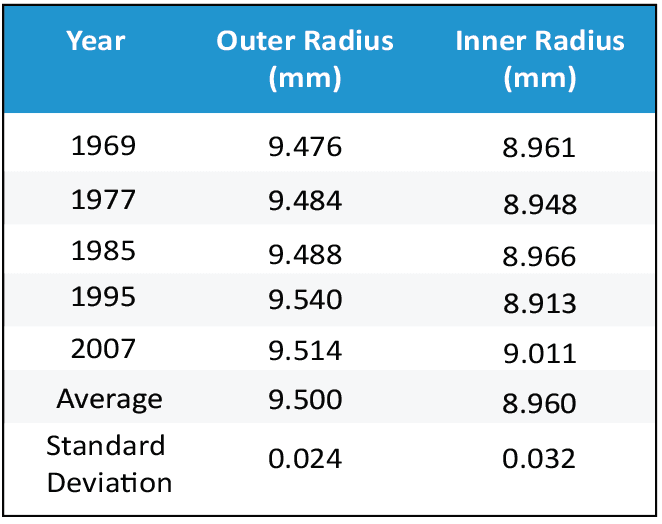
The contours of the penny were extracted and dimensional analysis obtained inner and outer diameters of the edge feature. The outer radius averaged 9.500 mm ± 0.024 while the inner radius averaged 8.960 mm ± 0.032. Additional dimensional analyses Mountains 3D can do on 2D and 3D data sources are distance measurements, step height, planarity, and angle calculations.


Surface Subtraction

Figure 5 shows the area of interest for the surface subtraction analysis. The 2007 penny was used as the reference surface for the four older pennies. Surface subtraction from the 2007 penny surface shows differences between pennies with holes/peaks. Total surface volume difference is obtained from adding volumes of the holes/peaks. The RMS error refers to how closely penny surfaces agree with each other.


Conclusion


Nanovea’s High-Speed HS2000L scanned five pennies minted in different years. Mountains 3D software compared surfaces of each coin using contour extraction, dimensional analysis, and surface subtraction. The analysis clearly defines the inner and outer radius between the pennies while directly comparing surface feature differences. With Nanovea’s 3D profilometer’s ability to measure any surfaces with nanometer-level resolution, combined with Mountains 3D analysis capabilities, the possible Research and Quality Control applications are endless.


NOW, LET'S TALK ABOUT YOUR APPLICATION